0236
A repository-integrated framework for rapid clinical analysis of MR-derived hypoxia maps.1Division of Cancer Sciences, The University of Manchester, Manchester, United Kingdom, 2Department of Radiology, University of Cambridge, Cambridge, United Kingdom, 3MRI Unit, The Royal Marsden NHS Foundation Trust, London, United Kingdom, 4Division of Radiotherapy and Imaging, The Institute of Cancer Research, London, United Kingdom, 5Centre for Medical Image Computing, Dept of Medical Physics and Biomedical Engineering, University College London, London, United Kingdom, 6Department of Oncology, University of Oxford, Oxford, United Kingdom, 7Oxford Centre for Clinical Magnetic Resonance Research, University of Oxford, Oxford, United Kingdom, 8Department of Radiology, Oxford University Hospital NHS Foundation Trust, Oxford, United Kingdom, 9Centre for Medical Imaging, Division of Medicine, University College London, London, United Kingdom, 10Department of Medical Physics and Clinical Engineering, Oxford University Hospital NHS Foundation Trust, Oxford, United Kingdom, 11Department of Oncology, Oxford University Hospital NHS Foundation Trust, Oxford, United Kingdom, 12Bioxydyn Ltd, Manchester, United Kingdom, 13Division of Neurosurgery, Oxford University Hospital NHS Foundation Trust, Oxford, United Kingdom
Synopsis
Keywords: Data Processing, Cancer, Clinical Translation
Motivation: Translation of quantitative biomarkers requires a reproducible and efficient analysis environment to underpin assessments of clinical utility.
Goal(s): This study aimed to provide a 24-hour turnaround of clinically relevant MR-derived hypoxia maps for use in biopsy planning.
Approach: The analysis framework was integrated into an XNAT imaging repository and applied to oxygen-enhanced and dynamic-contrast-enhanced images to quantify and map the extent of hypoxia within low-grade glioma.
Results: A group of geo-dispersed researchers consistently delivered MR-derived hypoxia maps to the clinical study team for use alongside 18F-FDOPA PET in biopsy site definition prior to surgery.
Impact: A framework of repository-integrated analysis enabled rapid turnaround of quantitative MR imaging biomarkers for clinical decision-making. Specifically, biopsy-planning using MR-derived hypoxia mapping of low-grade glioma was delivered with standardised, reproducible, auditable results in under 24 hours.
Introduction
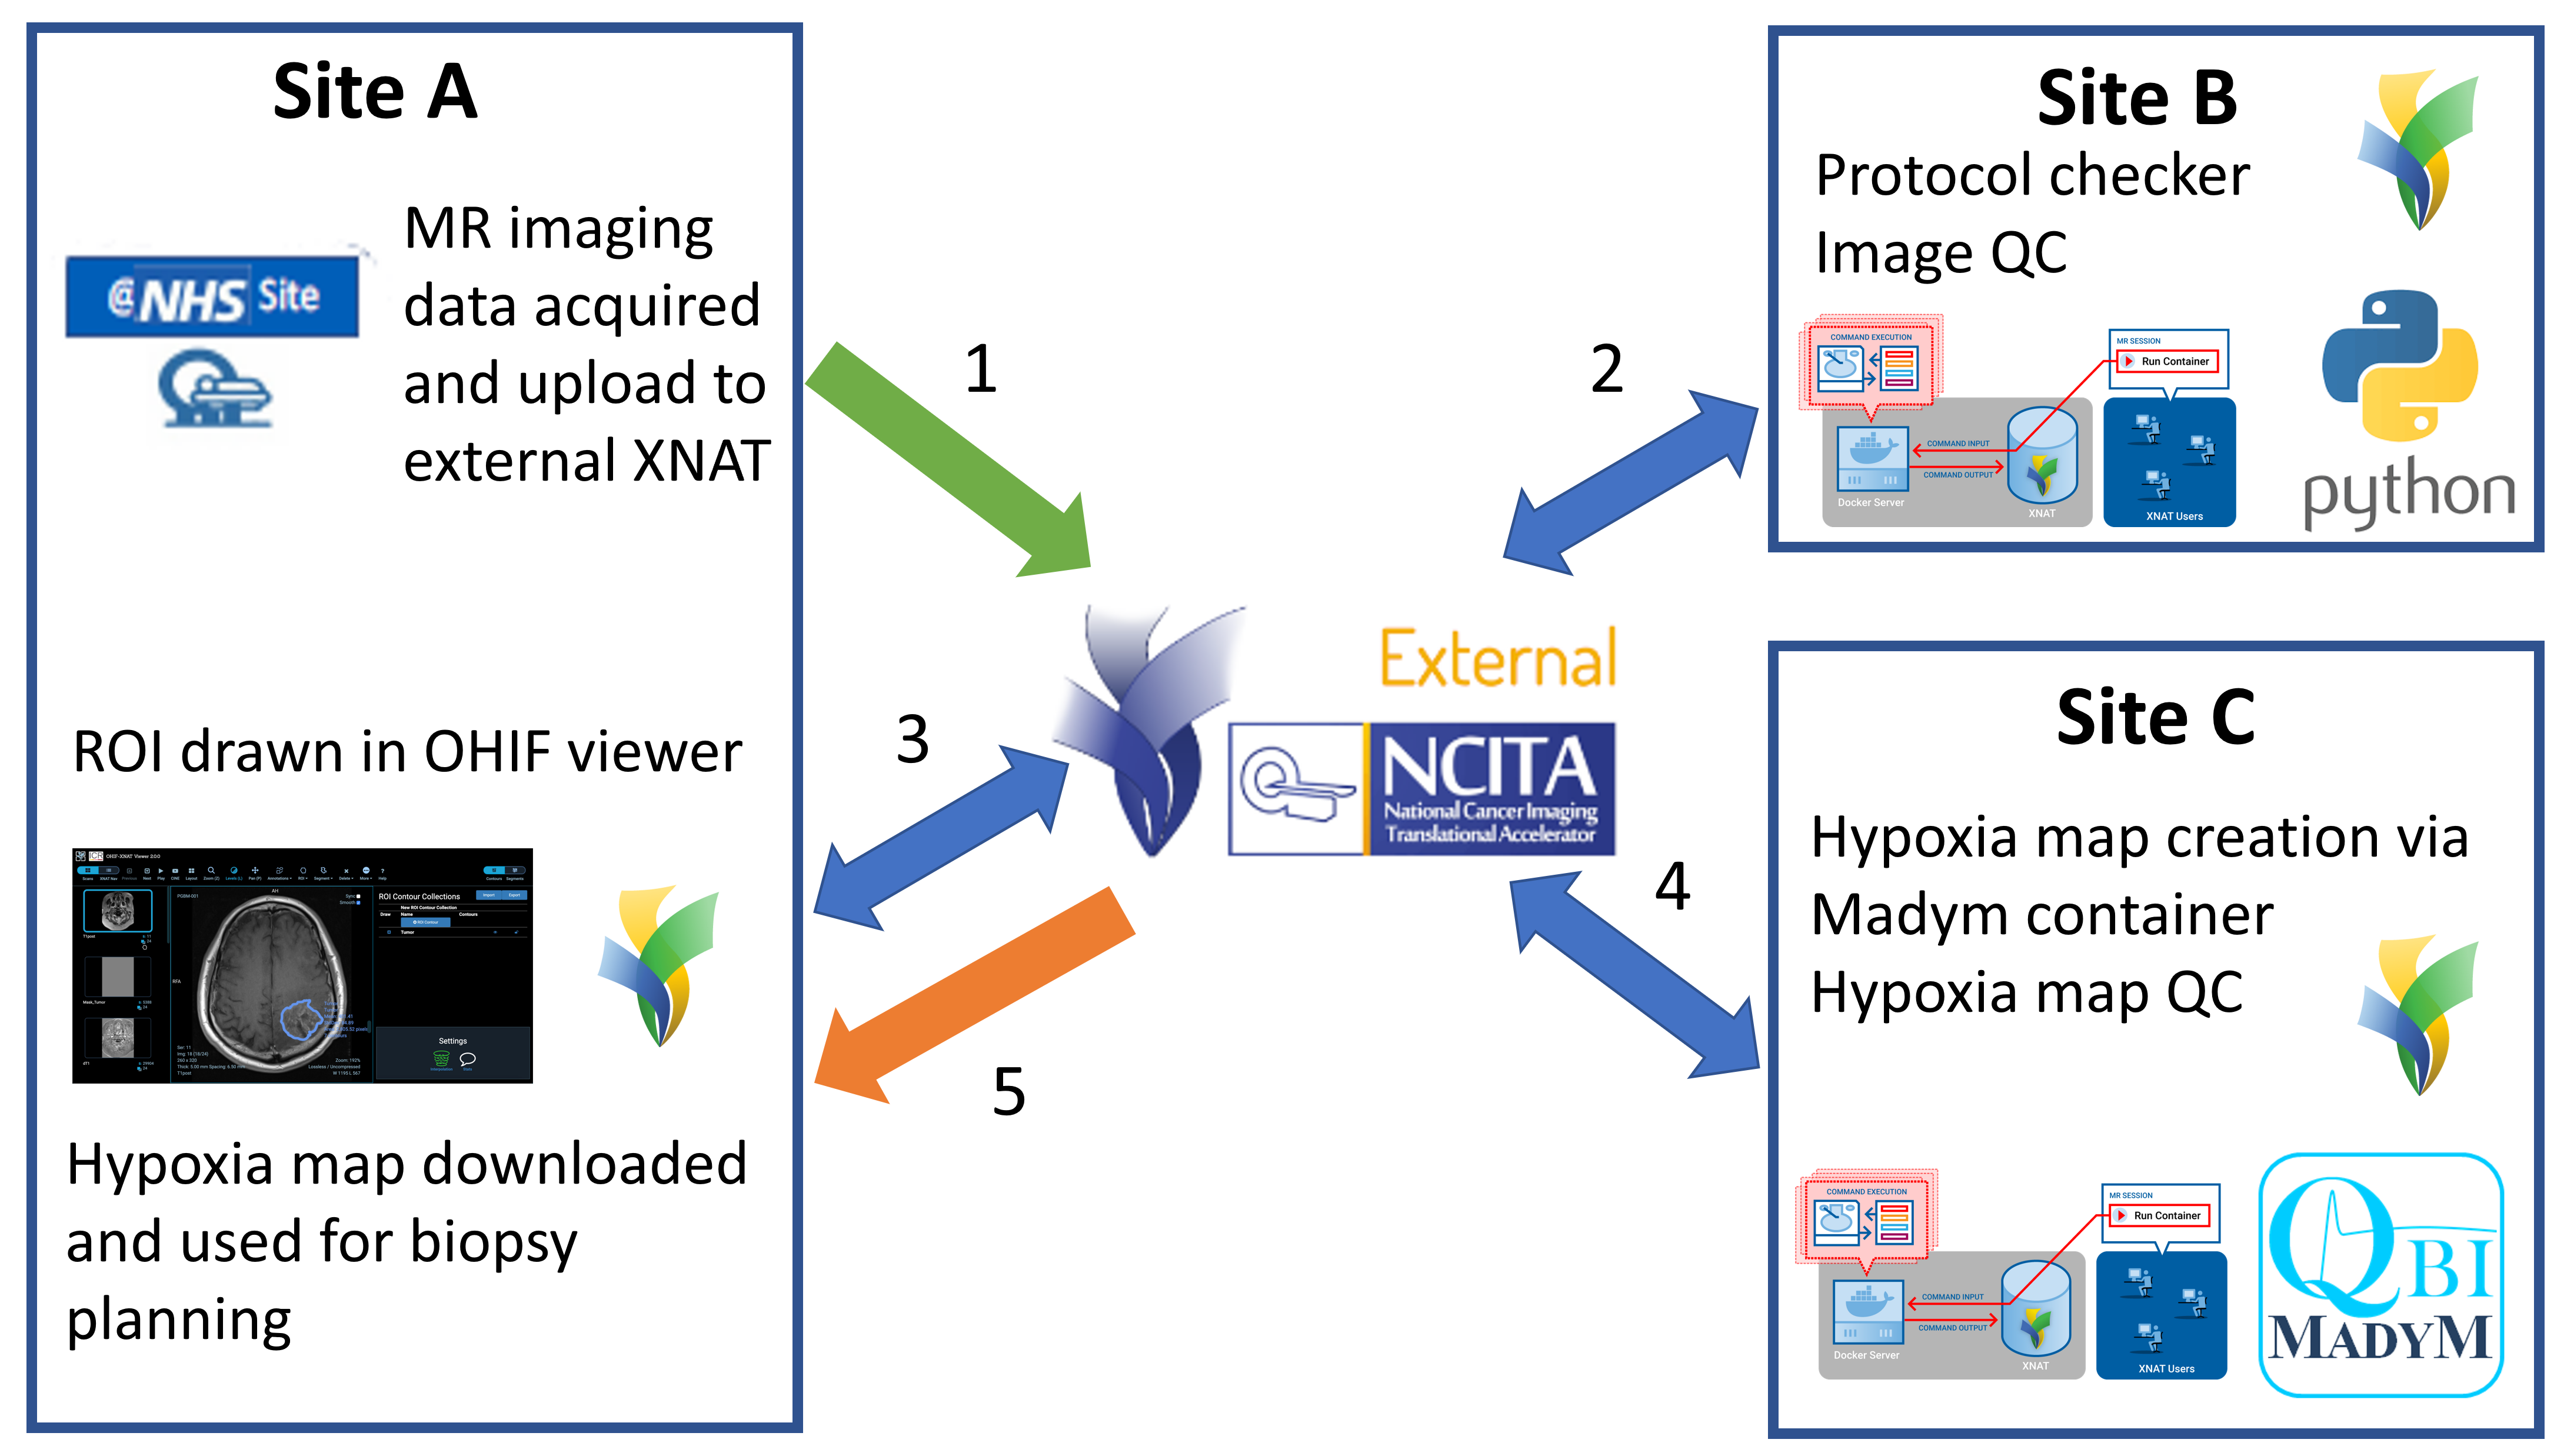
The use of quantitative MR (qMR) biomarkers in clinical research studies has increased over the past decade [1]. However, the overwhelming majority of qMR biomarkers developed in academia fail to cross the translational gaps [2]. One barrier to clinical translation is the integration of analysis software into the clinical workflow, where end-users require qMR biomarker maps to be provided via a standardised, reproducible, and efficient, processing pipeline soon after acquisition to enable clinical decision-making.The FIG trial (https://ncita.org.uk/exemplar-7/) was a phase 1 study to assess the feasibility of performing 18F-FDOPA PET-guided histopathology using standardised PET protocols in low-grade glioma with planned surgical resection [3]. The viability of using oxygen-enhanced (OE-) MRI and dynamic contrast-enhanced (DCE-) MRI to quantify and map the extent of regional hypoxia within these tumours was also explored. Here we describe an analysis framework to derive hypoxia maps from MR within the XNAT informatics platform [4]. The developed framework allows quality-controlled (QC) MR-derived hypoxia maps to be created and incorporated into the clinical workflow for biopsy planning, within a 24-hour window post-acquisition, by a geographically dispersed study team that collaborated under the UK National Cancer Imaging Translational Accelerator (NCITA) network [5].
Methods
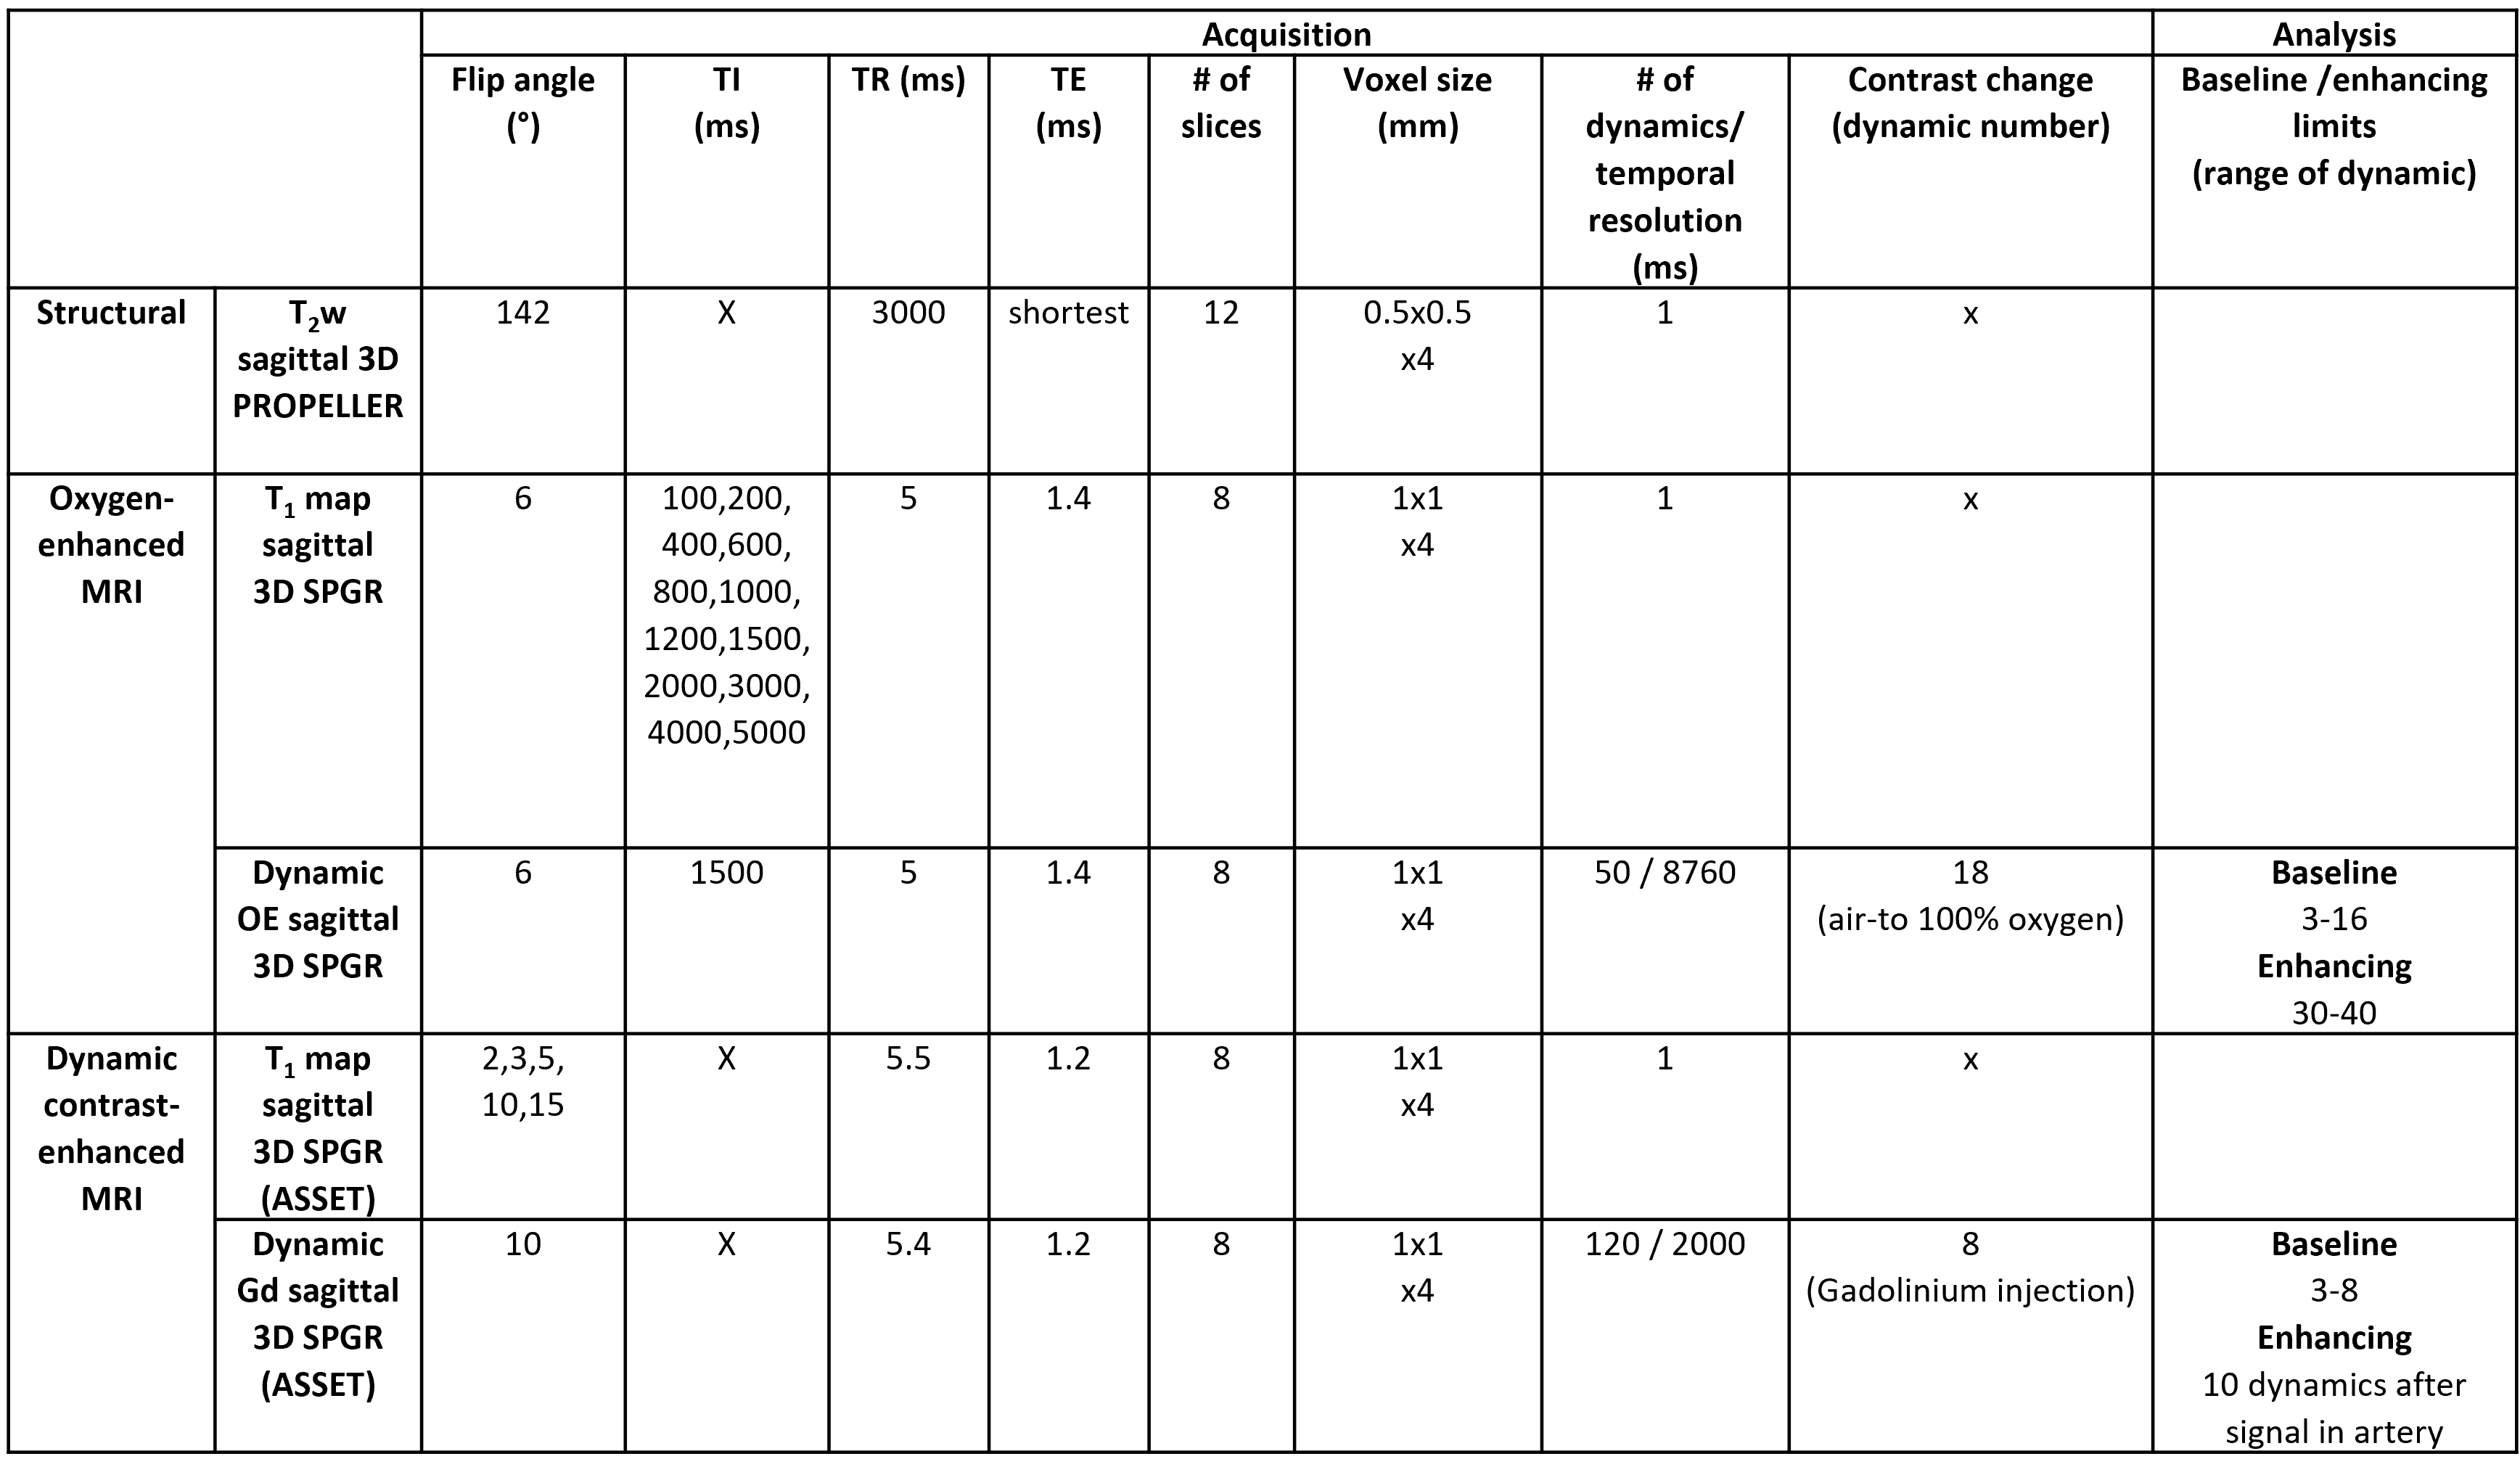
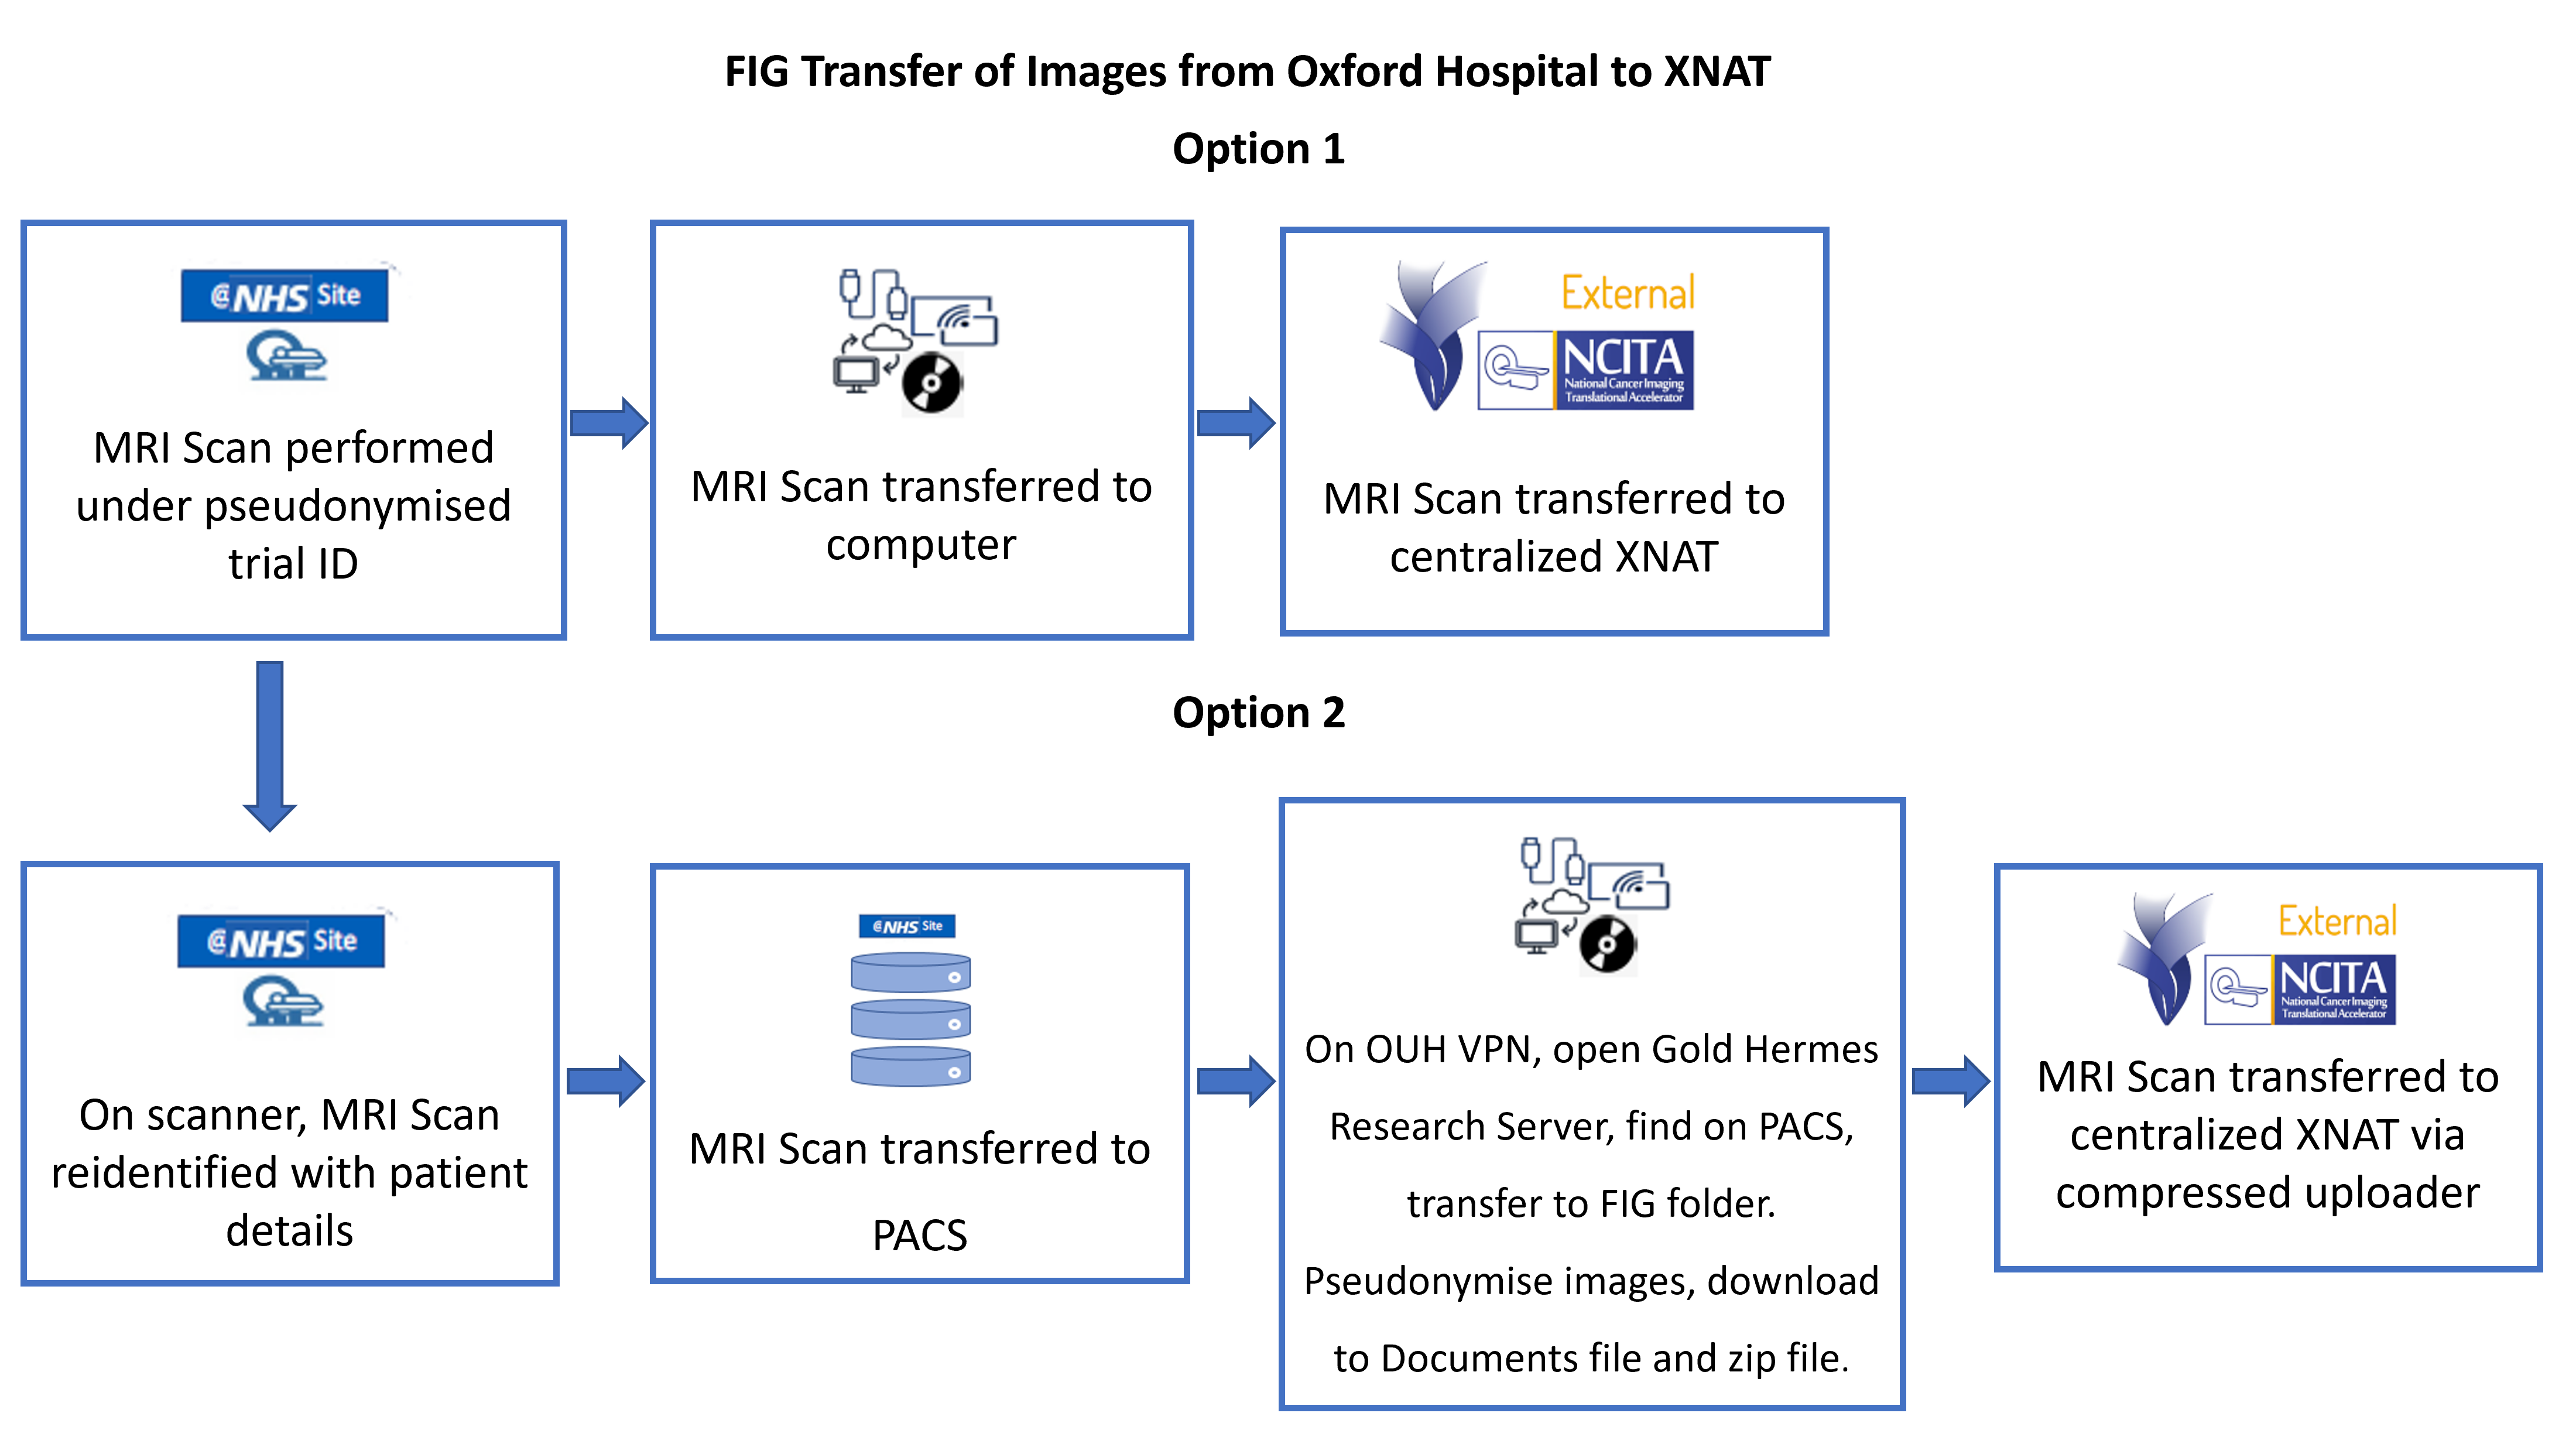
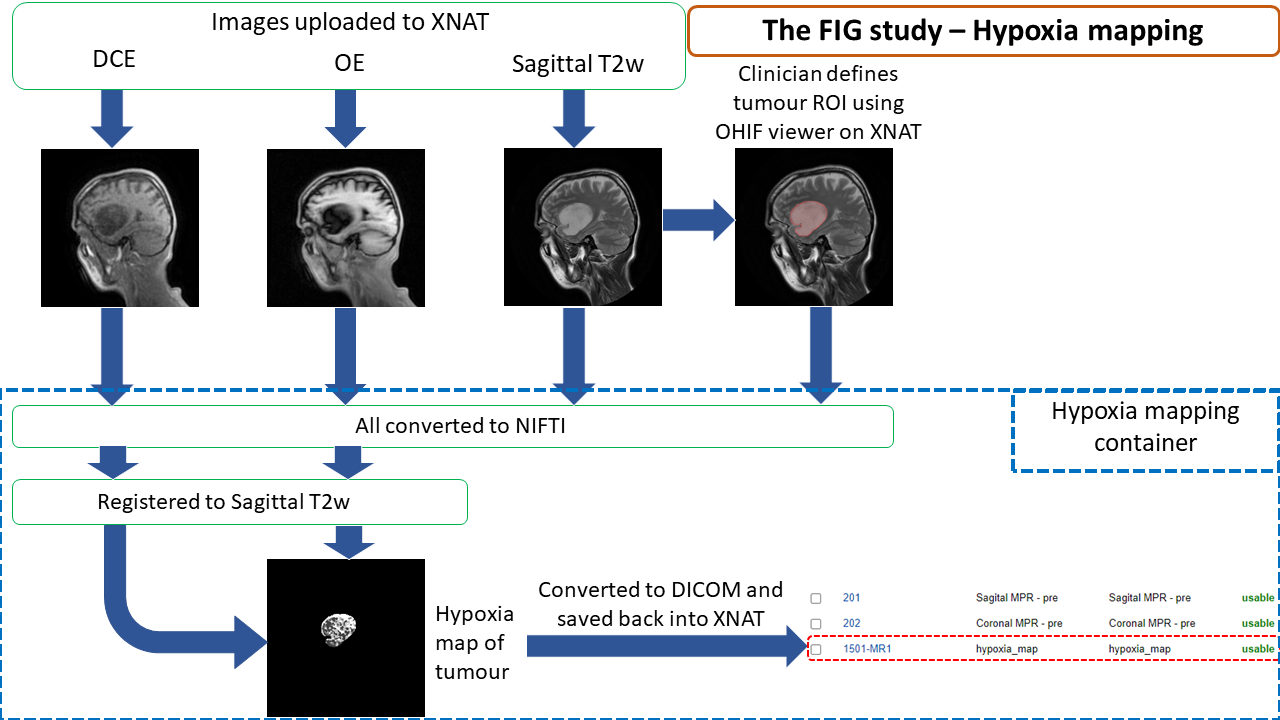
MR-derived hypoxia imaging data for 13 patients with glioma were acquired on a 1.5T SIGNA Artist (GE Medical Systems) scanner at the Churchill Hospital Oxford, UK (ClinicalTrials.gov Identifier:NCT04870580; Ethics:21/LO/0258). The imaging protocol included T2-weighted structural images and 3D SPGR acquisitions to map initial T1 and dynamic series for both OE-MRI (air-to-oxygen) and DCE-MRI (gadolinium injection). See Table 1.Pseudonymised imaging data were uploaded onto the centralised NCITA XNAT repository via a web interface (Figure 1). Data were checked for compliance with the imaging protocol and for image quality issues using repository-integrated tools detailed elsewhere [4]. A clinician (JR) used the XNAT-integrated OHIF viewer [7], developed by NCITA, to define the tumour region of interest (ROI) on the structural images. The quantitative MR analysis toolbox, Madym (v4.22.0) [8], and Python shell scripts were containerised using Docker and installed on XNAT (v1.8.9) [7] using the container service plugin (v3.4.1) [9] and used to calculate the hypoxia maps for all tumours (Figure 2).
The container:
- converted the ROI/imaging data from DICOM to NIFTI format.
- registered the DCE and OE images to the structural data via ANTs [10]
- processed the DCE and OE images to create the hypoxia maps for the tumour ROI [11]
- converted the hypoxia map back to DICOM, viewable via the XNAT OHIF viewer [7].
Results
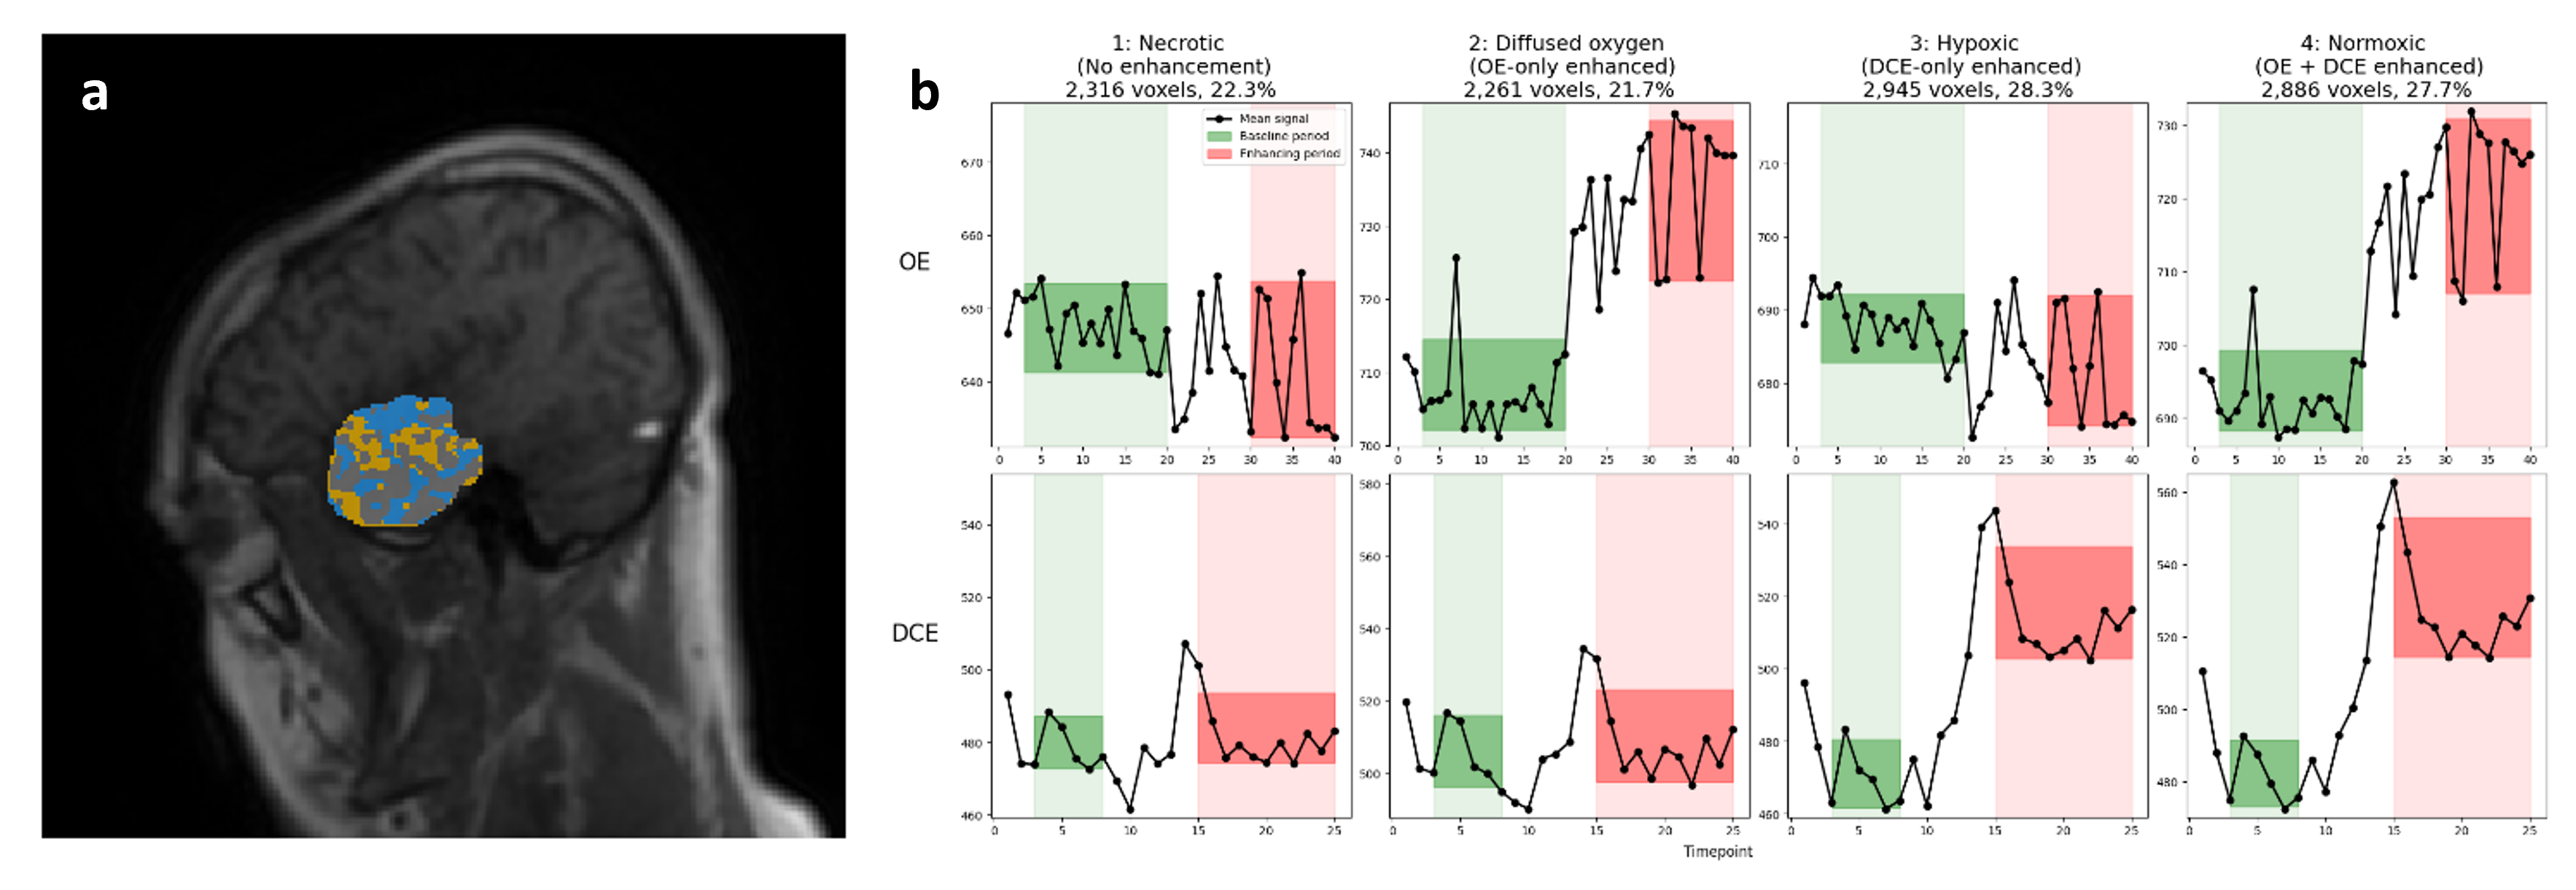
All 13 datasets were analysed and produced MR-derived hypoxia maps showing areas of normoxic (perfused, oxygenated), hypoxic (perfused, non-oxygenated), and non-perfused tissue (includes areas of necrosis and diffused oxygen). Figure 4 shows a slice from the tumour centre for an example patient, alongside corresponding QC plots created within the container. These show the averaged dynamic OE and DCE signals for the 4 tissue classifications, demonstrating expected oxygen and Gd enhancement characteristics. Log files were generated alongside the maps, providing an auditable record of the process.The comparison of MR-derived hypoxia maps with 18F-FDOPA PET and biopsy tissue is the subject of ongoing research.
Discussion
The XNAT-integrated processing framework allowed a geo-dispersed team of researchers in the NCITA MR Core Lab (https://ncita.org.uk/ncita-mr-core-lab/) to work alongside a clinical study team to deliver MR-derived hypoxia maps in the necessary timeframe, providing maps within 24 hours of acquisition. This allowed efficient analysis, including QC, and provides a platform for the evaluation of these methods in future clinical trials.Other potential uses for this framework are radiotherapy planning [12,13], where imaging data are acquired prior to radiotherapy and typically needs to be used for treatment planning within hours, and in monitoring the effects of hypoxia modifying drugs [14].
Future work will look to validate the repeatability and reproducibility of this MR-derived hypoxia mapping analysis framework and to extend its use to the full capability of the Madym quantitative MR analysis toolbox [8].
Conclusion
This study used a repository-integrated QC pipeline and quantitative MR analysis toolbox to calculate MR-derived hypoxia maps for use in biopsy planning in glioma. This framework allows a geo-dispersed team to access and process the study data, whilst providing a standardised and auditable quantification for a clinical imaging study. This makes the framework suitable for both clinical studies that require rapid and robust analysis for decision-making and multi-centre clinical studies that use imaging biomarkers.Acknowledgements
This work acknowledges support from the National Cancer Imaging Translational Accelerator (NCITA).References
[1] Hubbard Cristinacce, PL; Keaveney, S; Aboagye, EO; et al. Clinical translation of quantitative magnetic resonance imaging biomarkers – An overview and gap analysis of current practice, Physica Medica, 2022, 101:165–182.
[2] O'Connor, JPB; Aboagye, EO; Adams JA; et al; Imaging biomarker roadmap for cancer studies. Nature Reviews Clinical Oncology, 2017, 14:169–186.
[3] Roach, JR; Plaha, P; McGowan, DR; and Higgins, GS. The role of [18F]fluorodopa positron emission tomography in grading of gliomas. Journal of Neuro-oncology, 2022, 160(3):577–589.
[4] Marcus, DS; Olsen, TR; Ramaratnam, M; and Buckner, RL. The extensible neuroimaging archive toolkit. Neuroinformatics, 2007, 5(1):11–33.
[5] McAteer, M; O’Connor, JPB; Koh, D; et al. Introduction to the National Cancer Imaging Translational Accelerator (NCITA): a UK-wide infrastructure for multicentre clinical translation of cancer imaging biomarkers. British Journal of Cancer, 2021, 125(11):1462–1465.
[6] Keaveney, S. An automated tool for monitoring imaging protocol compliance through XNAT. Poster 17, abstract book p170. [07/11/2023]; Available from: https://bic-ismrm.cubric.cf.ac.uk/conference
[7] Doran, SJ; Al Sa’d, M; Petts, JA; et al. Integrating the OHIF viewer into XNAT: Achievements, challenges and prospects for quantitative imaging studies. Tomography, 2022, 8(1):497–512.
[8] Berks, M; Parker, GJM; Little, R; et al. Madym: A C++ toolkit for quantitative DCE-MRI analysis. Journal of Open Source Software, 2021, 6 (66):3523.
[9] Washington University School of Medicine. XNAT Container Service. [23/10/2023]; Available from: https://bitbucket.org/xnatdev/container-service/src/master/.
[10] Little, RA; Jamin, Y; Boult, JKR; et al. Mapping hypoxia in renal carcinoma with oxygen-enhanced MRI: Comparison with intrinsic susceptibility MRI and pathology. Radiology. 2018, 288(3)739–747.
[11] Manchester QBI hypoxia code. [07/11/2023]; Available from: https://gitlab.com/manchester_qbi/manchester_qbi_public/hypoximap.
[12] Avants, BB; Tustison, N; and Song, G. Advanced normalization tools (ANTS). Insight Journal, 2009, 2(365):1–35.
[13] O’Connor, JPB; Naish, JH; Parker, GJM; et al. Preliminary study of oxygen-enhanced longitudinal relaxation in MRI: A potential novel biomarker of oxygenation changes in solid tumors. International Journal of Radiation Oncology Biology Physics, 2009, 75(4):1209–1215.
[14] Schmidt, MA and Payne, GS. Radiotherapy planning using MRI. Physics in Medicine and Biology, 2015, 60:323–361.
[15] Dubec, MJ; Buckley, DL; Berks, M; et al. First-in-human technique translation of oxygen-enhanced MRI to an MR Linac system in patients with head and neck cancer. Radiotherapy and Oncology, 2023, 18:109592.
[16] Hammond, EM; Asselin, M-C; Forster, D.; et al. The meaning, measurement and modification of hypoxia in the laboratory and the clinic, Clinical Oncology, 2014, 26(5):277–288.
Figures