0235
VesselVoyager: An Interactive 3D Intracranial Vessel Tracing Software1Department of Bioengineering, University of Washington, Seattle, WA, United States, 2International School, Bellevue, Bellevue, WA, United States, 3Electrical and Computer Engineering, University of Washington, Seattle, WA, United States, 4Department of Radiology, University of Washington, Seattle, WA, United States, 5Department of Surgery, University of Washington, Seattle, WA, United States, 6Department of Radiology and Imaging Sciences, University of Utah, Salt Lake City, UT, United States
Synopsis
Keywords: Software Tools, Software Tools, Vessel
Motivation: Aiming to unravel the complexities of intracranial arterial structures, we recognized the need for advanced 3D annotation capabilities to improve upon conventional 2D methodologies.
Goal(s): Our goal was to develop VesselVoyager, a tool that facilitates detailed 3D mapping and analysis of cerebral vasculature, filling a critical gap in neurovascular diagnostic technology.
Approach: We utilized real-time 3D rendering and a 3D virtual camera system in VesselVoyager, enabling precise, interactive annotation and analysis within a user-friendly, gamified environment.
Results: VesselVoyager not only improved accuracy but also created new approaches for analyzing understudied diseases, enhancing our understanding of complex neurovascular conditions.
Impact: VesselVoyager enhances centerline tracing precision and triples processing efficiency, thus lightening the workload for clinicians and researchers. This advancement broadens its applicability to intricate vascular pathologies, including moyamoya disease.
Introduction
Analysis of intracranial vessels is pivotal for a wide array of clinical diagnostics and research endeavors1. Measurement of artery length on non-contrast MRA such as time-of-flight image can provide useful information about intracranial blood flow2. Previous software tools, such as iCafe3 and 3D Slicer4, are employed to extract vessel centerlines; however, they do not fully exploit the benefits of direct 3D annotation and frequently involve a steep learning curve, in addition to being labor-intensive. The delineation of intracranial vessel centerlines is fundamental for elucidating the relationship between vascular architecture and cerebral functionality. It also constitutes the initial and critical step in vessel wall analysis, given the diminutive and convoluted nature of intracranial vessels. Consequently, there is an escalating need for intuitive and efficient software that allows for interactive tracing and labeling of vessel centerlines within a three-dimensional space. VesselVoyager has been developed to meet this need, offering a user-friendly, engaging platform that enables users to navigate and annotate intracranial vessels directly in a 3D context, thereby enhancing efficiency.Designs and Features
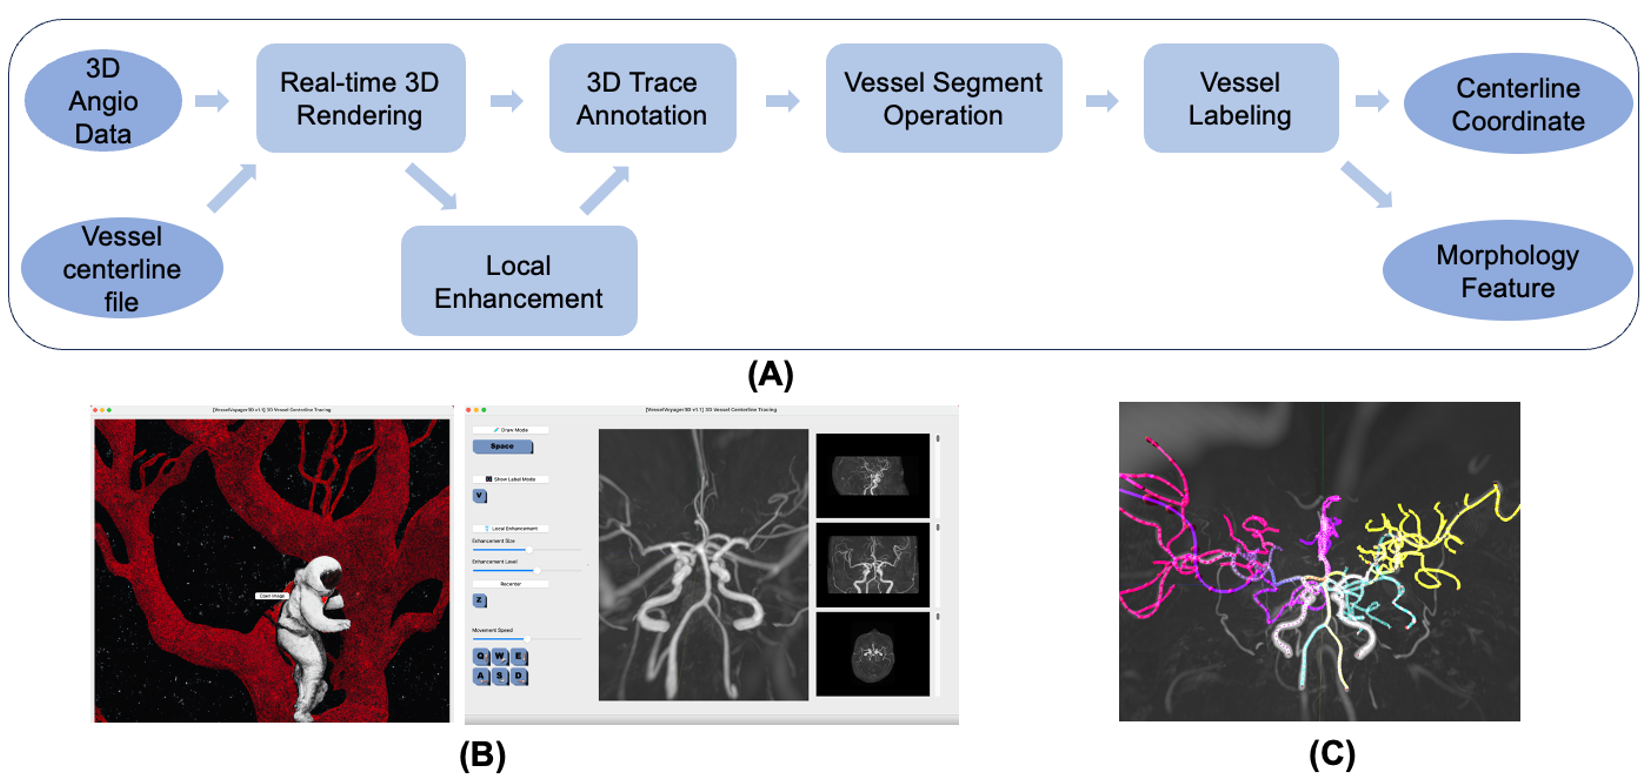
VesselVoyager is built on PyQtGraph5, pure-Python graphics and GUI based on PySide and NumPy. The illustration of software workflow is shown in Figure 1(A).Design:
- DataIO: The VesselVoyager platform is designed to import 3D MR angiography datasets in DICOM and NIfTI formats seamlessly. It also supports loading pre-existing vessel trace data from '.yaml' or '.swc' files, which includes vital information like centerline coordinates and vessel categorization. While our previously developed AI model6 generates part of these initial trace results, inaccuracies can occur. VesselVoyager allows users to easily rectify these with its intuitive interface, improving the accuracy of the data. Post-correction, the refined centerlines can be exported to '.swc' or '.yaml' files, which are conducive to further AI training. In addition, VesselVoyager compiles a CSV file detailing the morphological features of traced vessels, facilitating comprehensive data analysis and application in advanced research scenarios, including complex vascular pathologies like Moyamoya disease.
- 3D Display & Navigation: We employ a real-time maximum intensity projection rendering technique that operates with exceptional speed on expansive medical imaging datasets, leveraging the inherently high-contrast signal of vessels in MR angiography. The intracranial vascular tree's sparse configuration permits users to navigate seamlessly within a gamified interface, enabling an exploratory journey through the intricate vessel anatomy, as depicted in Figure 2(A).
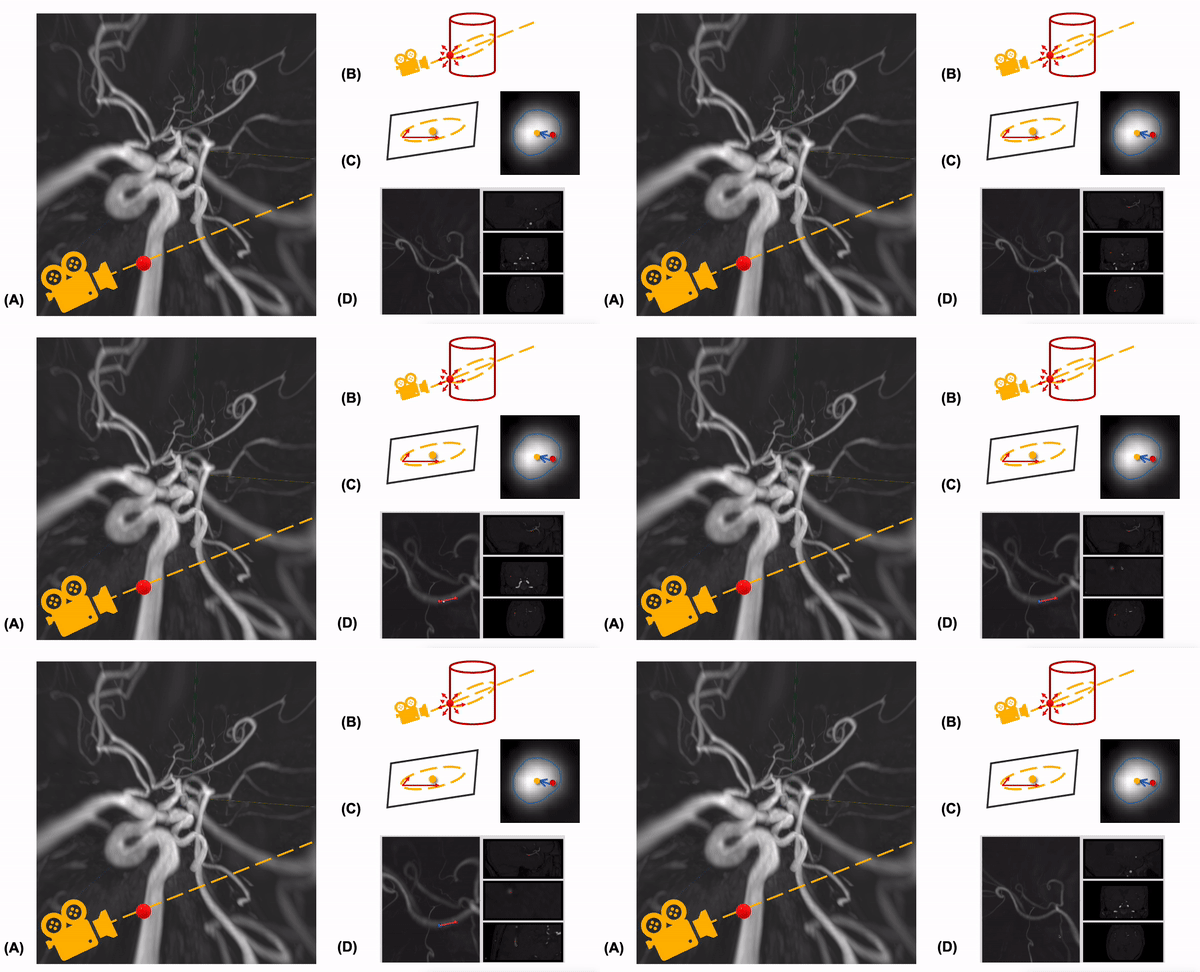
- 3D Annotation: To facilitate the direct tracing of 3D centerline points on a 2D display, we implemented an automated centerline point detection algorithm that integrates a 3D camera system with vessel signal processing, as illustrated in Figure 3. Users can verify their 3D annotations on 2D slices across sagittal, coronal, and axial planes on the side panel, as demonstrated in Figure 2(B).
- Local enhancement: When activated, the 'local enhancement' feature intensifies the visibility of faint and distal vessels, with adjustable levels and scope of enhancement. Such vessels are prone to misclassification by automated detection algorithms and are often overlooked by human reviewers using conventional vessel tracing tools. This enhancement function is designed to mitigate these issues by improving the discernibility of these challenging vessel segments.
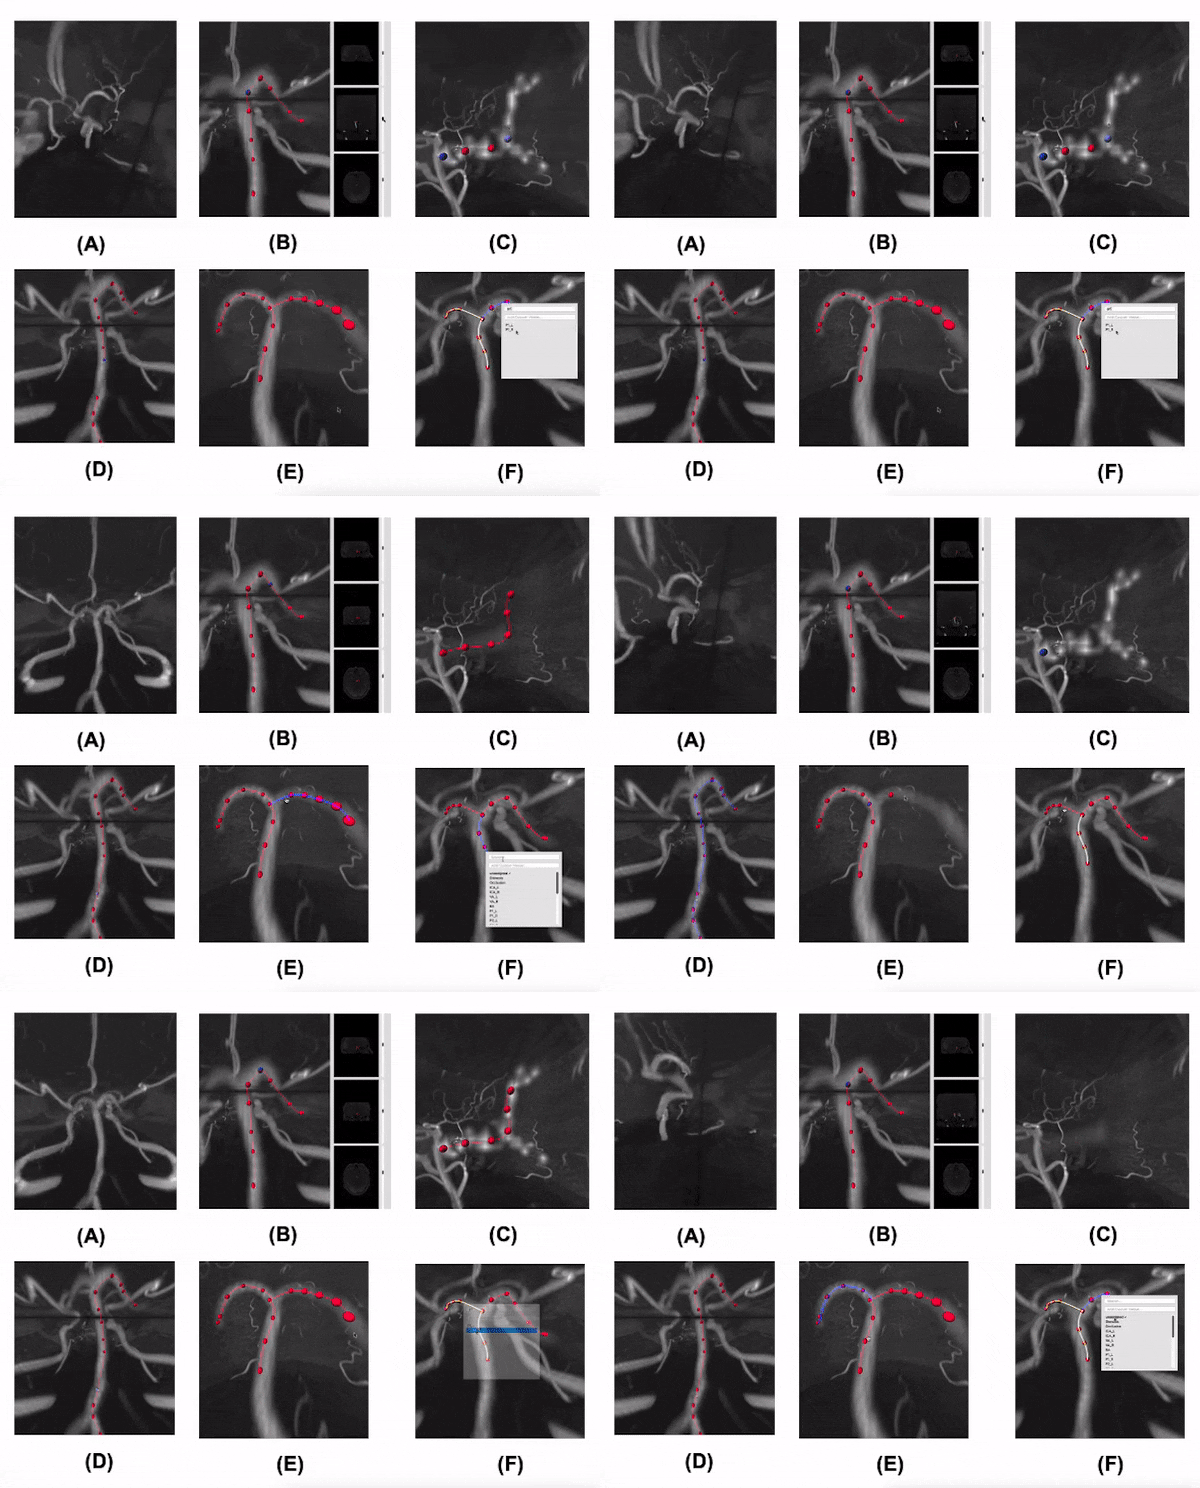
- Vessel trace operation: Vessel tracing operations include connection (Fig. 2(D)), bifurcation (Fig. 2(E)), and categorization with various vessel types (Fig. 2(F)). Additionally, users have the flexibility to assign specialized labels to identify anomalous vessel types according to their specific requirements.
- Morphological quantification: VesselVoyager quantifies key morphological features like length, branching, and tortuosity. Upon saving, it converts the centerline into a graph to calculate degree distribution, clustering coefficient, and path length.
Novel Clinical Applications
Beyond standard clinical and research tasks like detecting and labeling stenosis or occlusions and quantifying intracranial arteries, VesselVoyager could be used in analyzing complex vascular structures associated with conditions like Moyamoya disease and in assessing collaterals in stroke. Its 3D annotation and local enhancement capabilities enable straightforward tracing and classification of atypical arteries, which are often challenging with other software.Performance
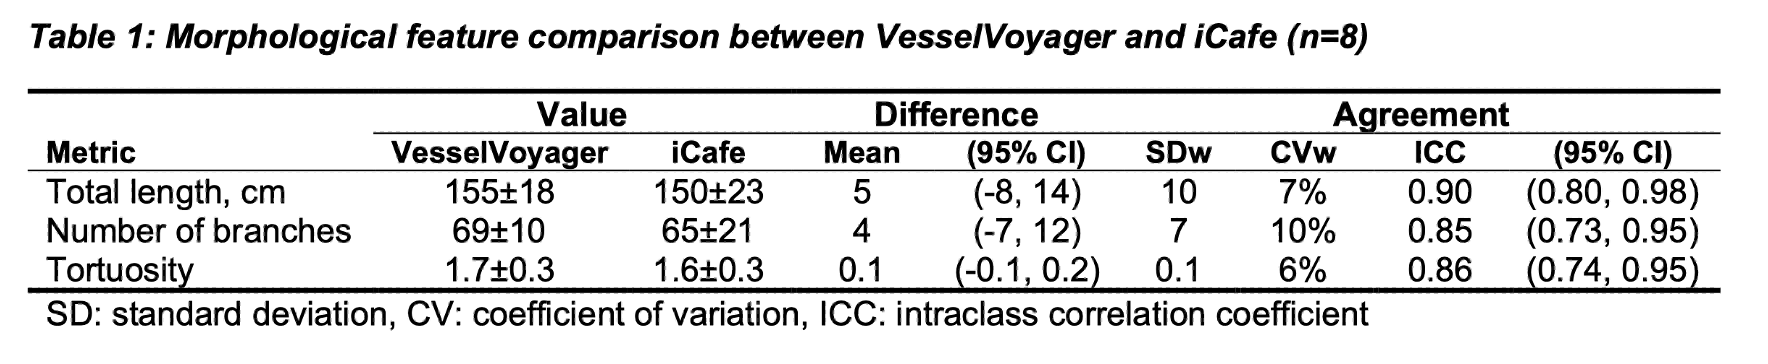
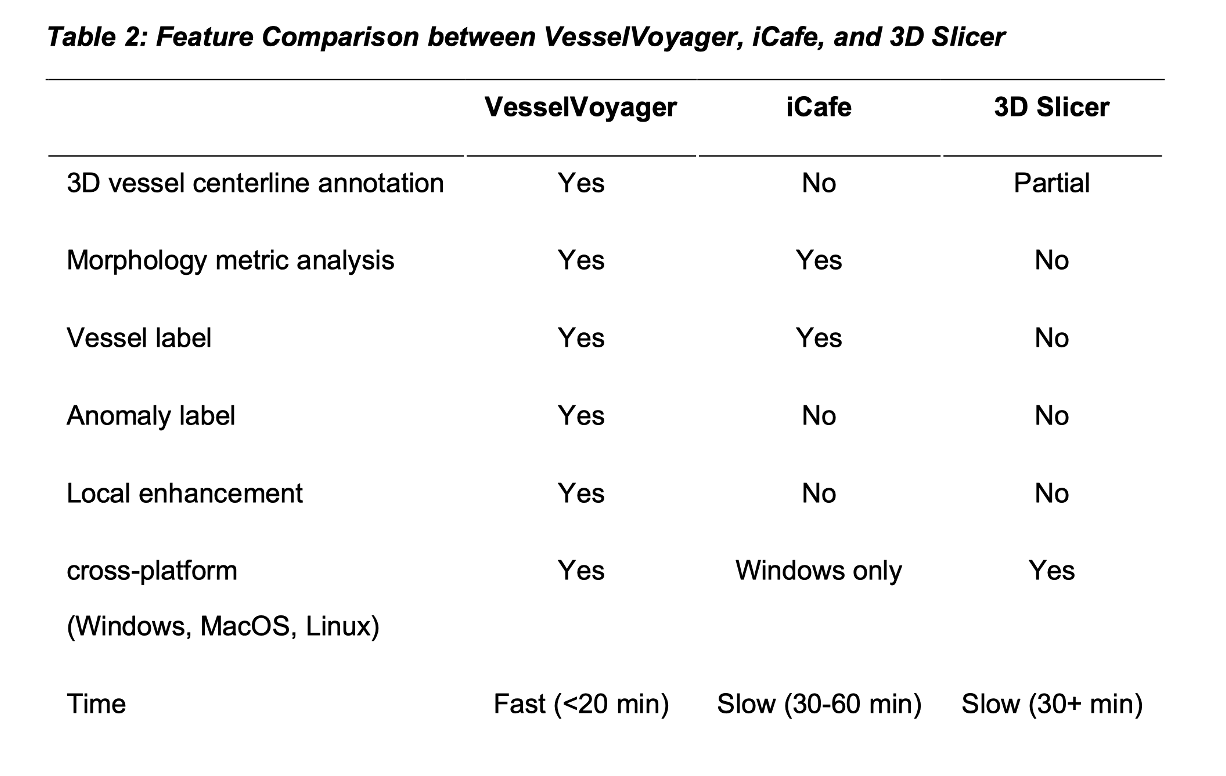
Comparative morphological analysis of VesselVoyager with iCafe demonstrated superior centerline label accuracy and reproducibility in VesselVoyager, as shown in Table 1. Table 2 exhibits the features enabled in different software, highlighting the superiority of VesselVoyager.Conclusion
VesselVoyager introduces a novel paradigm in vascular imaging with its real-time 3D tracing and local enhancement capabilities, specifically addressing the challenges of analyzing complex and faint vascular structures. Its intuitive gamified interface and robust algorithmic framework set a new standard for precision and efficiency in intracranial vessel analysis.Acknowledgements
No acknowledgement found.References
- Chen L, Sun J, Hippe DS, Balu N, Yuan Q, Yuan I, Zhao X, Li R, He L, Hatsukami TS, Hwang JN. Quantitative assessment of the intracranial vasculature in an older adult population using iCafe. Neurobiology of aging. 2019 Jul 1;79:59-65.
- Zhang K, Chen Z, Chen L, Canton G, Geleri DB, Chu B, Guo Y, Hippe DS, Pimentel KD, Balu N, Hatsukami TS. Alterations in cerebral distal vascular features and effect on cognition in a high cardiovascular risk population: A prospective longitudinal study. Magnetic Resonance Imaging. 2023 May 1;98:36-43.
- Chen L, Mossa‐Basha M, Balu N, Canton G, Sun J, Pimentel K, Hatsukami TS, Hwang JN, Yuan C. Development of a quantitative intracranial vascular features extraction tool on 3 D MRA using semiautomated open‐curve active contour vessel tracing. Magnetic resonance in medicine. 2018 Jun;79(6):3229-38.
- Fedorov A, Beichel R, Kalpathy-Cramer J, Finet J, Fillion-Robin JC, Pujol S, Bauer C, Jennings D, Fennessy F, Sonka M, Buatti J. 3D Slicer as an image computing platform for the Quantitative Imaging Network. Magnetic resonance imaging. 2012 Nov 1;30(9):1323-41.
- Campagnola L. PyQtGraph-scientific graphics and GUI library for python. Physica B. 2016 Dec 16.
- Chen L, Liu W, Balu N, Mossa-Basha M, Hatsukami TS, Hwang JN, Yuan C. Deep Open Snake Tracker for Vessel Tracing. InMedical Image Computing and Computer Assisted Intervention–MICCAI 2021: 24th International Conference, Strasbourg, France, September 27–October 1, 2021, Proceedings, Part VI 24 2021 (pp. 579-589). Springer International Publishing.
Figures