0233
Reproducible Intramuscular Fat Quantification using Vendor-Independent Processing in a Multi-Site, Multi-Vendor Setting1Biomedical Engineering, Cleveland Clinic, Cleveland, OH, United States, 2Diagnostic Radiology, Cleveland Clinic, Cleveland, OH, United States, 3Radiology and Radiological Sciences, Vanderbilt University Medical Center, Nashville, TN, United States, 4Orthopaedic Surgery, Vanderbilt University Medical Center, Nashville, TN, United States, 5Philips, Nashville, TN, United States, 6Quantitative Health Sciences, Cleveland Clinic, Cleveland, OH, United States, 7Carle, Urbana, IL, United States, 8Ohio State University, Columbus, OH, United States, 9Orthopaedic Surgery, Cleveland Clinic, Cleveland, OH, United States
Synopsis
Keywords: Muscle, Muscle, Reproducibility, fat, Dixon, post-processing, image processing, multi-site, multi-vendor, osteoarthritis, orthopaedics, ACL reconstruction
Motivation: Intramuscular fat is associated with muscle degeneration. Chemical shift-encoded MRI quantifies proton density fat fraction (PDFF), but multi-site, multi-vendor reproducibility for intramuscular assessment is scarcely reported.
Goal(s): To evaluate the reproducibility of a vendor-independent thigh muscle PDFF quantification approach using multi-site, multi-vendor data and then assess PDFF in patients 10 years post-anterior cruciate ligament reconstruction (ACLR).
Approach: Phantoms, traveling controls, and ACLR patients were scanned using five scanners (three sites, two vendors). A correction was developed to address image scaling variations.
Results: Average absolute PDFF standard deviation was below 1% after correction. The ACLR patient cohort had elevated PDFF in operated leg hamstrings.
Impact: Harmonized acquisition and vendor-independent processing with the proposed image scaling correction can provide reproducible thigh intramuscular proton density fat fraction across sites and vendors. This approach may characterize within-patient muscle changes, such as bilateral differences or potentially longitudinal assessment.
Introduction
Chemical-shift encoded MRI, such as 6-point Dixon, provides quantitative estimates of proton density fat fraction (PDFF) for assessment of skeletal muscle quality.1 Fatty infiltration is associated with muscle degeneration.2 In patients that received anterior cruciate ligament reconstruction (ACLR), fatty infiltration has been observed in thigh muscles and may indicate post-traumatic osteoarthritis onset, of which this post-surgical population is at heightened risk.3Reproducible intramuscular PDFF quantification may enable characterization of muscle degeneration that occurs following ACLR and may serve as an objective measure to evaluate treatment outcomes. While the reproducibility of PDFF from 6-point Dixon MRI has been documented in the context of liver imaging,4 reproducibility in skeletal muscle has not been well investigated.
In this work, we evaluate the reproducibility of PDFF obtained from multiple sites and vendor platforms using harmonized protocols and centralized, vendor-independent processing pipeline. PDFF quantification is applied in ACLR patients at 10-year follow-up to compare bilateral differences in thigh intramuscular PDFF.
Methods
Data were acquired from five 3 T scanners (Philips, Siemens) at three sites. Harmonized protocols were used to acquire bilateral mid-thigh images, including axial T1-weighted turbo spin echo and 6-point Dixon data. To achieve first TE=1.23 ms and ΔTE=1.23 ms with monopolar gradient scanning, two 3-point Dixon scans were interleaved with different first TE: 1.23 ms (odd echoes) and 2.46 ms (even). Phantoms, traveling controls, and ACLR patients from the Multicenter Orthopaedic Outcomes Network (MOON) were included. Vendor-independent processing included semi-automated segmentation, registration, and PDFF quantification using FattyRiot software with magnitude-image processing.5Global scaling differences between odd and even echoes were observed in some scanners, motivating development of a scaling correction. Using voxels without fat, e.g. agar tubes (Figure 1), “water-only” (WO) correction was employed that uses a two-parameter model with T2* decay and even echo scaling, $$$k$$$. However, most in vivo datasets lacked known water-only signal. A “fat and water” (FW) correction was developed to estimate $$$k$$$, part of parameter vector, $$$\theta$$$, by using measurements from multiple voxels within lean muscle and assuming those voxels share a fat signal shape but with different fat proportions. The objective function for estimating $$$\theta$$$ has form $$\Psi(\theta)=||S_{meas}-S_{model}(\theta)||_2^2+\lambda R(S_{corr}(\theta))$$ where $$$S_{meas}$$$, $$$S_{model}(\theta)$$$, and $$$S_{corr}(\theta)$$$ are voxels' normalized measured signal, modeled signal, and corrected signal, respectively, $$$R()$$$ is a regularization in L2 that penalizes $$$\theta$$$ combinations that cause $$$S_{corr}$$$ to deviate from pure exponential decay, and $$$\lambda$$$ is the regularization weight. FW was evaluated in phantoms, traveling controls, and patients that had an agar tube placed within the field of view for validation. FW was then applied to patient data for analysis.
Phantom scans for reproducibility and FW validation included 6 scans on each scanner (N=30). Standard deviation (SD) of PDFF and intraclass correlation coefficient (ICC) were assessed across scanners.
Traveling control scans included five subjects and N=24 scans. Within-subject SD (wSD) and ICC of PDFF were assessed across scanners.
Bilateral differences in muscle compartment PDFF were assessed in N=135 ACLR patients, with 1 scan per patient.
Results
FW correction mitigated the interleaved 3-echo scaling differences prior to PDFF quantification (Figure 1) and provided comparable scaling parameter estimates as WO in the agar tube ($$$k$$$=0.96±0.05 vs $$$k$$$=0.96±0.05, mean absolute error 0.006), with less error than WO applied in the 5% FF tube ($$$k$$$=1.00±0.05, mean absolute error 0.034).FW correction improved overall SD, wSD, and ICC values, with ICC in traveling controls increasing from 0.851 to 0.962 after correction (Figure 2). FW was observed to mitigate artificially heightened PDFF in agar tubes in patient scans on affected scanners (Figure 3). Example ACLR patient scans from each site are shown in Figure 4. In the ACLR patient cohort, statistically significant PDFF elevation was observed in the hamstrings muscle compartment of the operated leg as compared to the contralateral leg (Figure 5).
Discussion
Overall multi-site, multi-vendor reproducibility was under 1% average absolute PDFF for phantom SD and traveling control wSD when using vendor-independent processing of harmonized 6-point Dixon MRI acquisitions. The proposed FW scaling correction improved reproducibility when compared to uncorrected data. In the ACLR patient cohort, intramuscular PDFF was elevated in the hamstrings of the operated leg. However, fatty infiltration was not observed in all patients and may be driven by use of hamstrings autograft.6 Intramuscular PDFF may also be influenced by age, sex, activity, and body mass index, which emphasizes the need for reproducible PDFF quantification so that contributing factors can be better investigated. Reproducible intramuscular PDFF quantification is important for capturing such muscle changes in longitudinal studies, such as the MOON ACLR cohort, or when characterizing degenerative processes such as sarcopenia.Acknowledgements
This work was funded in part by the following sources: NIH/NIAMS R01AR075422, NIH/NIAMS T32AR007505, NIH/NIA K25AG070321. The content is solely the responsibility of the authors and does not necessarily represent the official views of the NIH.References
1. Kumar D, Karampinos DC, MacLeod TD, et al. Quadriceps intramuscular fat fraction rather than muscle size is associated with knee osteoarthritis. Osteoarthritis Cartilage. 2014;22(2):226-234. doi:10.1016/j.joca.2013.12.005
2. Lipina C, Hundal HS. Lipid modulation of skeletal muscle mass and function. J Cachexia Sarcopenia Muscle. 2017;8(2):190-201. doi:10.1002/jcsm.12144
3. Jungmann PM, Baum T, Nevitt MC, et al. Degeneration in ACL Injured Knees with and without Reconstruction in Relation to Muscle Size and Fat Content—Data from the Osteoarthritis Initiative. PLOS ONE. 2016;11(12):e0166865. doi:10.1371/journal.pone.0166865
4. Schneider E, Remer EM, Obuchowski NA, McKenzie CA, Ding X, Navaneethan SD. Long-term inter-platform reproducibility, bias, and linearity of commercial PDFF MRI methods for fat quantification: a multi-center, multi-vendor phantom study. Eur Radiol. 2021;31(10):7566-7574. doi:10.1007/s00330-021-07851-8
5. Gaj S, Eck BL, Xie D, et al. Deep learning-based automatic pipeline for quantitative assessment of thigh muscle morphology and fatty infiltration. Magn Reson Med. 2023;89(6):2441-2455. doi:10.1002/mrm.29599
6. Lartey R, Obuchowski N, Neill M, et al. Quantitative MRI of the Hamstring Muscles Ten Years After Autograft Hamstring ACLR. Orthop J Sports Med. 2023;11(7_suppl3):2325967123S00057. doi:10.1177/2325967123S00057
Figures
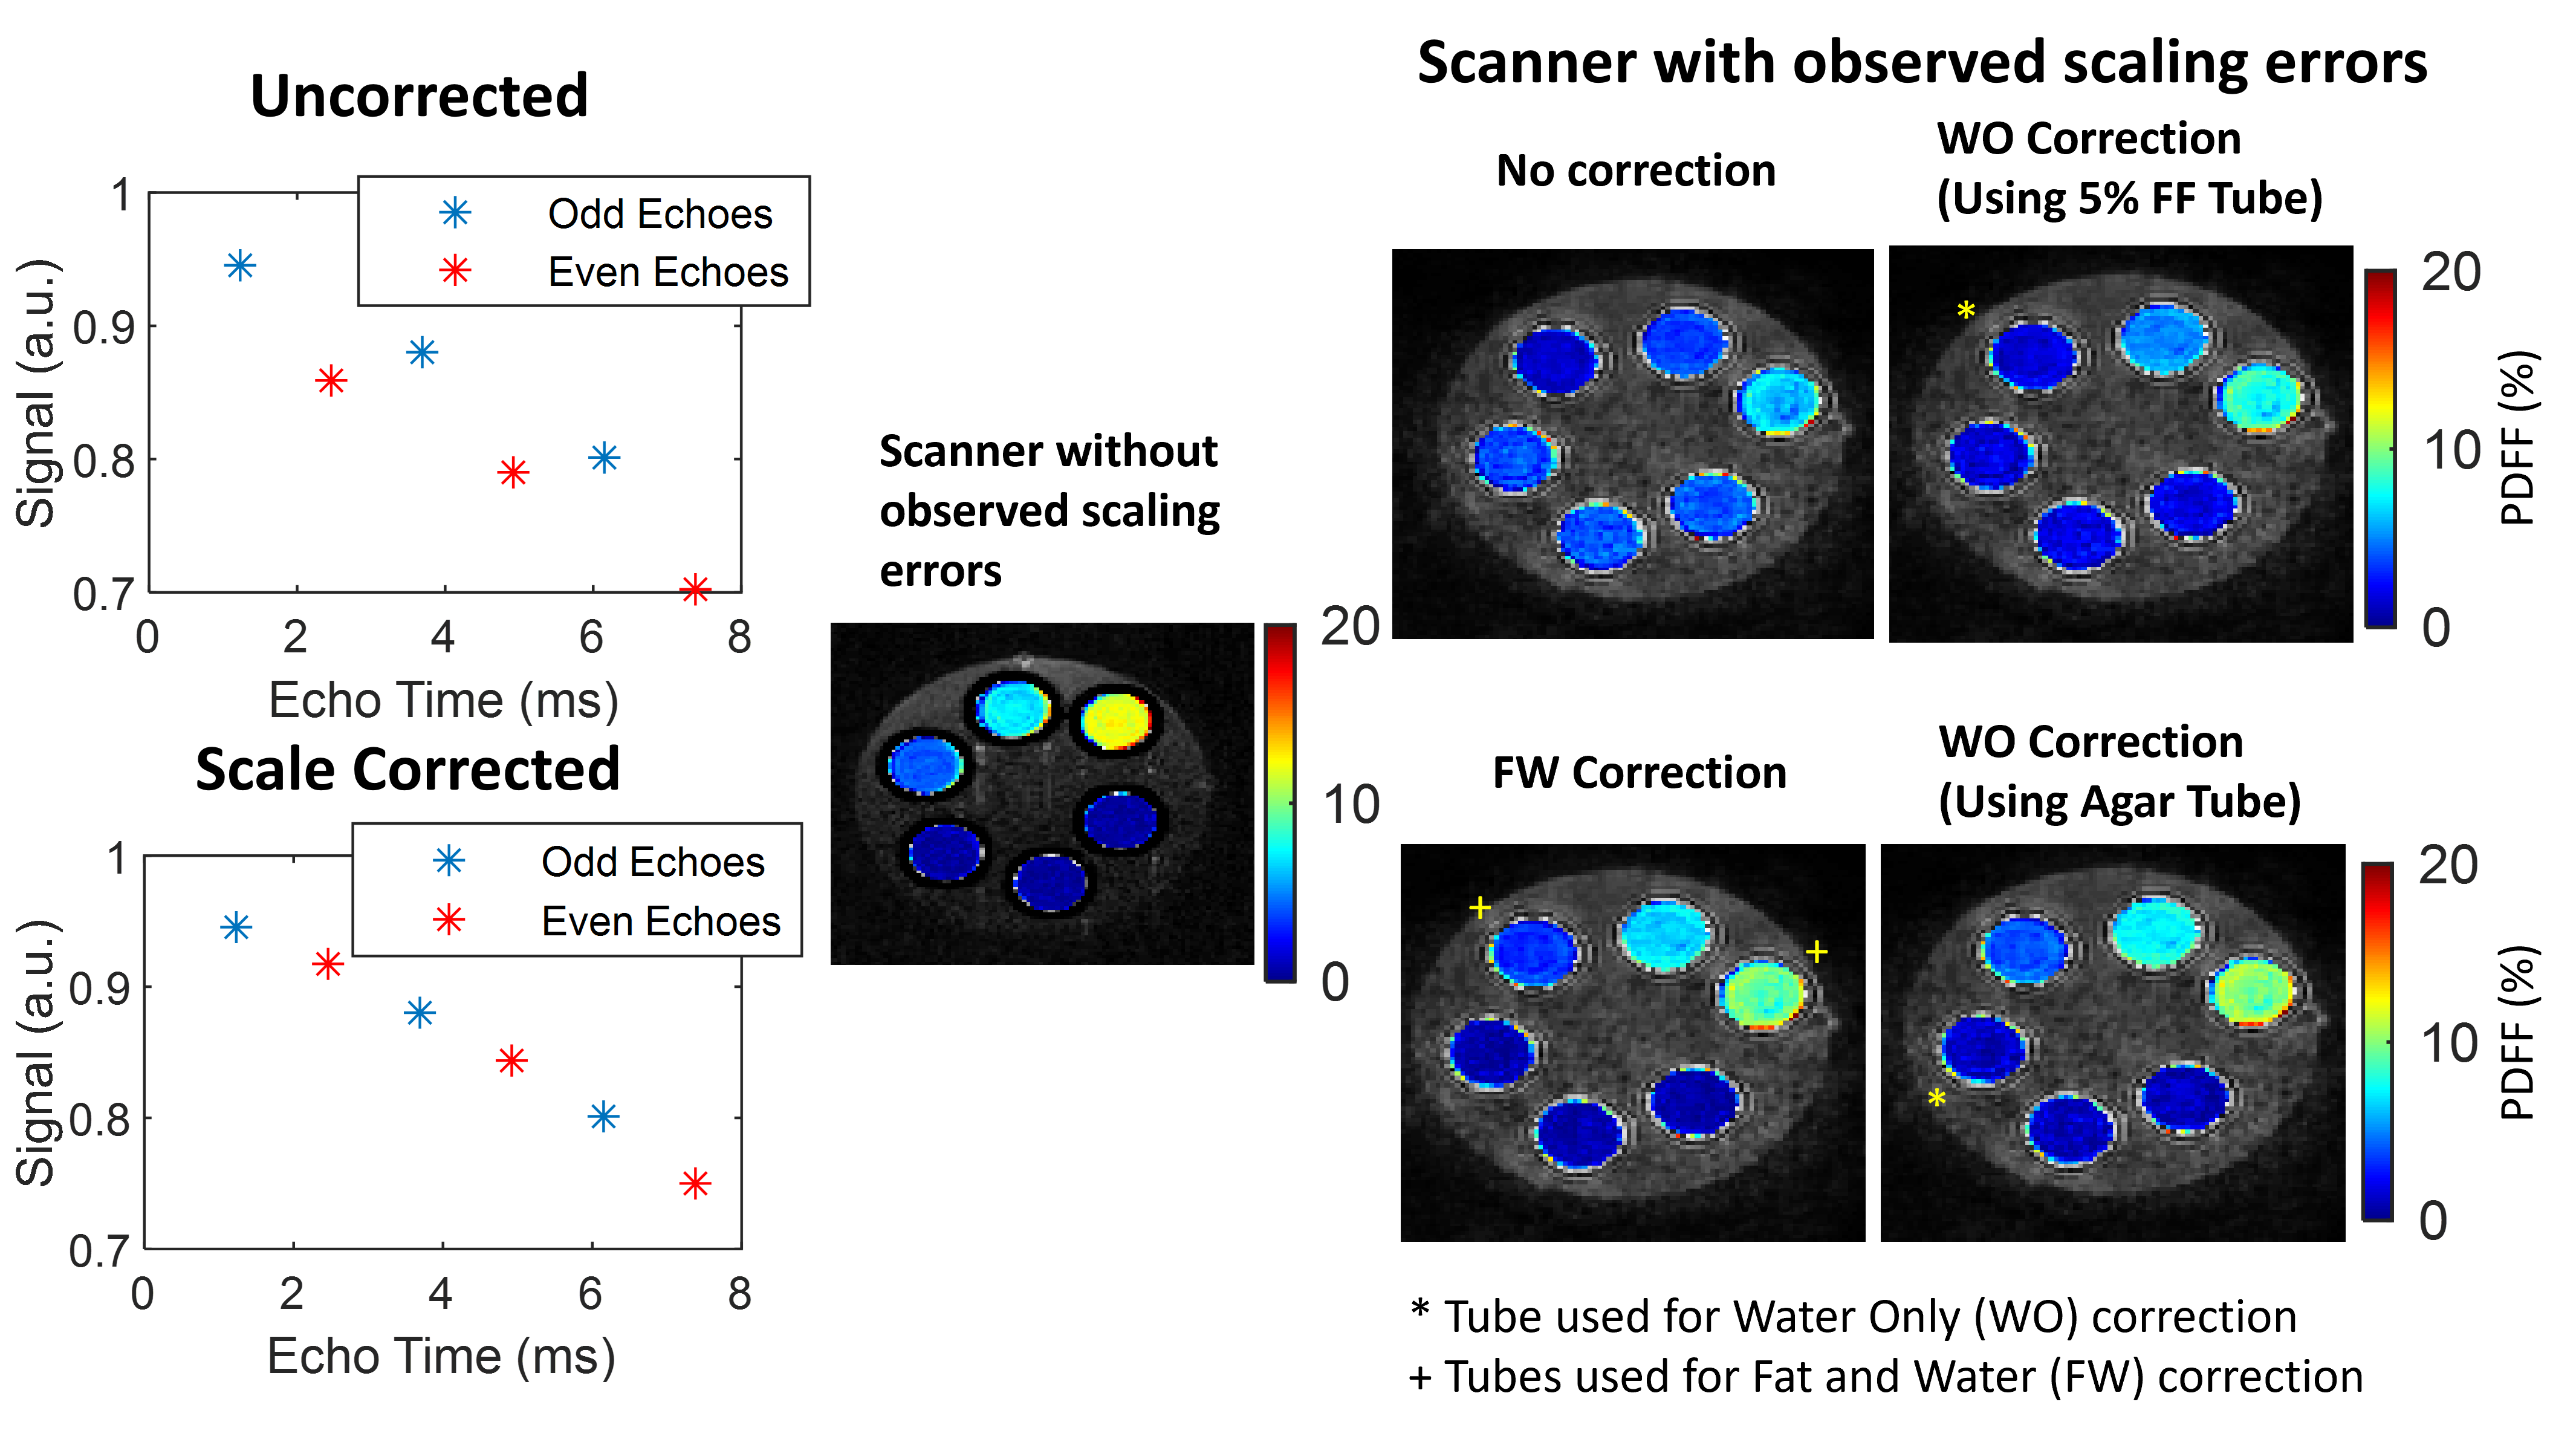
Figure 1. Scaling correction for interleaved monopolar 3-echo acquisitions as part of the 6-point Dixon data processing for affected scanners. (Scatterplots) In an agar tube with no fat, signal should follow a mono-exponential decay for interleaved 3-echo acquisitions. However, even echoes (red) are observed to have different scaling than odd echoes (blue). (PDFF maps) WO correction succeeds with agar tubes, but not the 5% peanut oil tube. FW succeeds with 5% and 15% peanut oil tubes. (Top row tubes: 5%, 10%, 15% peanut oil; Bottom row tubes: 4%, 3%, 2% agar with no fat)
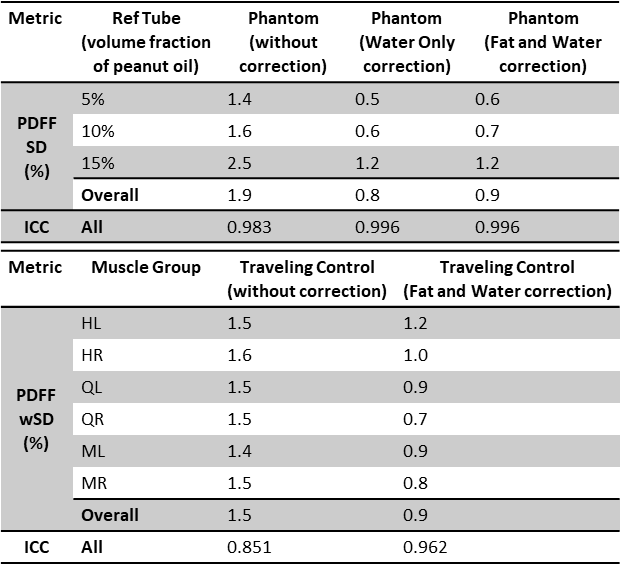
Figure 2. Tables of phantom (top) and traveling control (bottom) reproducibility across sites and scanners. Reproducibility was assessed by standard deviation (SD) across all phantom scans and within-subject SD (wSD) for muscle groups across scanners. WO correction had lowest PDFF SD and highest ICC with FW yielding very similar results. Similar trends were observed in traveling control subjects; FW improved PDFF wSD and ICC. HL/HR=Hamstrings Left/Right, QL/QR=Quadriceps Left/Right, ML/MR=Medial Left/Right.
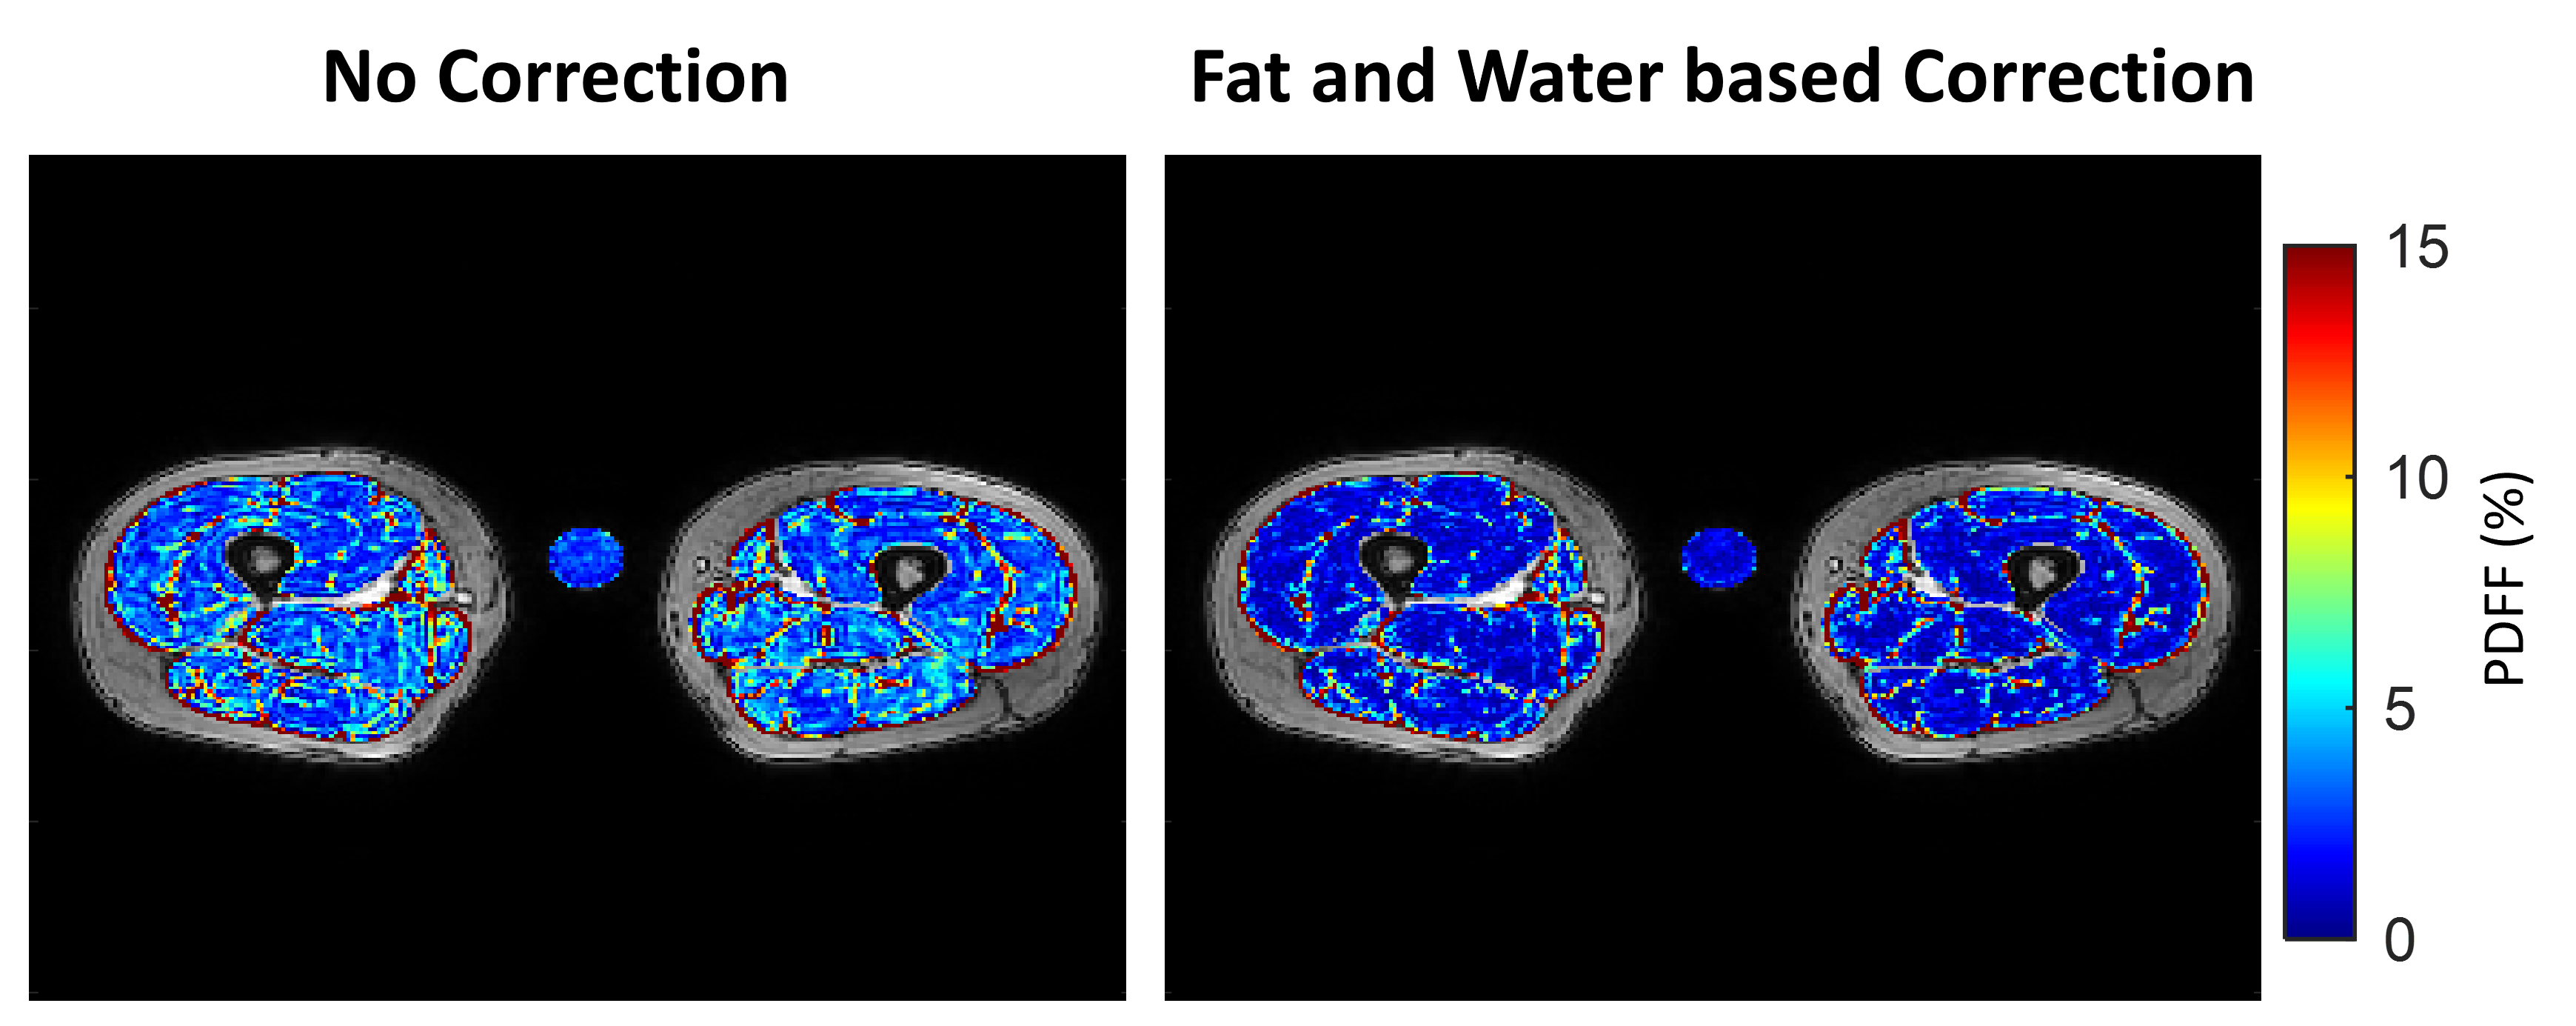
Figure 3. Example ACL Reconstruction (ACLR) patient scan with included agar tube for confirmation of FW correction quality. In this case, scaling correction led to artificially heightened PDFF in muscle tissue as well as the agar tube. FW correction decreased the PDFF of the agar tube to be closer to zero and similarly reduced intramuscular PDFF values. As shown in traveling control subjects, this correction improves reproducibility of PDFF quantification in all muscle compartments.
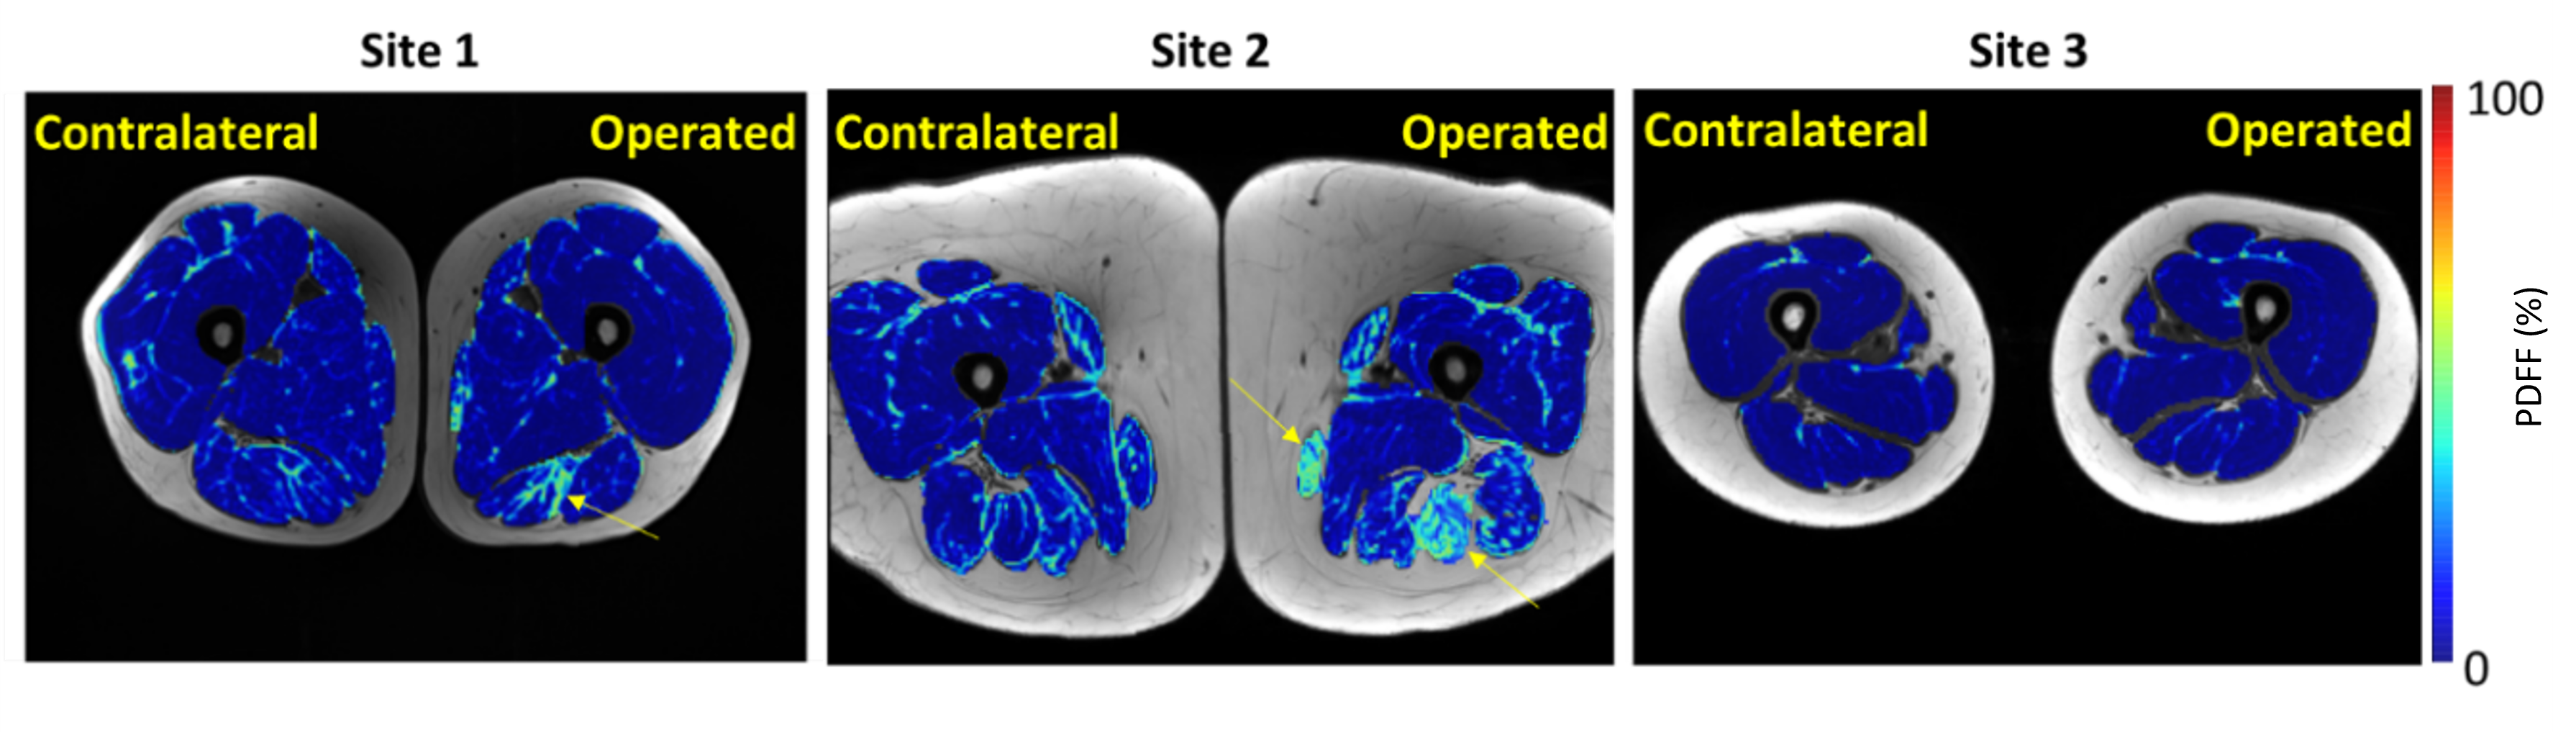
Figure 4. Example ACLR patients from each site. Some ACLR patients, but not all, exhibit visually evident fatty infiltration in some muscles of the operated thighs (yellow arrows).
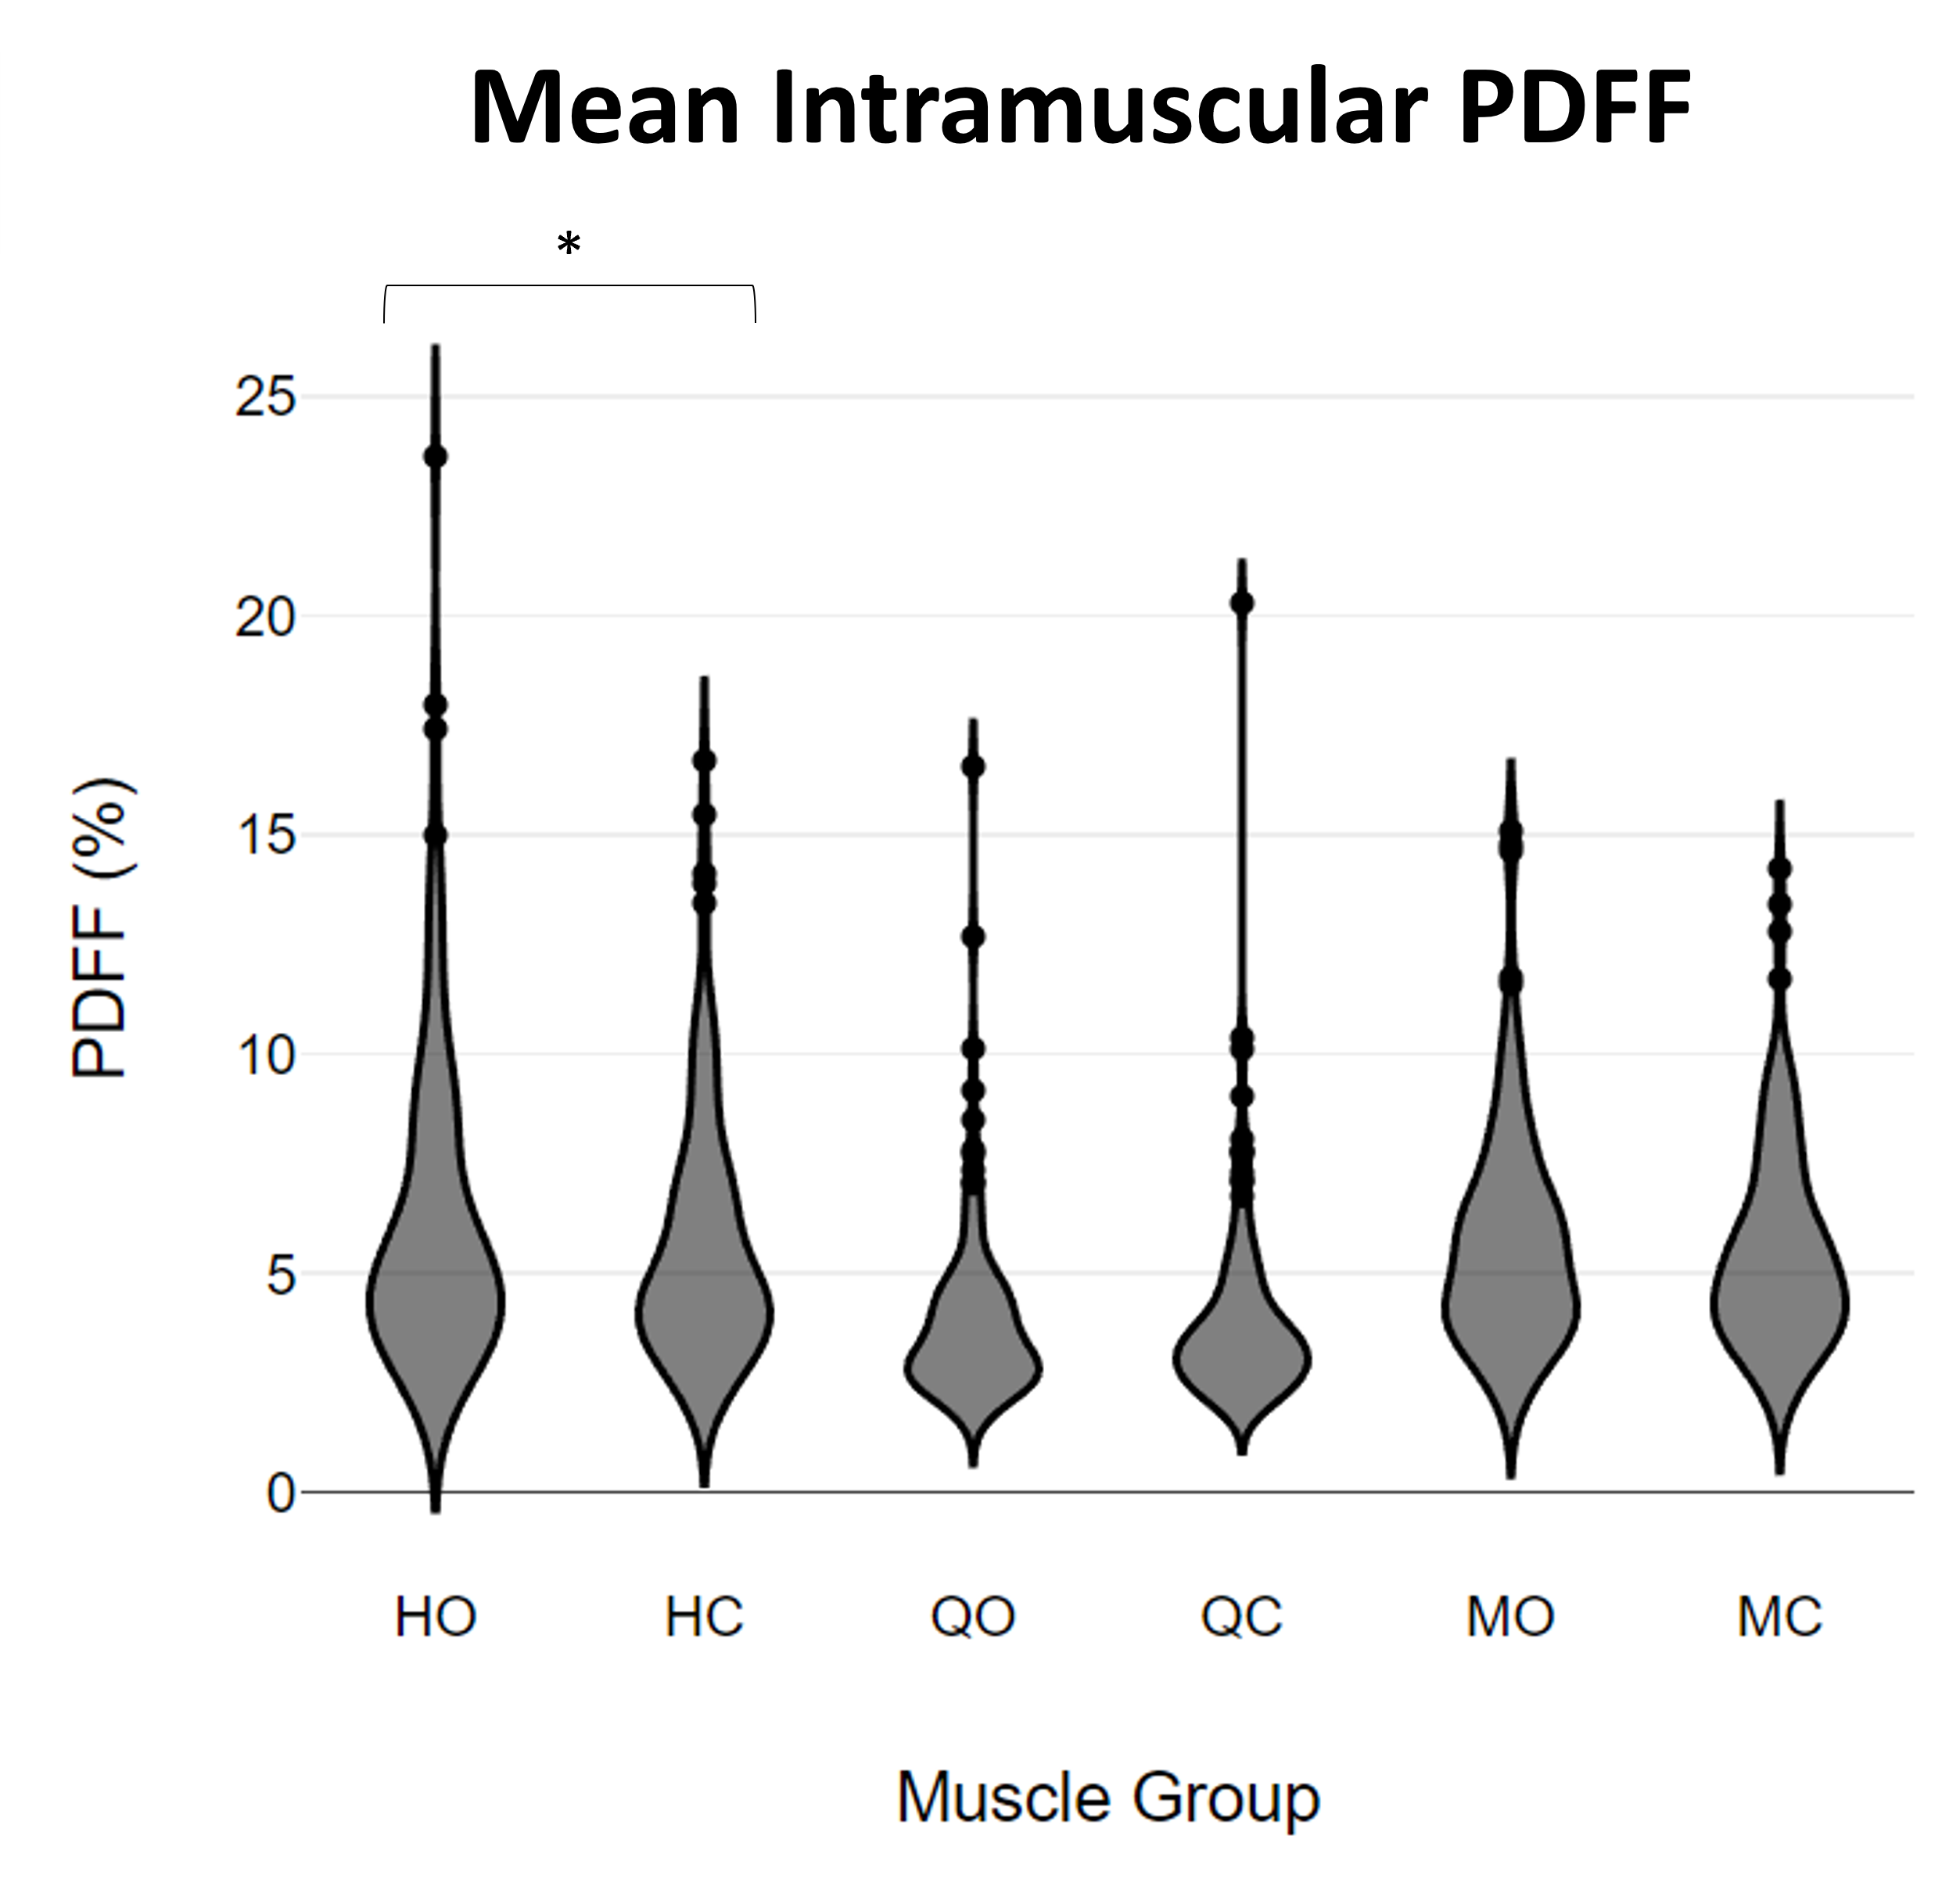
Figure 5. Violin plots of mean intramuscular PDFF in ACLR patients’ operated and contralateral muscle compartments (N=135). HO/HC: Hamstrings Operated/Contralateral, QO/QC: Quadriceps Operated/Contralateral, MO/MC: Medial Operated/Contralateral. *p<0.05.