0229
Mapping the amplitude and phase of dissolved 129Xe red blood cell signal oscillations with keyhole spectroscopic lung imaging1POLARIS, Division of Clinical Medicine, School of Medicine and Population Health, University of Sheffield, Sheffield, United Kingdom, 2Insigneo Institute for in silico Medicine, University of Sheffield, Sheffield, United Kingdom
Synopsis
Keywords: Hyperpolarized MR (Gas), Image Reconstruction
Motivation: Cardiogenic oscillations in dissolved 129Xe red blood cell (RBC) signal are sensitive to cardiopulmonary disease. Current methods to map the amplitude of these oscillations do not consider oscillation phase, leading to physiologically unrealistic amplitude values.
Goal(s): To map the amplitude and phase of 129Xe RBC oscillations in the lung vasculature.
Approach: Multiple phases of the cardiac cycle were reconstructed from multi-echo dissolved 129Xe spectroscopic imaging data using a sliding window keyhole method, to map both oscillation amplitude and phase in healthy volunteers and post-COVID-19 patients.
Results: Both oscillation amplitude and phase were mapped regionally. Phase-adjustment improved oscillation amplitude inter-scan repeatability in healthy volunteers.
Impact: Sliding-window keyhole 129Xe RBC oscillation amplitude and phase mapping corrects for physiologically unrealistic negative amplitudes. This approach allows regional mapping of RBC oscillation phase, which may represent the cardiac pulse wave in the pulmonary microvasculature, and its alteration in disease.
Introduction
The signal from hyperpolarized 129Xe dissolved in the red blood cells (RBCs) is modulated by changes in the capillary blood volume over the cardiac cycle1-4. These “oscillations” are sensitive to cardiopulmonary disease4-8 and can be mapped regionally using a post-acquisition keyhole reconstruction9,10. In this work, we employ a sliding window (SW) approach to reconstruct additional keyhole images and estimate and correct for regional oscillation phase ($$$\phi$$$).Methods
RBC oscillation mapping was performed retrospectively in a cohort of twenty-four healthy volunteers and ten patients who were hospitalized due to COVID-19 pneumonia; five with post-COVID-19 interstitial lung disease (PC-ILD) and five without (PC). 129Xe gas transfer was measured with a four-echo 3D radial spectroscopic imaging sequence6 on a 1.5T GE HDx clinical scanner using a 129Xe transmit-receive vest coil. A dose of 0.8–1L hyperpolarized 129Xe was inhaled from functional residual capacity11. Five healthy subjects underwent three additional scans to assess inter- and intra-session repeatability.After normalizing and correcting for radiofrequency pulse-induced and T1 decay, the k0 129Xe RBC signal was filtered and the maxima and minima identified with a peak detection algorithm. Whole-lung RBC oscillation amplitude (αk0) was found from the mean peak-to-peak k0 amplitude over the first ~7s. To reconstruct RBC signal oscillation maps, two keyhole methods were used:
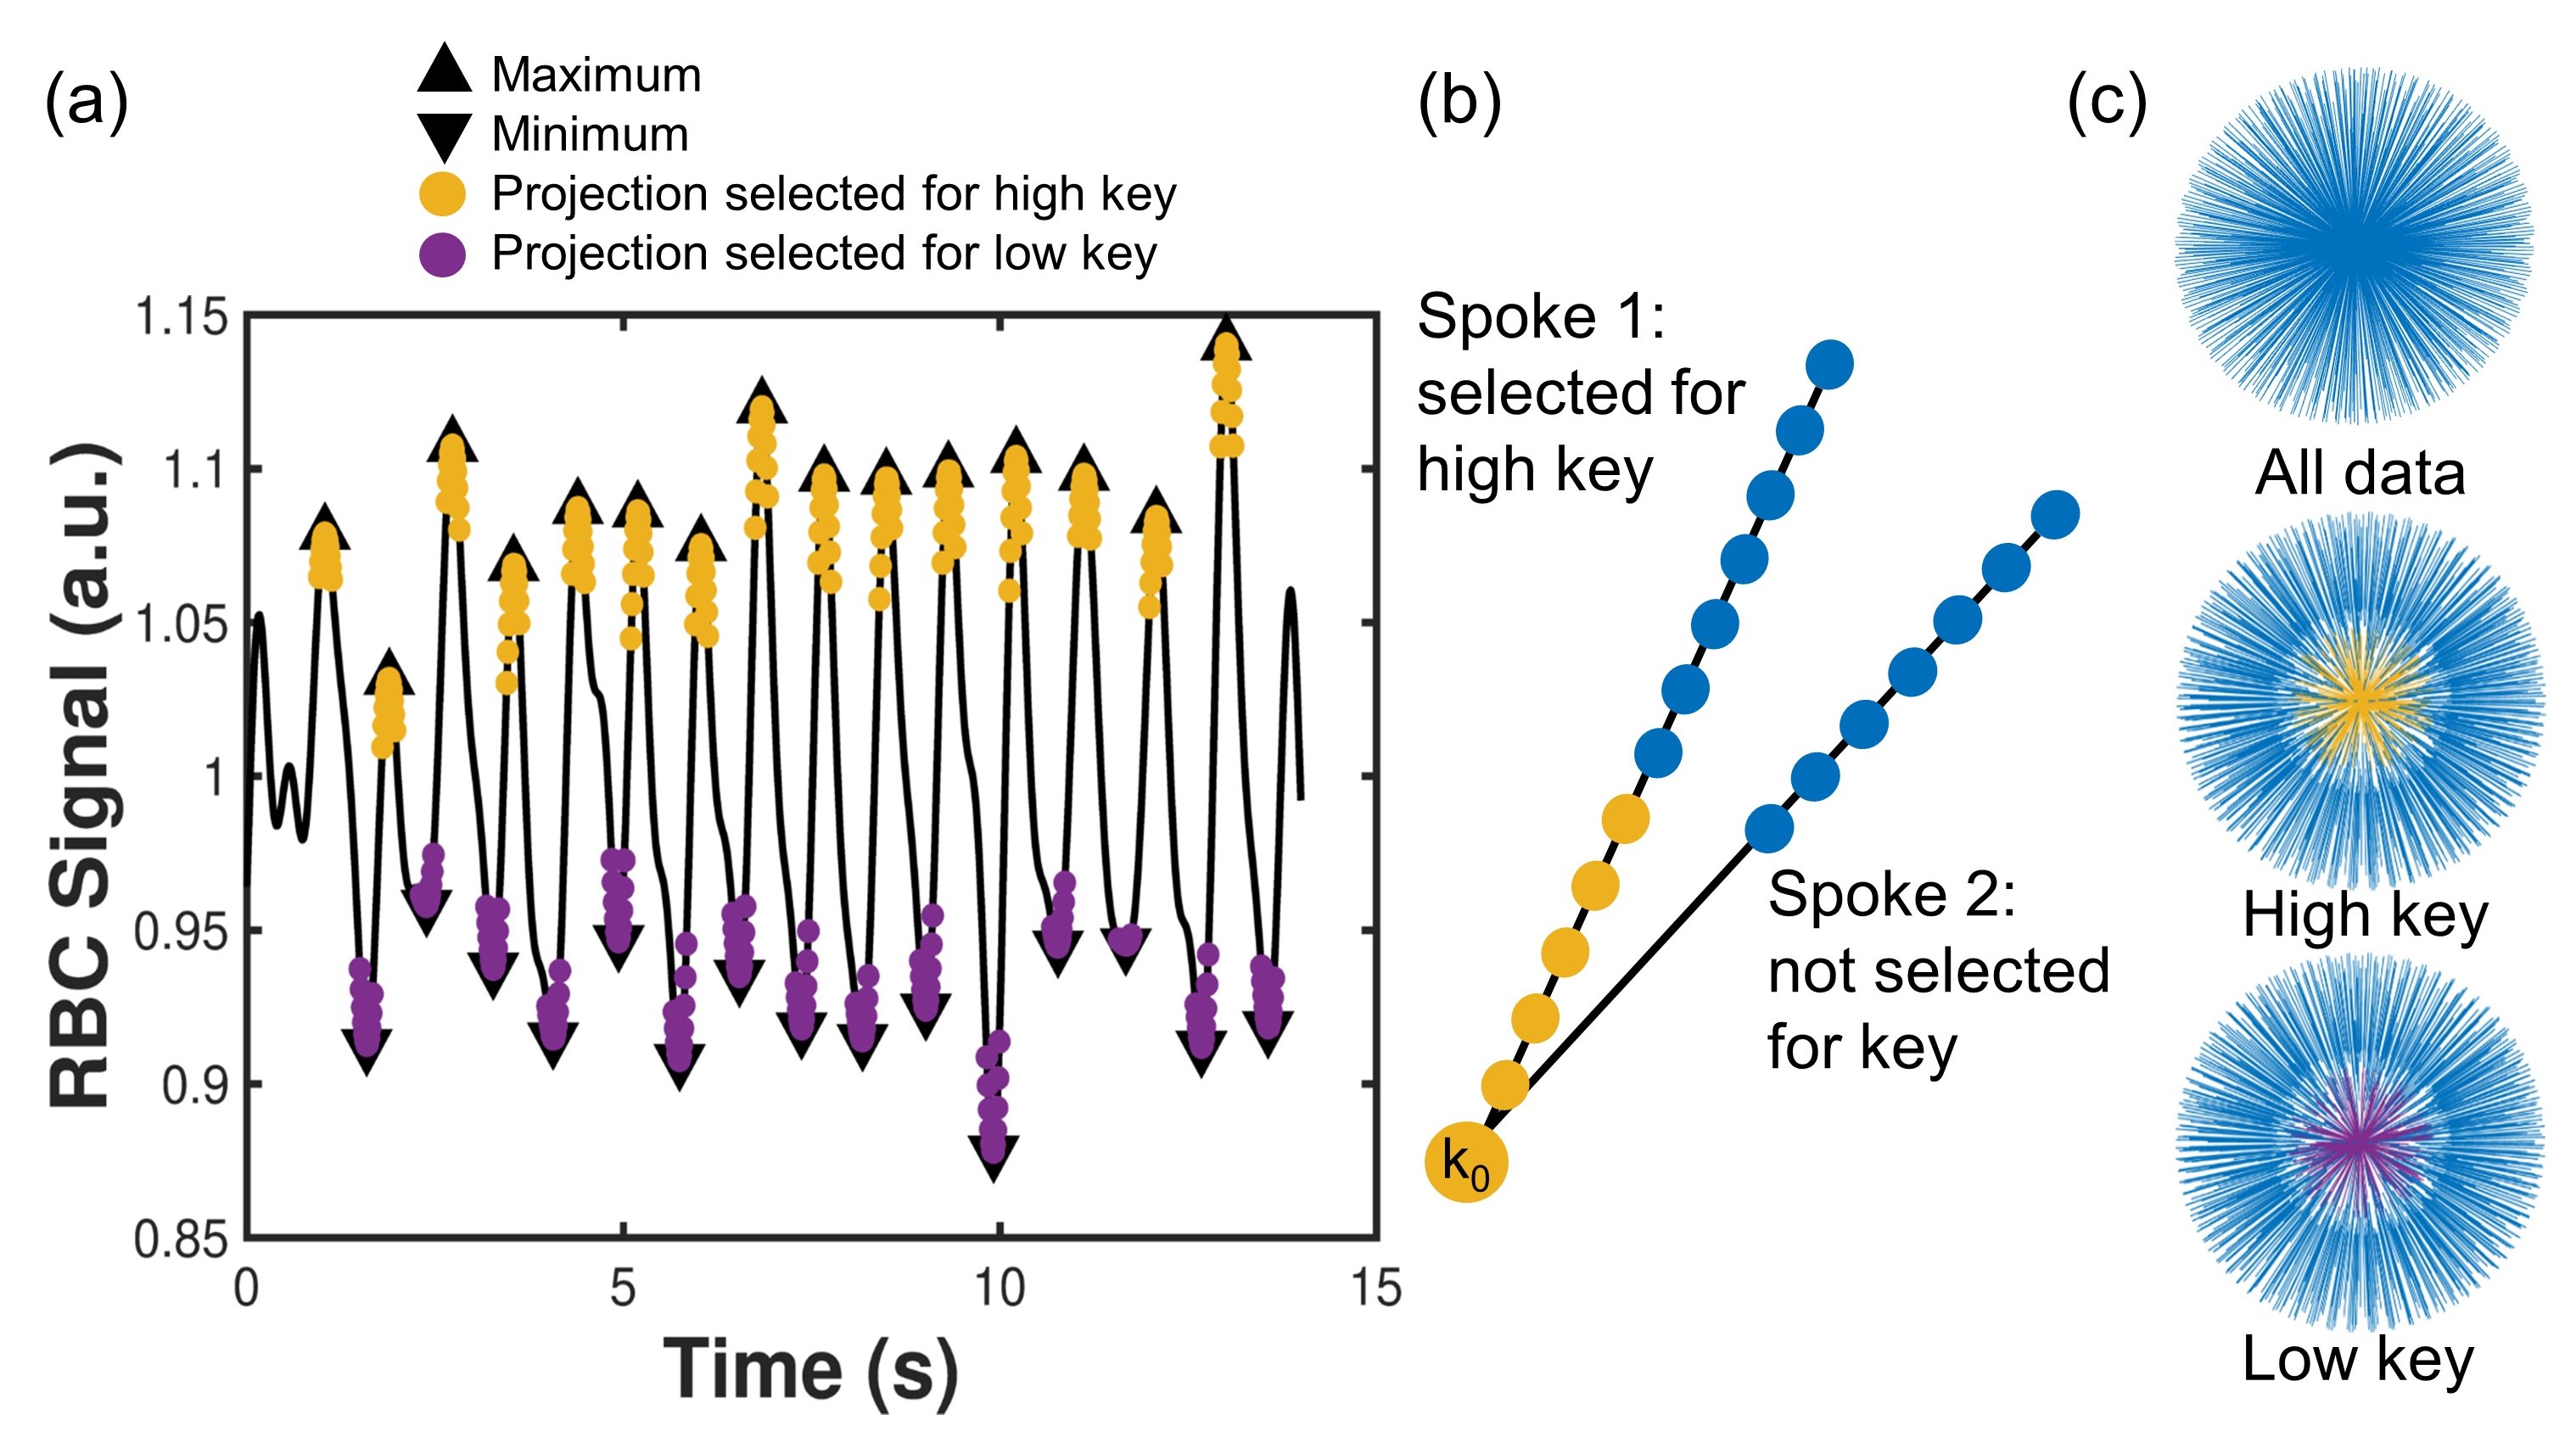
- Two-Key9 (Figure 1): the k0 data were binned according to RBC signal amplitude and images were reconstructed from the radial spokes in “low” and “high” bins. The oscillation amplitude (α2-Key) was found from the difference between the resulting “low” and “high” keyhole images, normalized by their mean.
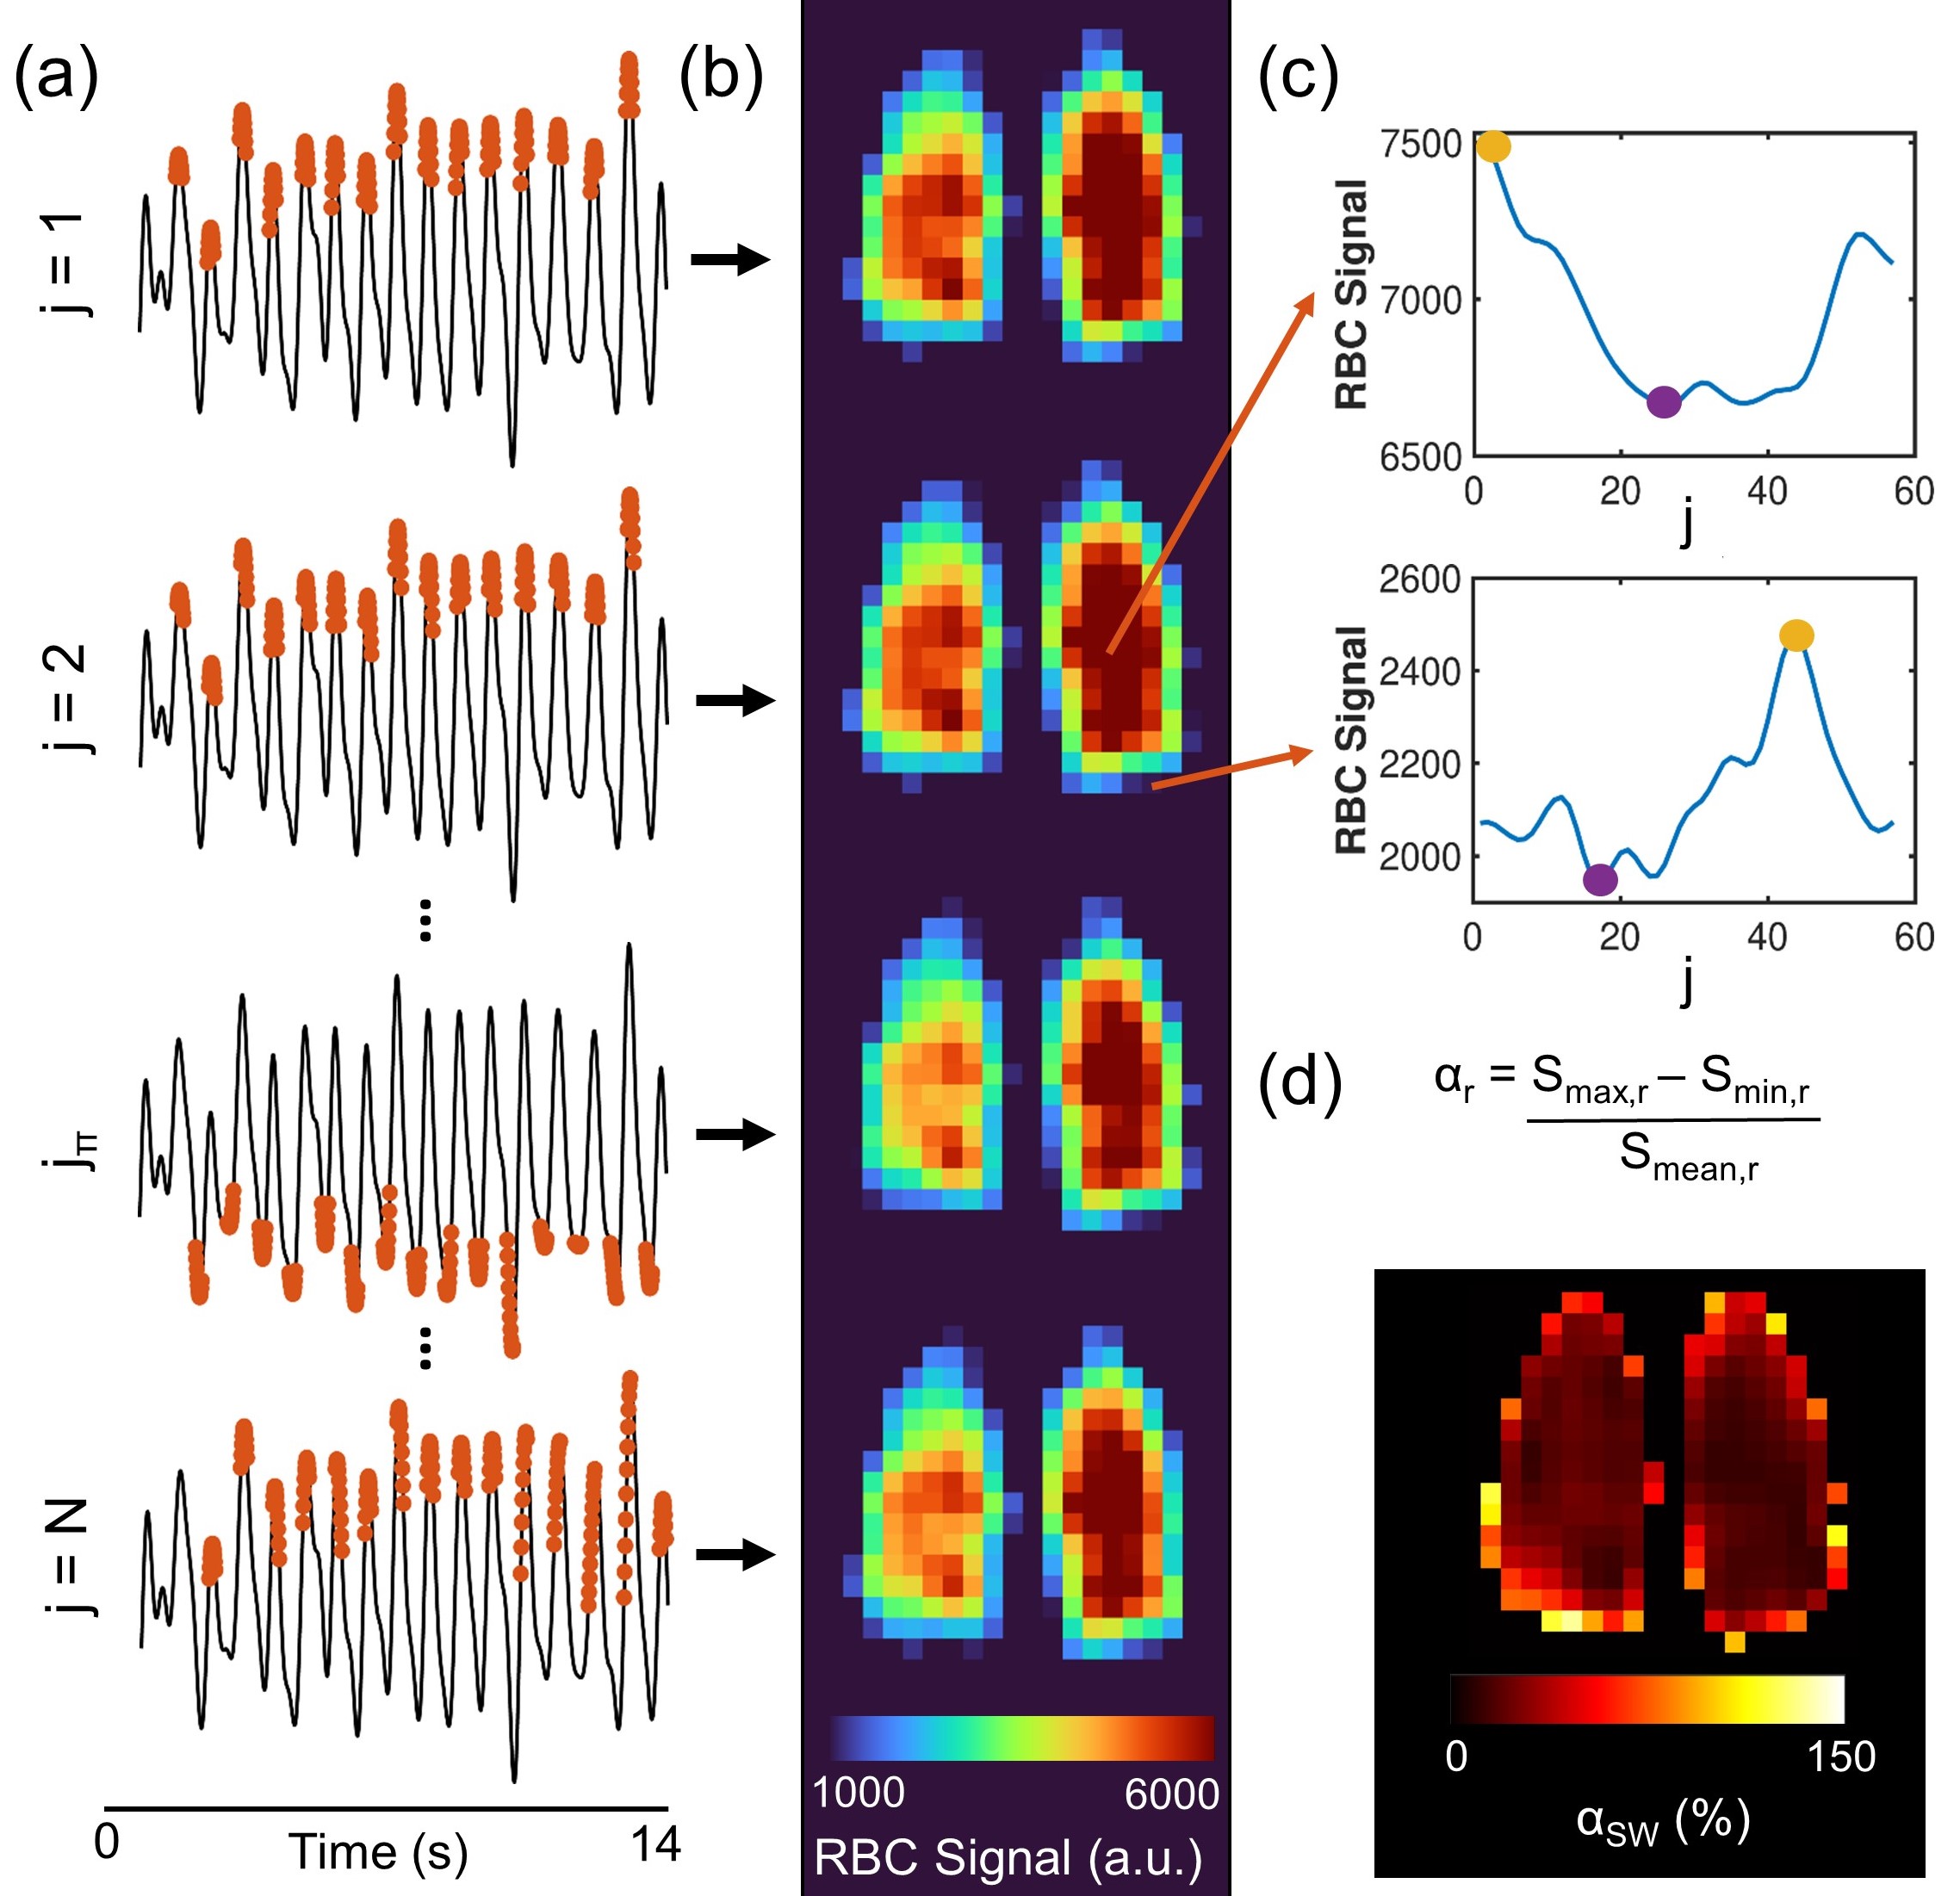
- SW (Figure 2): multiple keyhole reconstructions were performed, with the projections in the key stepped forward by one projection per reconstruction. The oscillation amplitude (αSW) was calculated from the pixelwise difference between the minimum (Smin) and maximum (Smax) signal across the N keyhole images, normalized by the mean value across all keyhole images. $$$\phi$$$ was estimated by converting the keyhole indices of Smax to phase relative to the whole-lung k0 oscillation.
Results
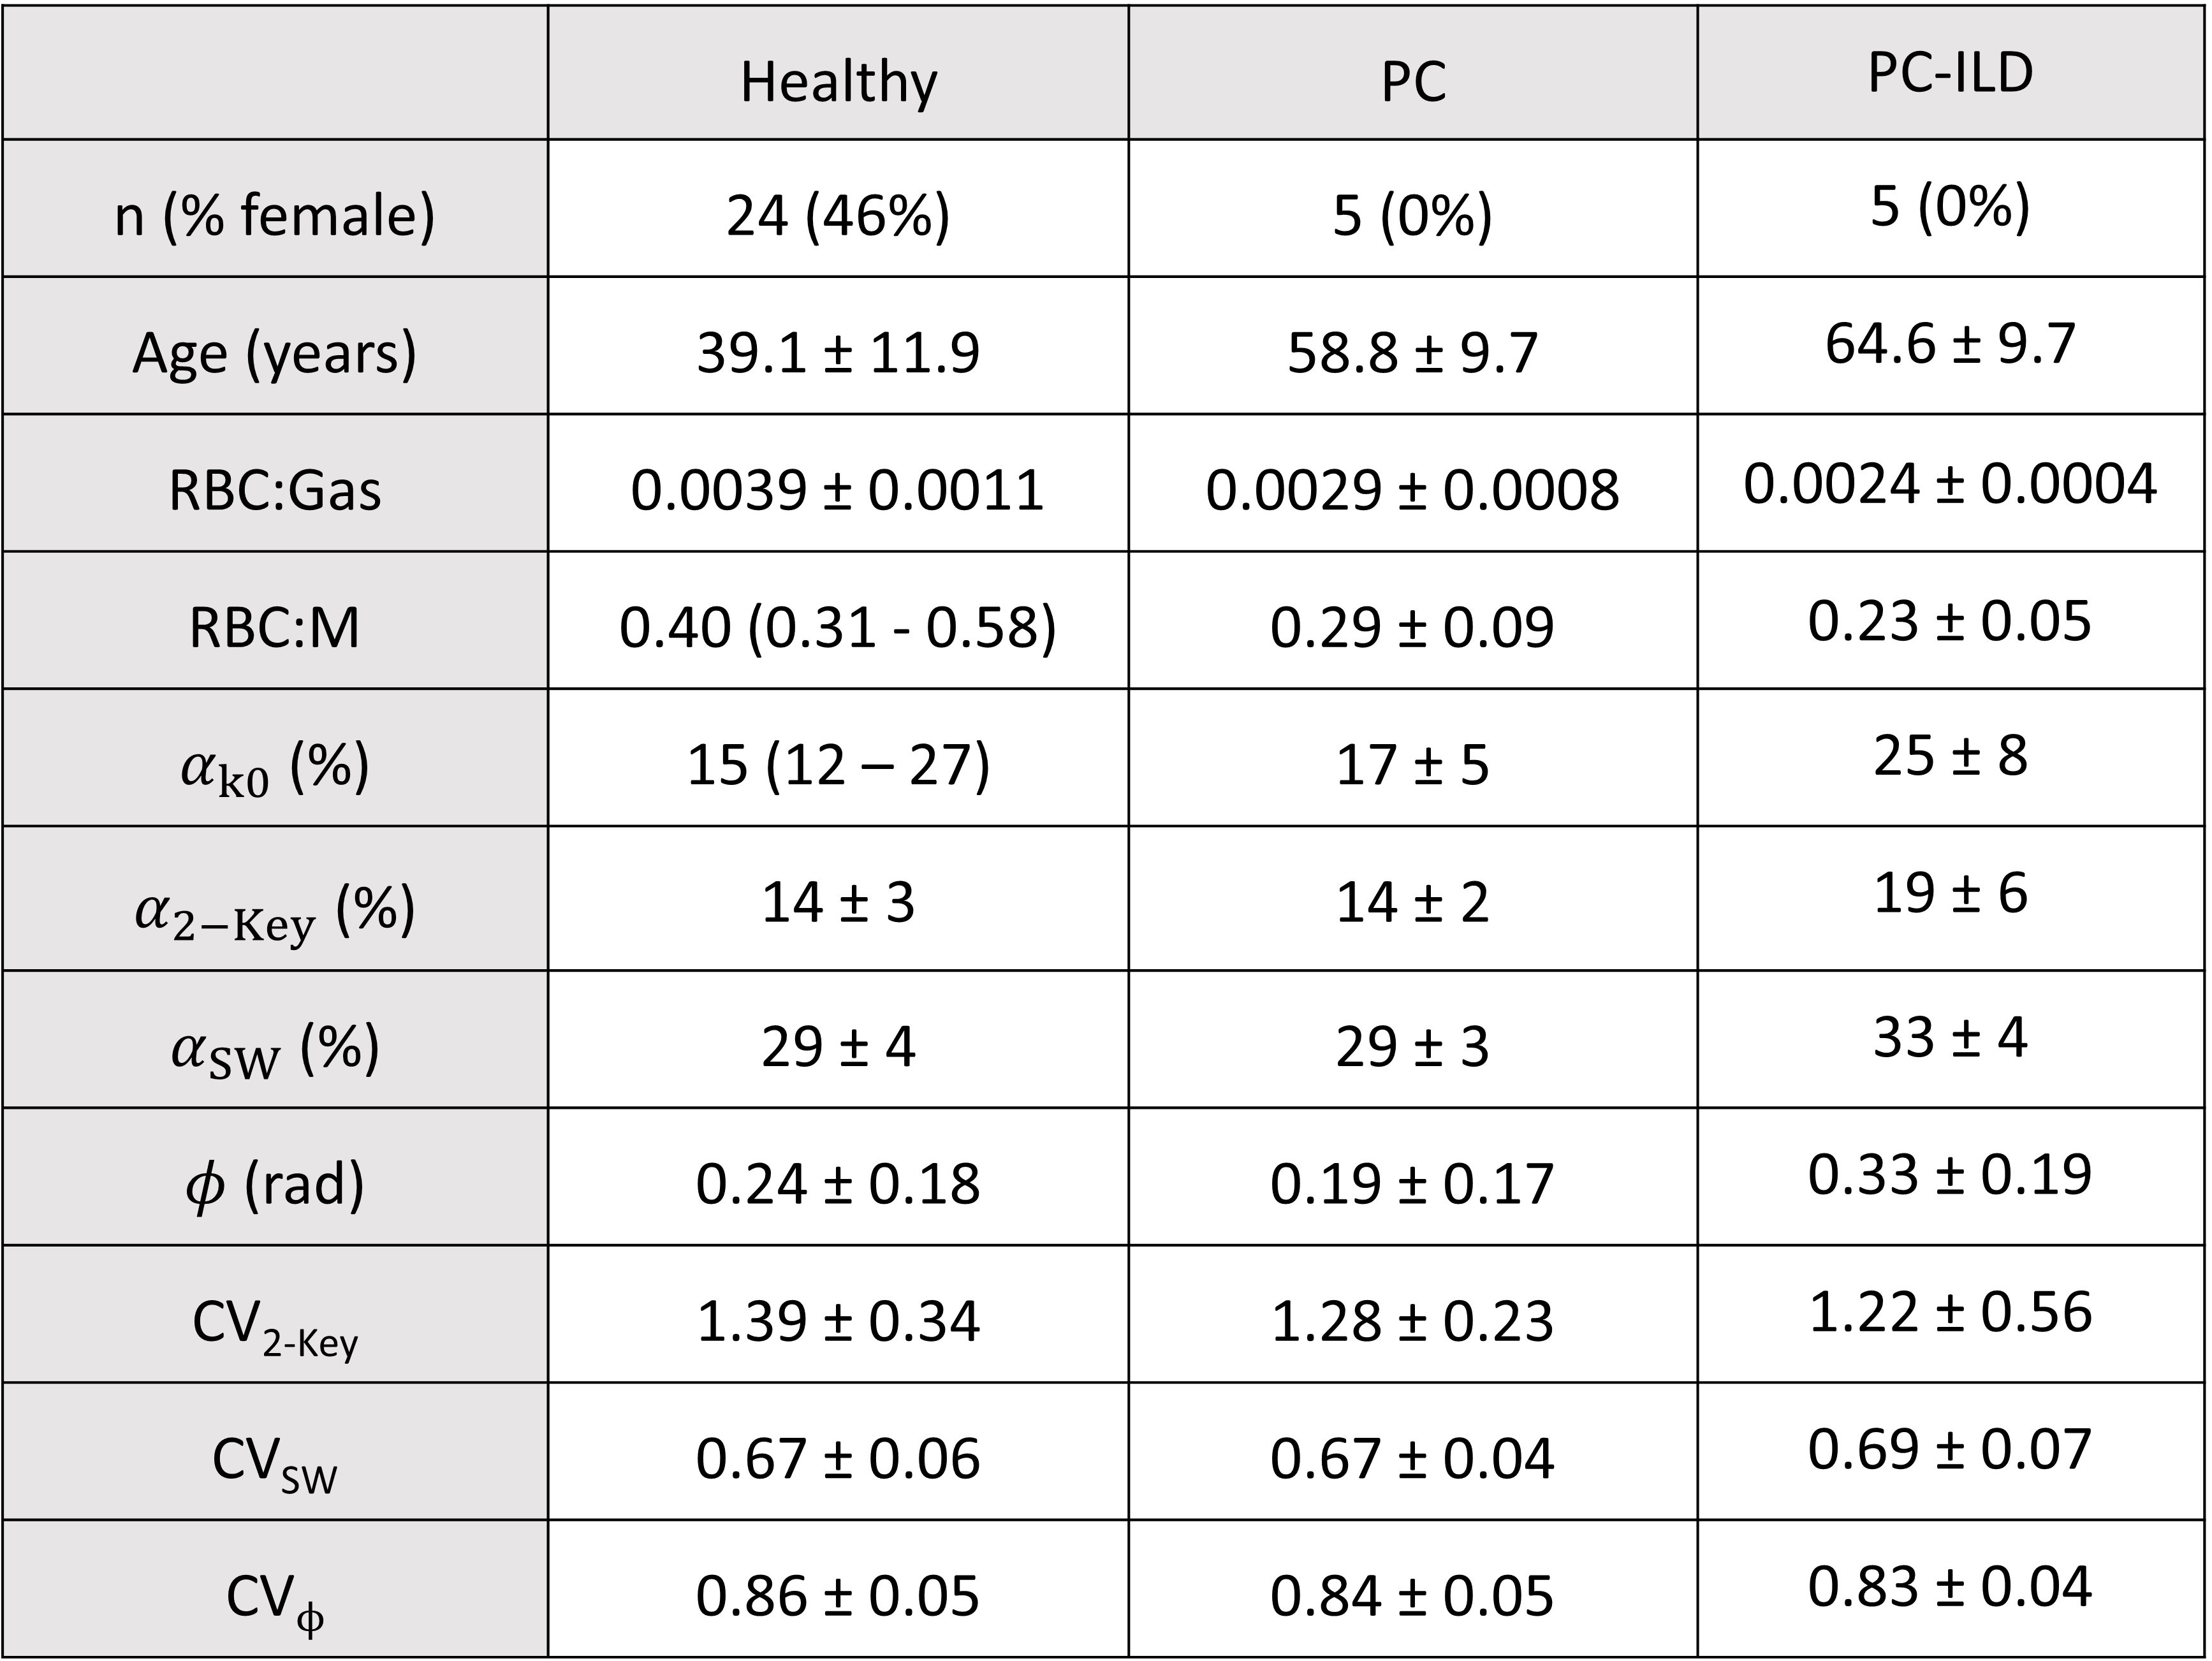
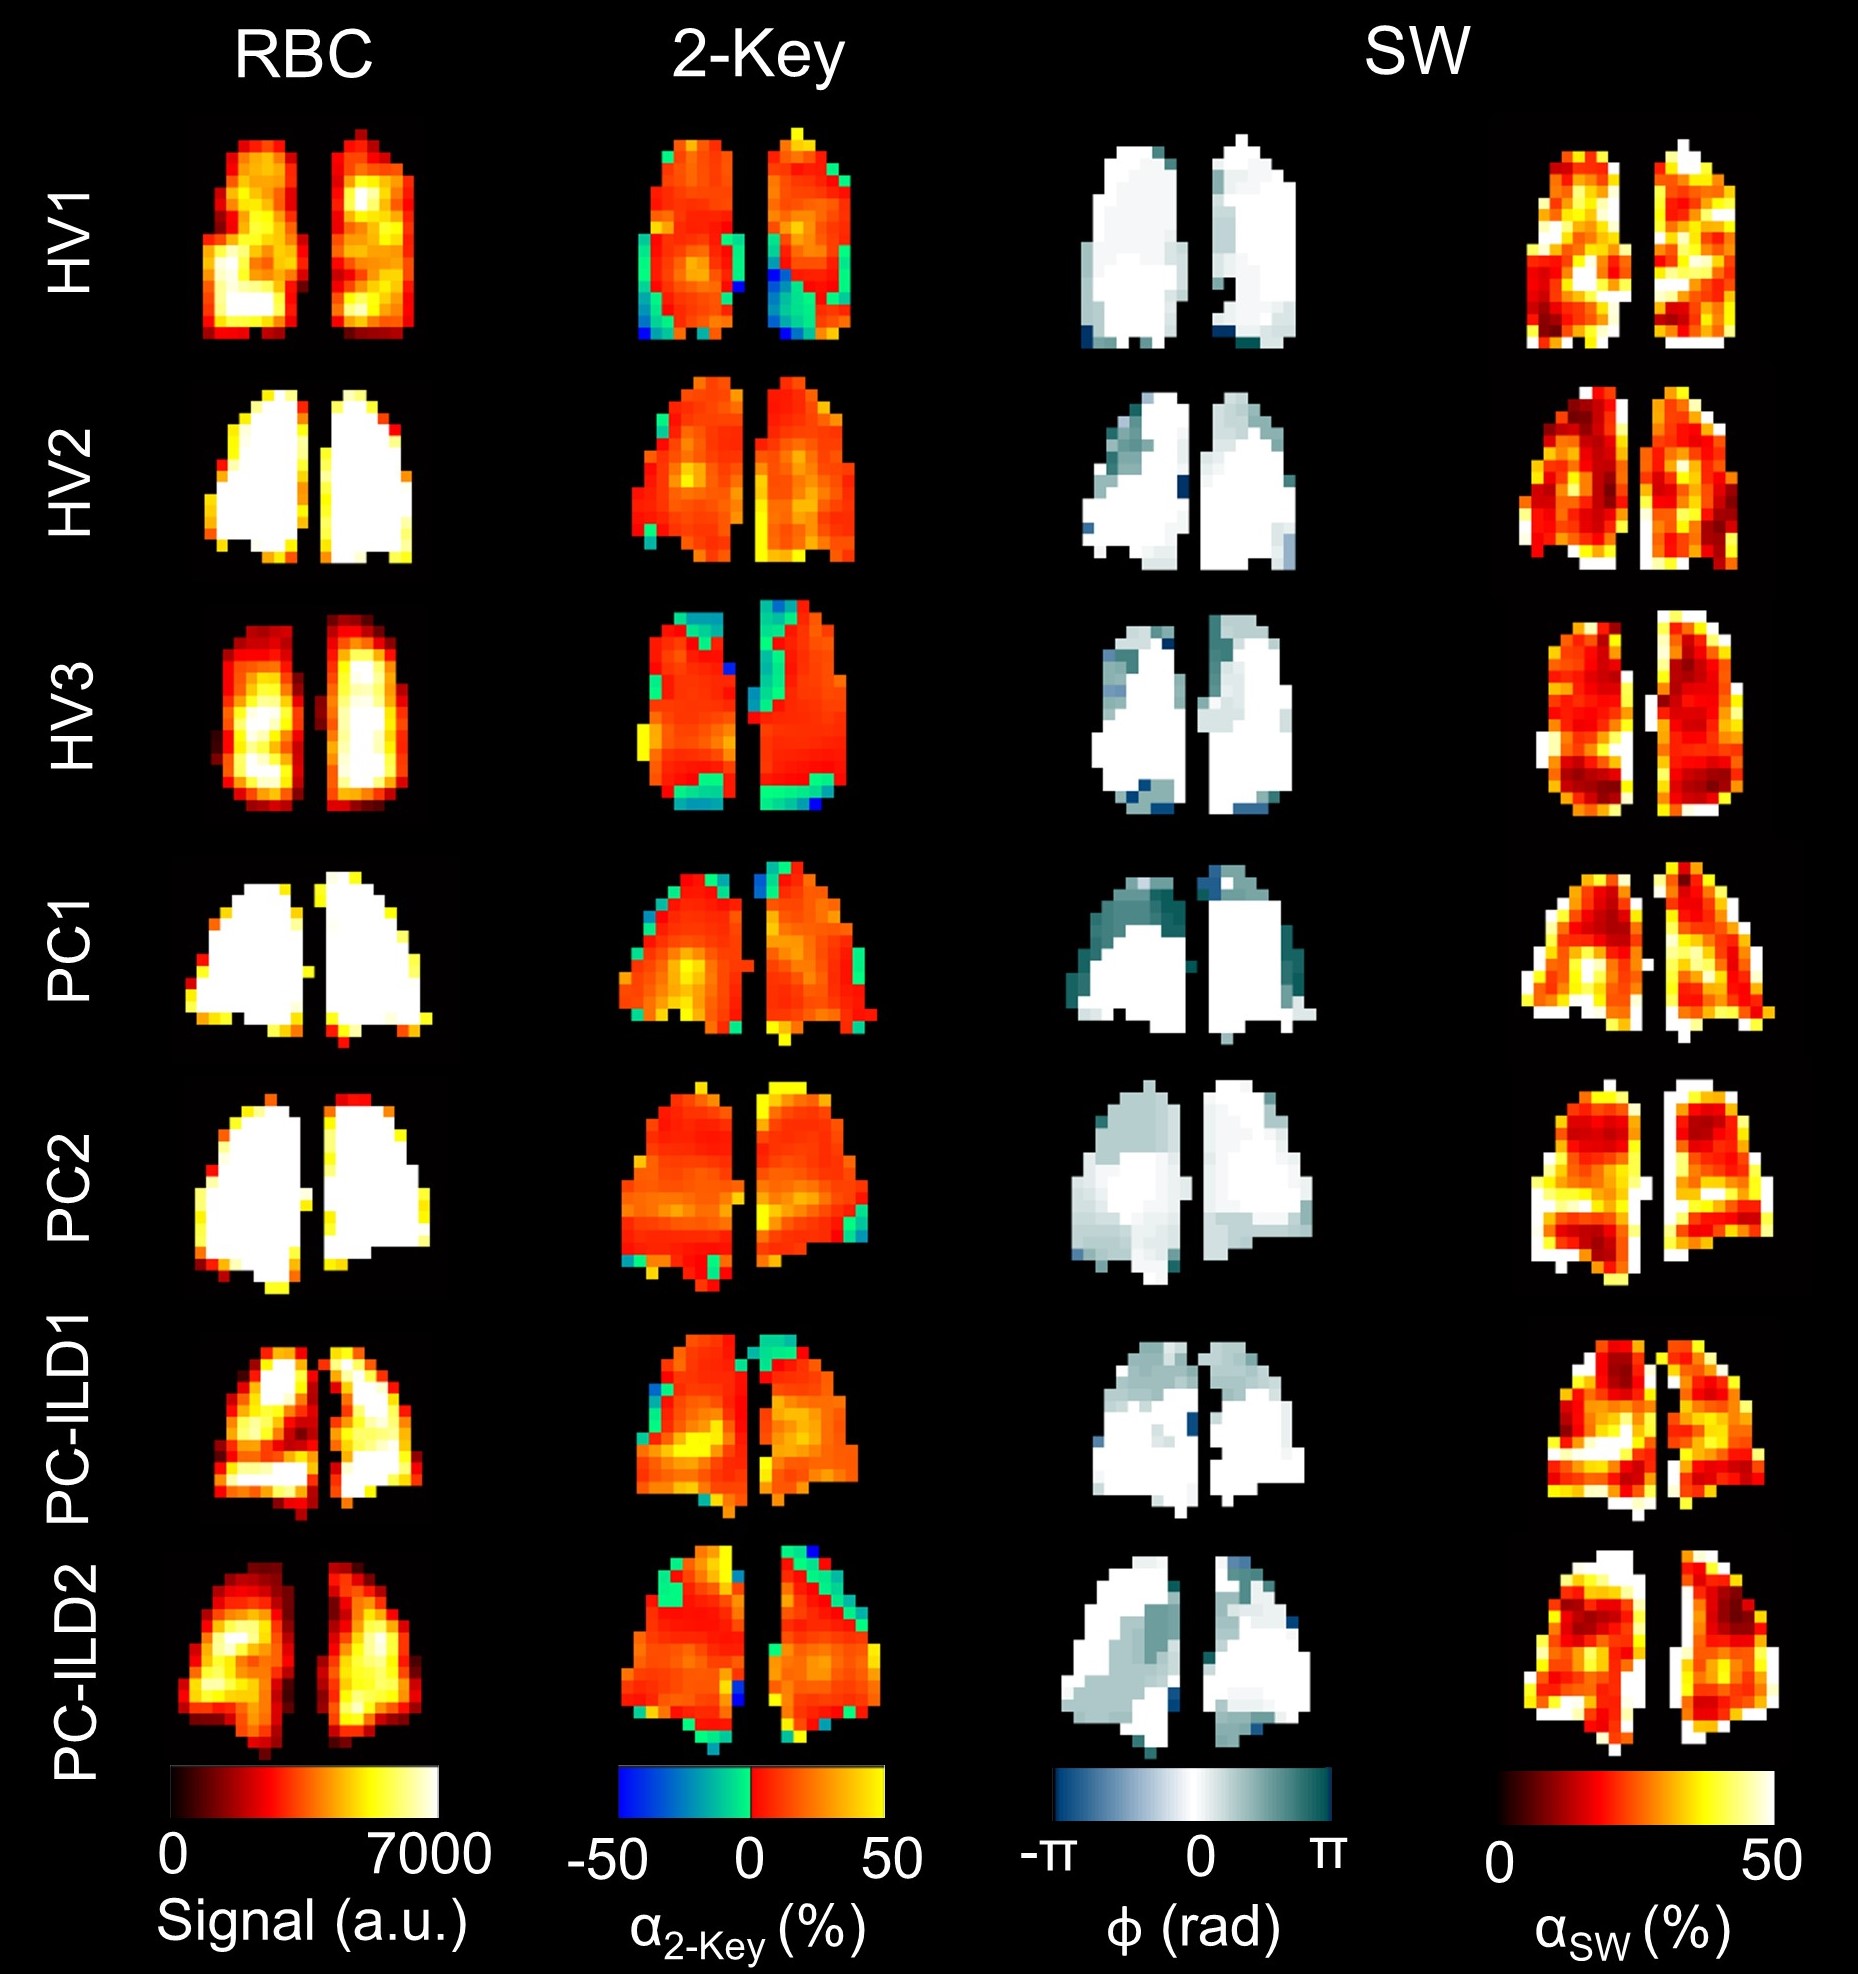
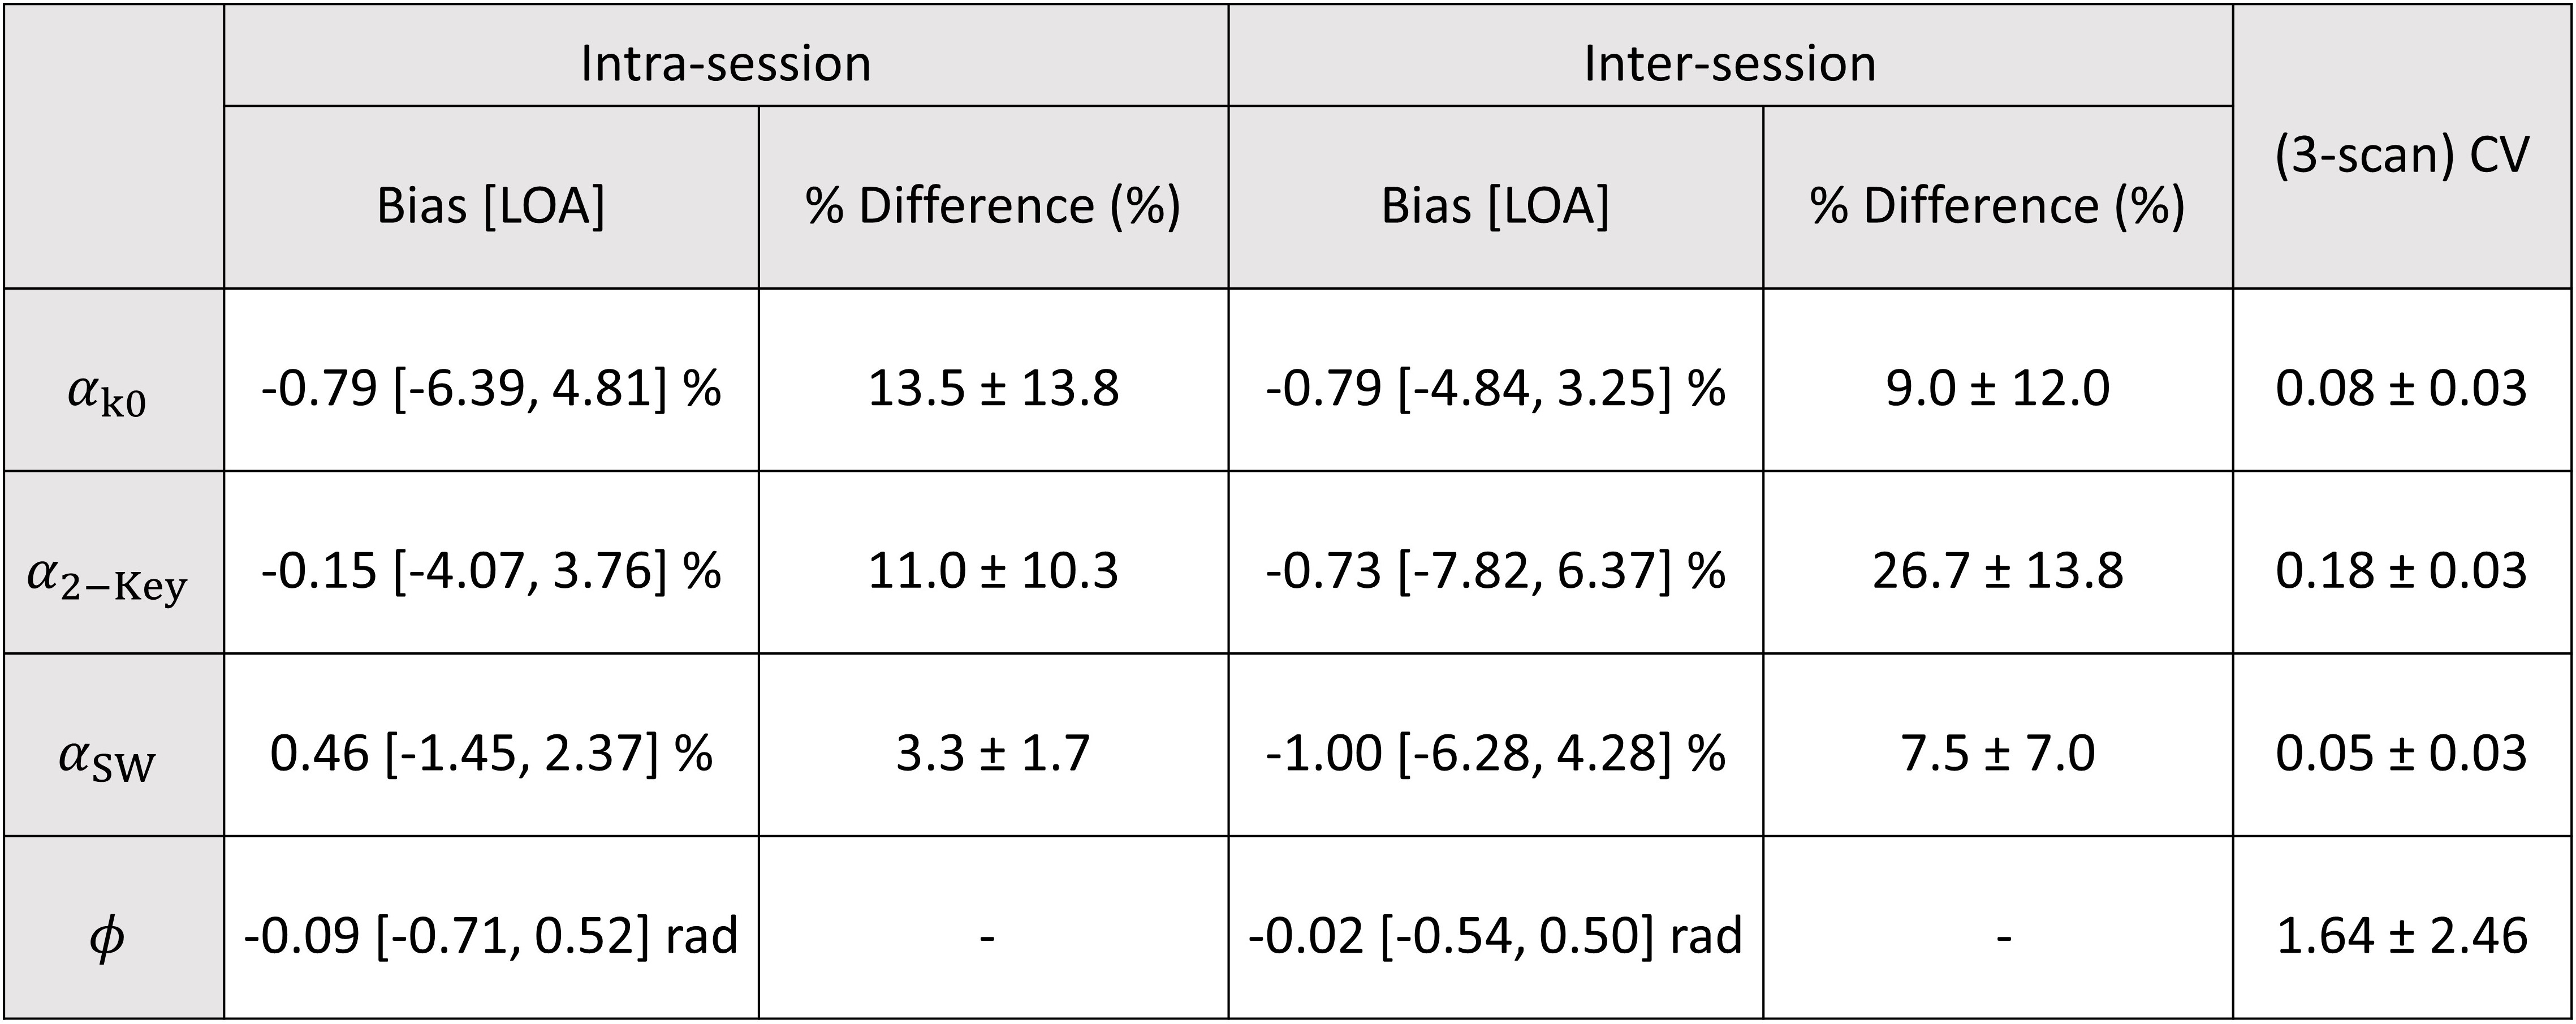
Subject demographics and oscillation mapping results are shown in Table 1. RBC maps were successfully reconstructed for each phase of the SW, revealing regional variation in both oscillation phase and amplitude (Figure 3). The Two-Key oscillation maps exhibited areas of physiologically unrealistic negative amplitudes, which qualitatively correlated with regions of increased $$$\phi$$$ and became positive in the αSW maps. αSW was significantly negatively correlated with heart rate (estimated from k0 RBC signal frequency) - Spearman’s ρ = -0.462, p = 0.023. αSW was repeatable in the subset of healthy volunteers (Table 2).Discussion
129Xe RBC signal oscillations were spatially resolved from dissolved 129Xe spectroscopic imaging using keyhole reconstruction. The mean α2-Key for the healthy subjects was (14 ± 3)%; higher than the previously reported value of 8.7%9. This is likely due to differences in the normalization process: here a pixelwise normalization by the mean of the low and high keyhole images was used, such that the SNR was comparable to the SW method.Using the SW method, regional RBC oscillation phase differences were mapped in addition to phase-adjusted amplitude. Phase differences mostly occurred in the peripheral lung and qualitatively correlated with areas of negative oscillation amplitude in the Two-Key maps. These may be caused by effects of the cardiac pulse wave, such as reflections due to impedance mismatch at bifurcations, or variations in blood flow velocity with vessel stiffness or compliance. The negative correlation of αSW and heart rate may be due to the heart spending relatively less time in diastole per beat when heart rate is increased, resulting in higher blood flow throughout the cardiac cycle and reduced blood flow pulsatility12. A significant correlation was not seen with heart rate and αk0 or α2-Key. αSW was repeatable and had a lower three-scan coefficient of variation (CV) than αk0 or α2-Key. This may be because αSW is independent of phase, which also varies between scans.
Although the patient groups were small, and not age-matched with the healthy volunteers, our preliminary results show an increase in αk0, α2-Key, αSW and $$$\phi$$$ relative to the healthy volunteers in the PC-ILD patients but not the PC patients. This may reflect focal regions of ILD-related lung pathology. A limitation of this method is the requirement for high SNR RBC images and clear signal oscillations, which could limit its application in diseases with low RBC transfer.
Conclusion
SW keyhole reconstruction of dissolved radial 129Xe imaging reveals regional RBC oscillation phase differences which are not fully captured by Two-Key reconstruction. This may reflect the effect of the cardiac pulse wave in the pulmonary microvasculature.Acknowledgements
We thank Dr Laura Saunders and Dr Roger Thompson, the POLARIS group and the study teams and patients of the MURCO and PC-ILD (Xmas) studies for the collection of the clinical data used to test the method. The work was funded by MRC grants awarded to J.M.W.: MR/M008894/1 and MR/W006111/1. J.H.P-M is funded by a PhD scholarship from the Discovery Medicine North (DiMeN) Doctoral Training Partnership.References
1. Ruppert K, Altes TA, Mata JF, et al., Detecting pulmonary capillary blood pulsations using hyperpolarized xenon-129 chemical shift saturation recovery (CSSR) MR spectroscopy. Magnetic Resonance in Medicine, 2016. 75(4): p. 1771-1780.
2. Venkatesh AK, Hong KS, Kubatina L, et al. Direct Observation of the Transport of 129Xe from the Lung-Gas to the Tissue and the Blood. in Proc. Intl. Soc. Mag. Reson. Med. 2001.
3. Norquay G, Leung G, Stewart NJ, Wolber J, and Wild JM, 129Xe chemical shift in human blood and pulmonary blood oxygenation measurement in humans using hyperpolarized129Xe NMR. Magnetic Resonance in Medicine, 2017. 77(4): p. 1399-1408.
4. Wang ZY, Bier EA, Swaminathan A, et al., Diverse cardiopulmonary diseases are associated with distinct xenon magnetic resonance imaging signatures. European Respiratory Journal, 2019. 54(6).
5. Mummy DG, Bier EA, Wang ZY, et al., Hyperpolarized Xe-129 MRI and Spectroscopy of Gas-Exchange Abnormalities in Nonspecific Interstitial Pneumonia. Radiology, 2021. 301(1): p. 211-220.
6. Collier GJ, Eaden JA, Hughes PJC, et al., Dissolved Xe-129 lung MRI with four-echo 3D radial spectroscopic imaging: Quantification of regional gas transfer in idiopathic pulmonary fibrosis. Magnetic Resonance in Medicine, 2021. 85(5): p. 2622-2633.
7. Bier EA, Robertson SH, Schrank GM, et al., A protocol for quantifying cardiogenic oscillations in dynamic (129) Xe gas exchange spectroscopy: The effects of idiopathic pulmonary fibrosis. NMR Biomed, 2019. 32(1): p. e4029.
8. Bier EA, Alenezi F, Lu J, et al., Noninvasive diagnosis of pulmonary hypertension with hyperpolarised (129)Xe magnetic resonance imaging and spectroscopy. ERJ Open Res, 2022. 8(2).
9. Niedbalski PJ, Bier EA, Wang Z, et al., Mapping cardiopulmonary dynamics within the microvasculature of the lungs using dissolved 129Xe MRI. Journal of Applied Physiology, 2020. 129(2): p. 218-229.
10. Lu J, Bier E, Leewiwatwong S, et al. Improved 129Xe MRI Of Cardiopulmonary Oscillations In Patients With Chronic Thromboembolic Pulmonary Hypertension. in Proc. 31st Intl. Soc. Mag. Reson. Med. 1402. 2023.
11. Norquay G, Collier GJ, Rao M, Stewart NJ, and Wild JM, 129Xe-Rb Spin-Exchange Optical Pumping with High Photon Efficiency. Physical Review Letters, 2018. 121(15): p. 153201.
12. Wasserman K, Butler J, and Kessel AV, Factors affecting the pulmonary capillary blood flow pulse in man. Journal of Applied Physiology, 1966. 21(3): p. 890-900.
Figures