0228
Revealing COPD Uneven Ventilation and Altered Gas Exchange with Dynamic Simultaneous Gas Exchange and Ventilation Imaging1University of Pennsylvania, Philadelphia, PA, United States
Synopsis
Keywords: Hyperpolarized MR (Gas), Contrast Agent, Dynamic Imaging of Respiratory Function
Motivation: The study aims to refine lung disease diagnosis through dynamic imaging, surpassing conventional breath-hold MRI limitations.
Goal(s): This research aims to confirm the efficacy of a new 4D dynamic HXe MRI method for real-time lung function imaging, enhancing our grasp of diseases like COPD.
Approach: Our method employs synchronized 4D dynamic MRI to differentiate lung function in healthy individuals, COPD sufferers, and a smoker, revealing subtle health variations.
Results: Dynamic imaging revealed consistent ventilation in healthy lungs but identified irregularities and a novel reversed RBC:Gas ratio pattern in COPD, indicating significant alterations in gas exchange dynamics.
Impact: This study enhances understanding of COPD and could shift diagnostic and treatment practices, paving the way for targeted therapies and improved patient outcomes.
Introduction
Hyperpolarized 129Xe (HXe) MR imaging of lung function typically requires breath-holds which may not accurately reflect normal breathing. Dynamic imaging overcomes this limitation by capturing a full spectrum of MRI contrasts that respond to the lungs' natural movements during spontaneous breathing and heartbeats. This technique can identify regions with impaired gas exchange, crucial for detecting diseases such as COPD earlier, guiding treatment, and evaluating vascular abnormalities associated with conditions such as pulmonary hypertension.Methods
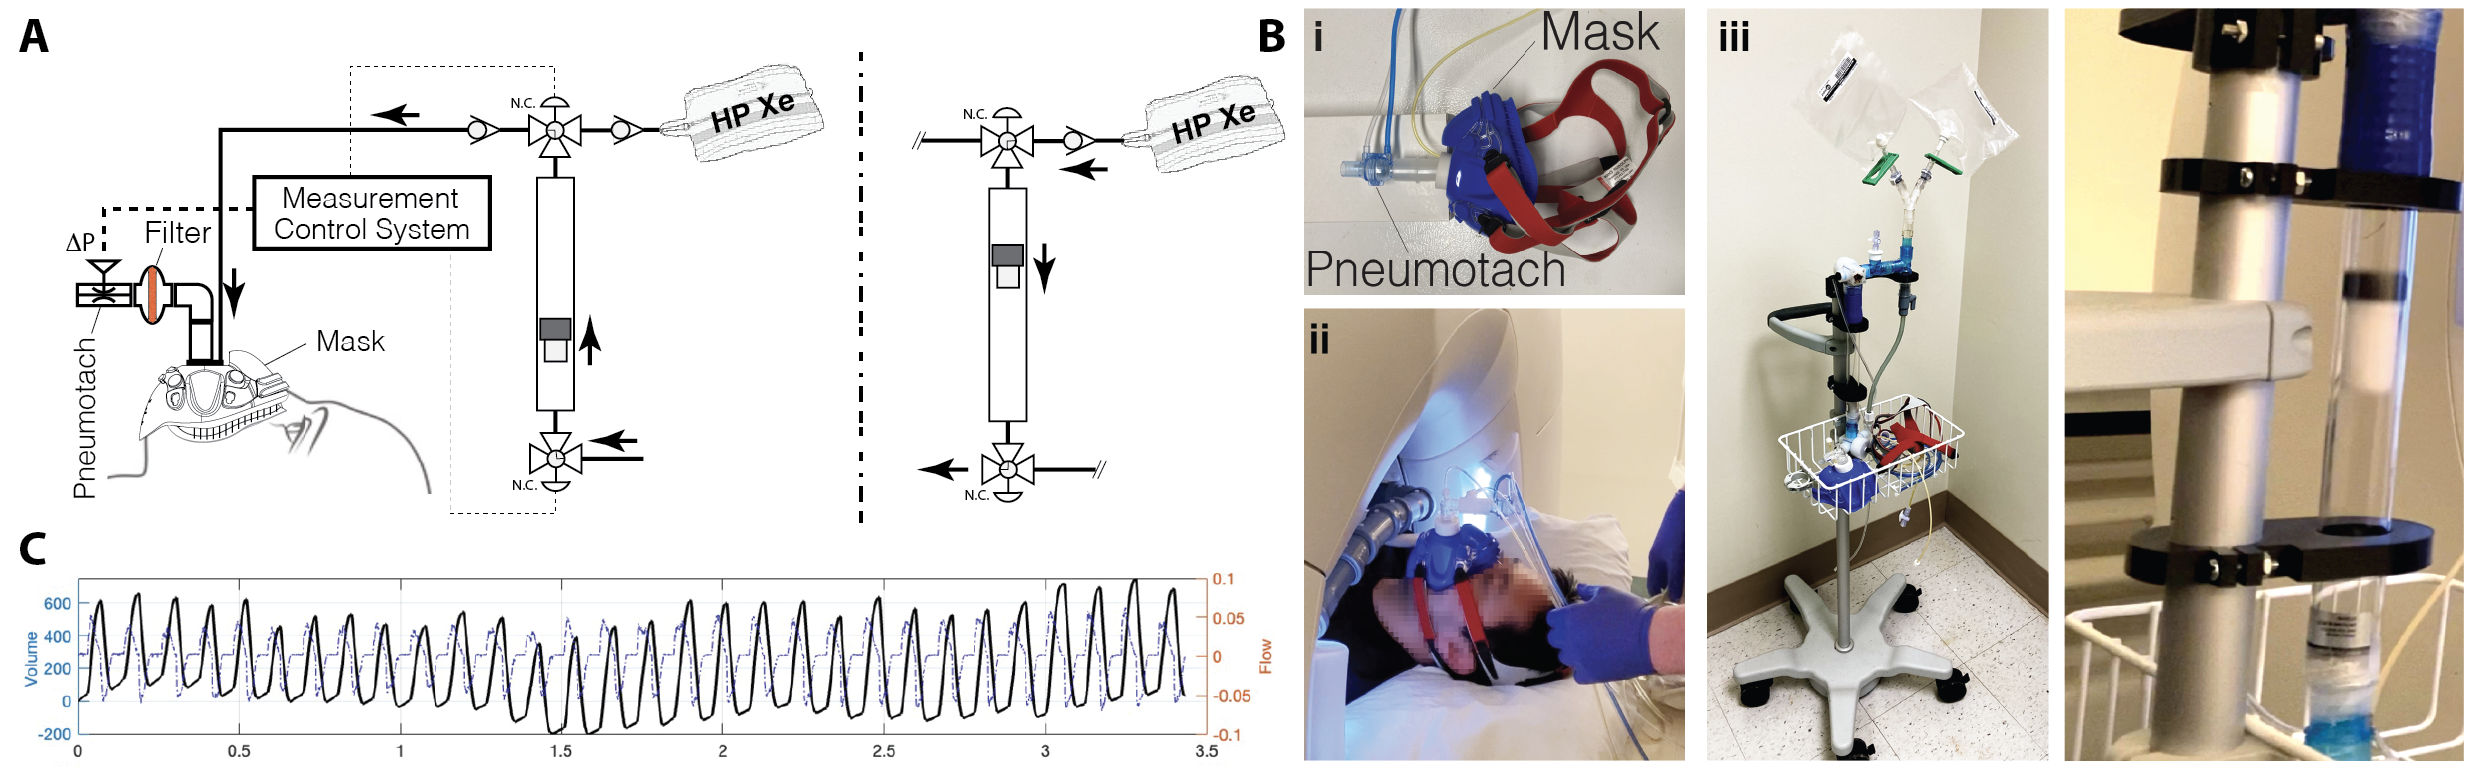
We imaged four healthy subjects, four COPD patients, and a 47-y.o. smoker using 4D dynamic HXe MRI using our dynamic imaging introduced last year. Our gas delivery system (Figure 1), which synchronizes high-purity gas release with patient breathing through a sealed mask, consistently delivered 50 ml of xenon per breath (total 2.5L) across 50 breaths. We captured lung images using a series of 26 spiral trajectories, rotated for diverse views and reconstructed based on diaphragm movement. RF pulses alternated between gas phase and RBC resonances. We applied the 1-point Dixon technique for phase correction, distinguishing between RBC and tissue plasma signals and allowing us to visualize both gas and dissolved substances simultaneously. We registered all images at the same lung inflation level using a novel registration method that combines 4D B-spline transformation with PCA-based metrics, avoiding the need for a reference image and efficiently managing intensity variations during breathing. We analyzed time-varying signal dynamics to determine regional lung ventilation as introduced before1.Results and Discussion
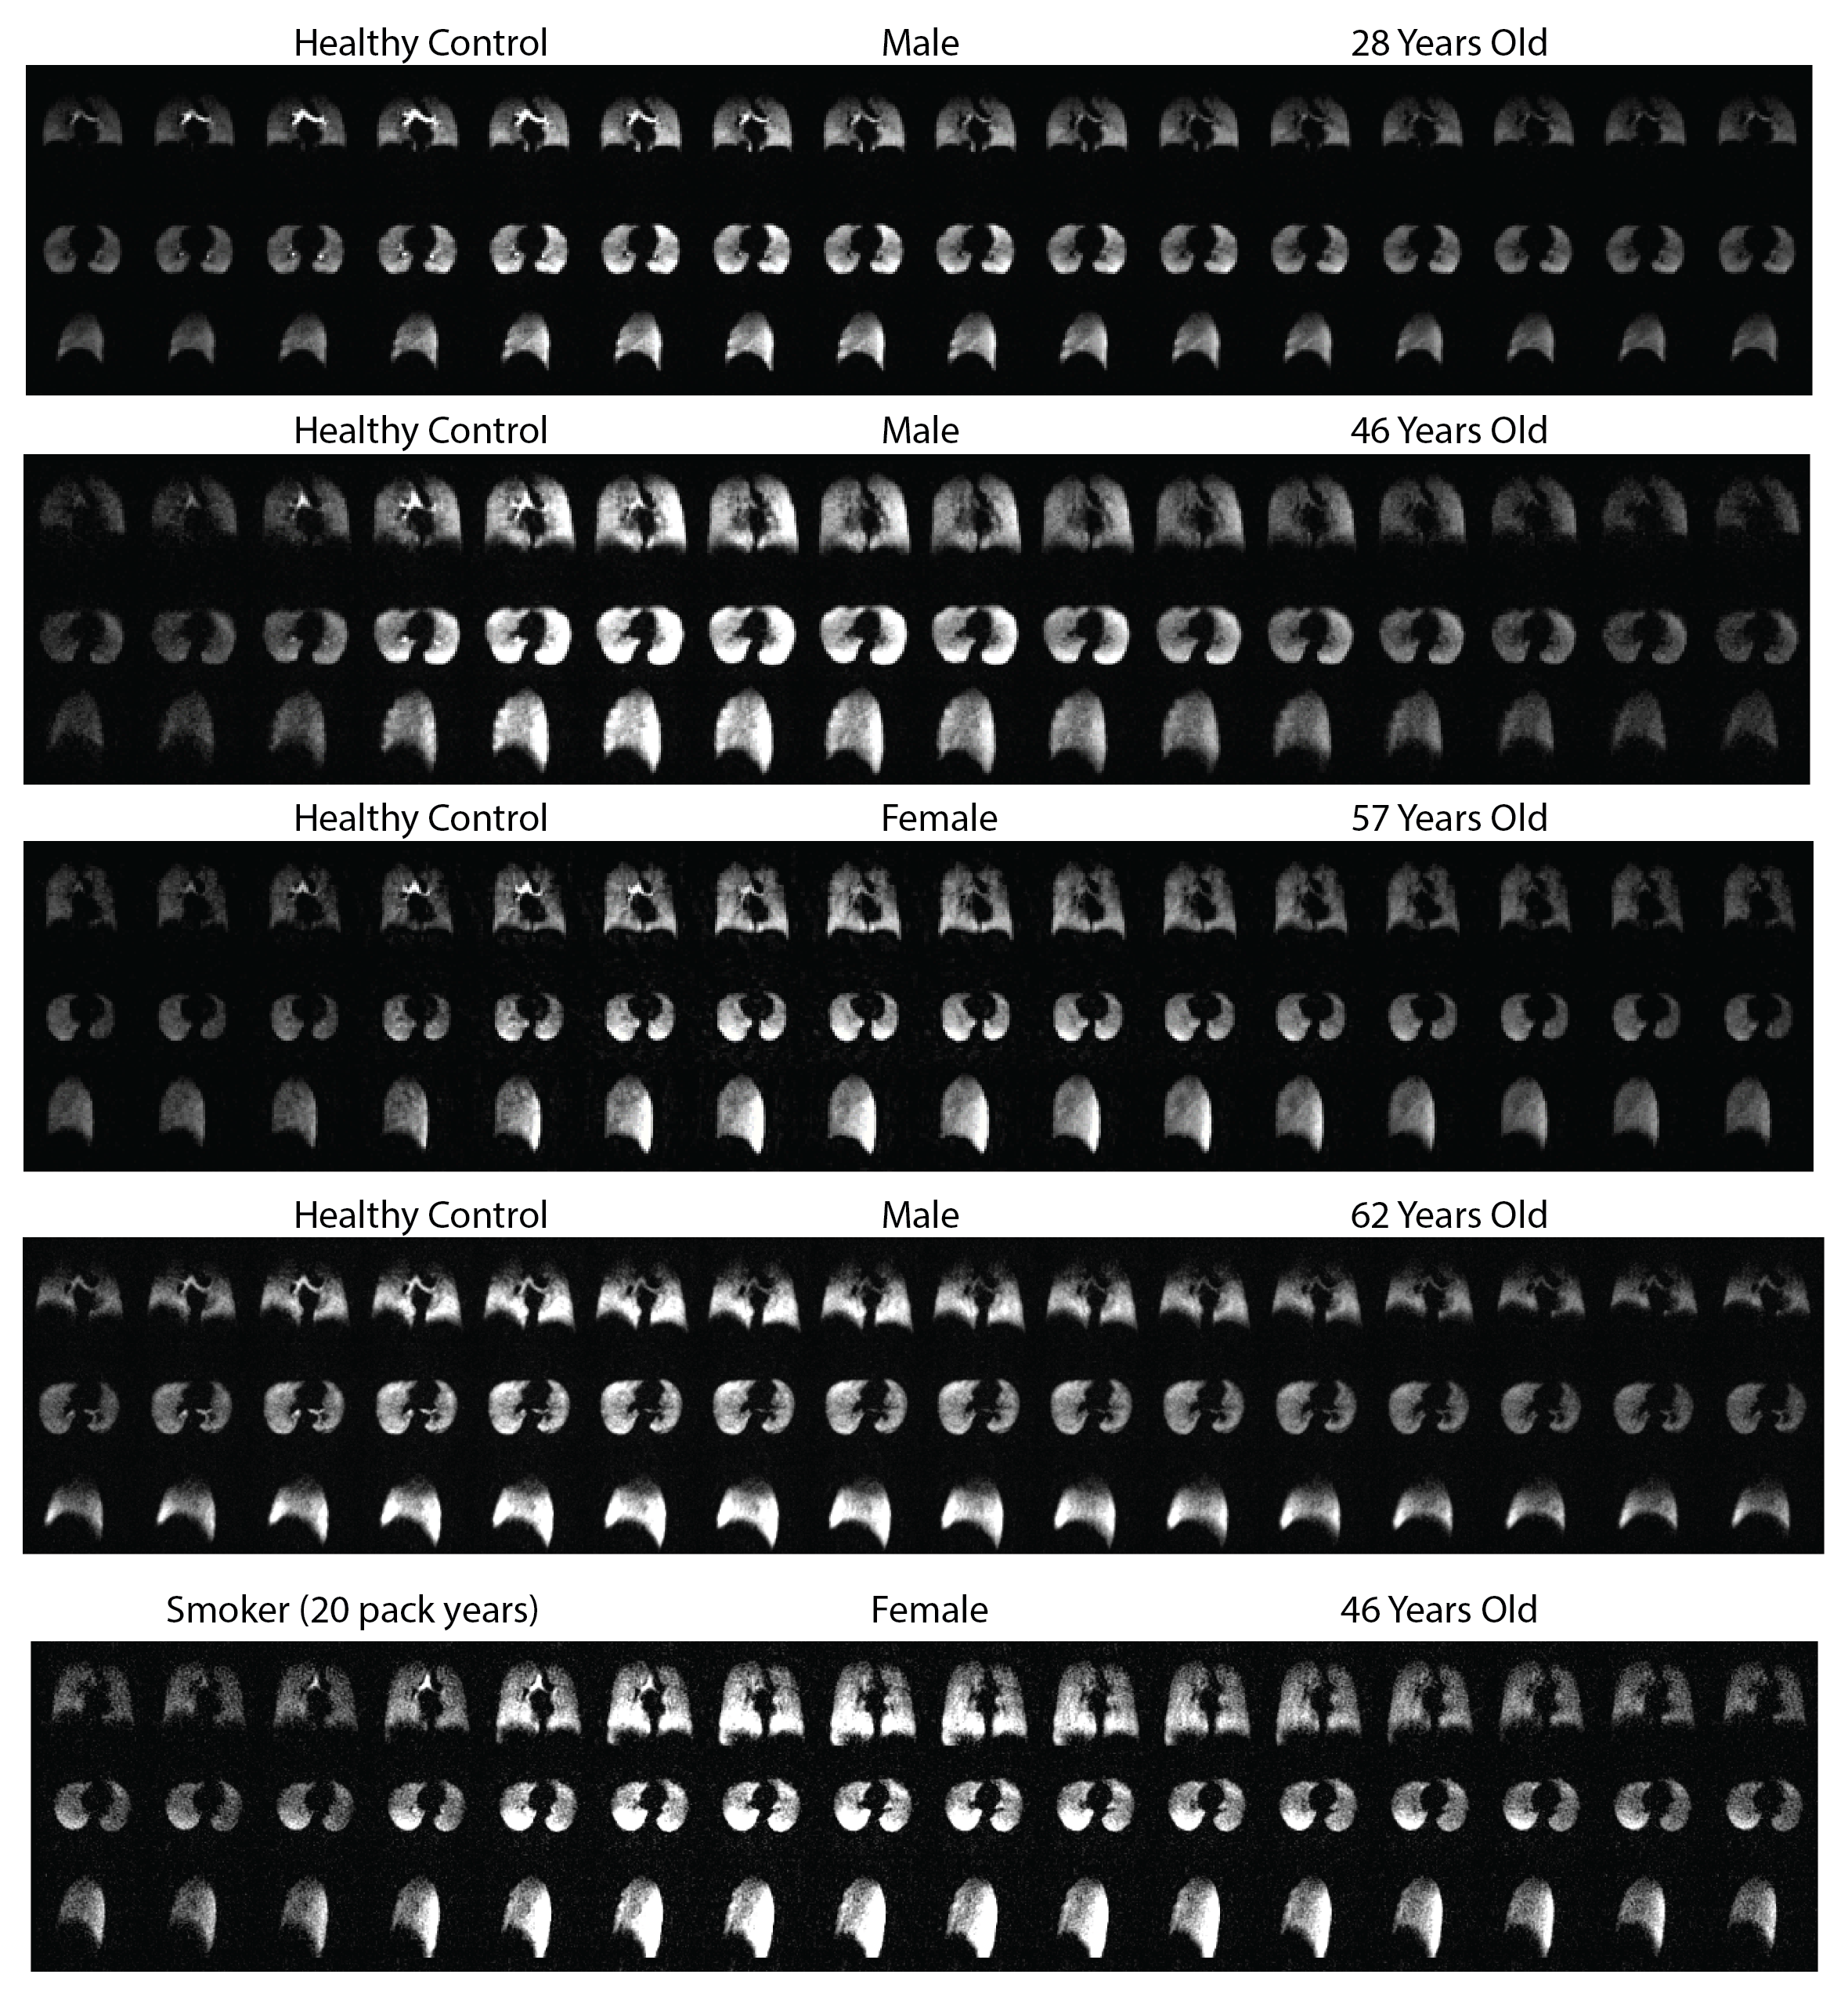
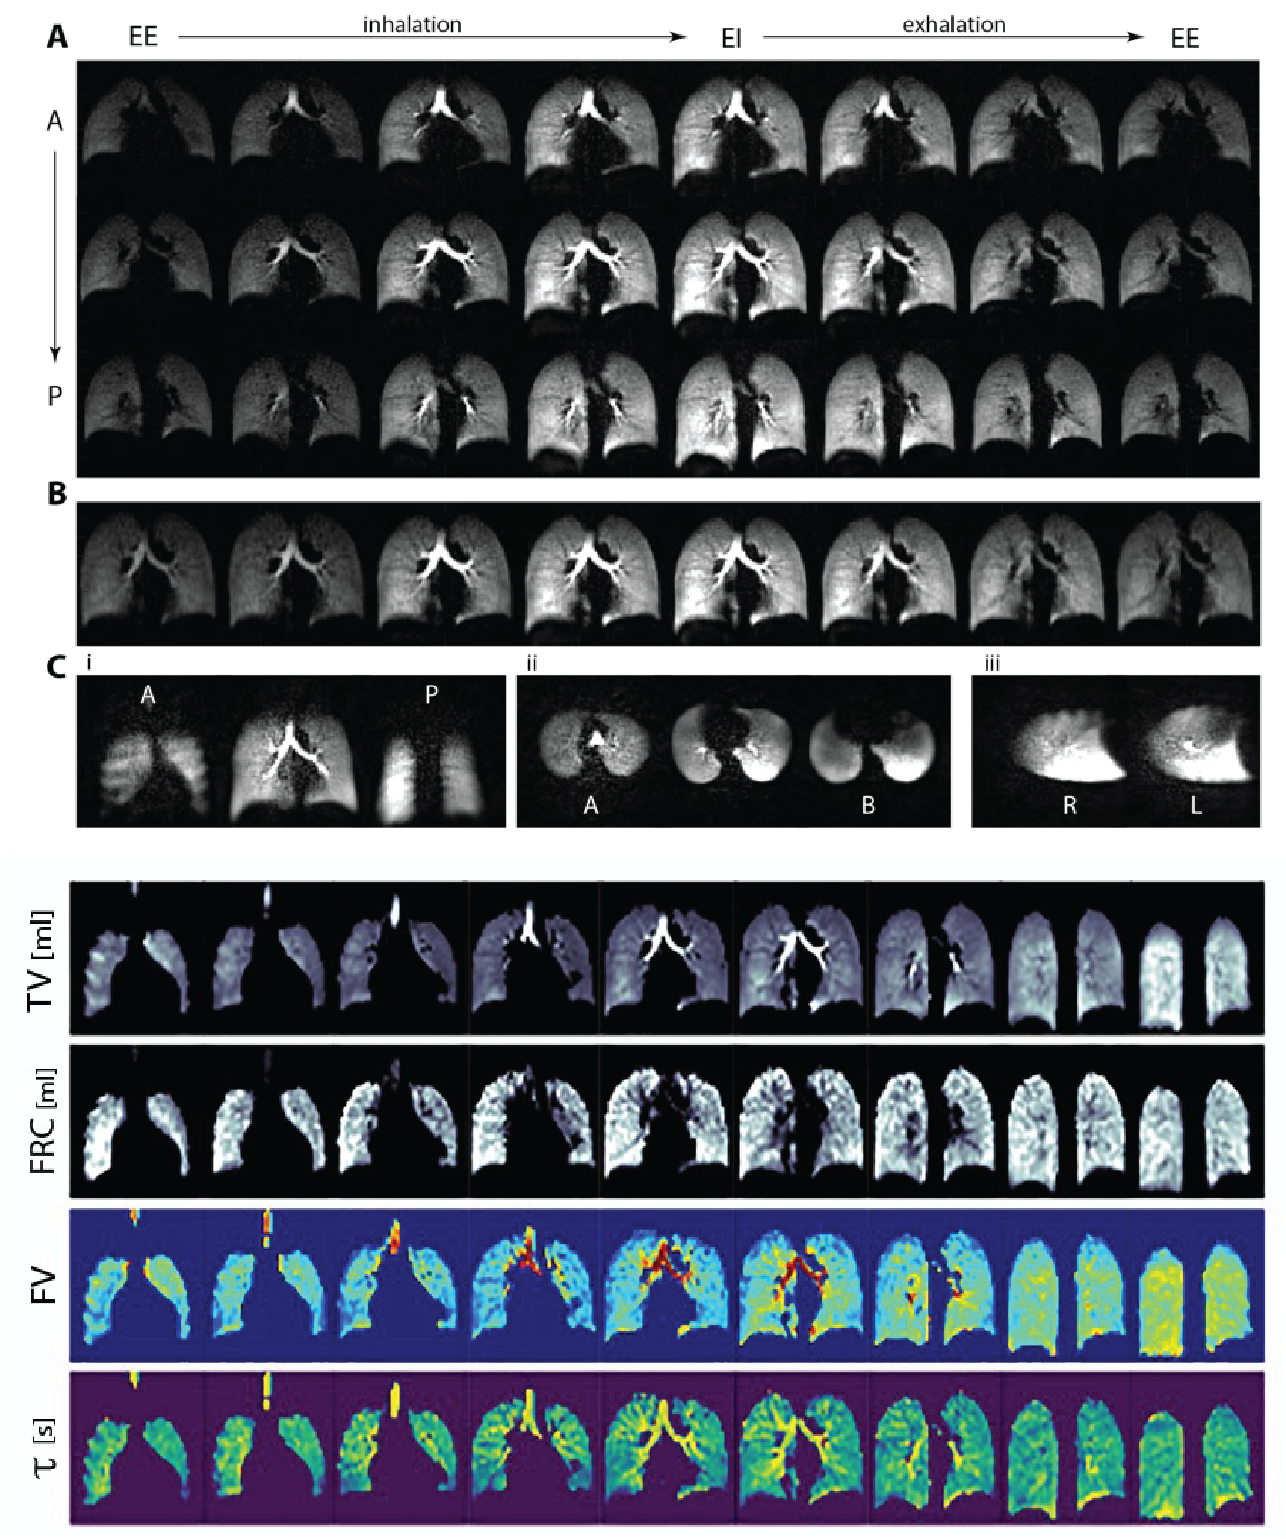
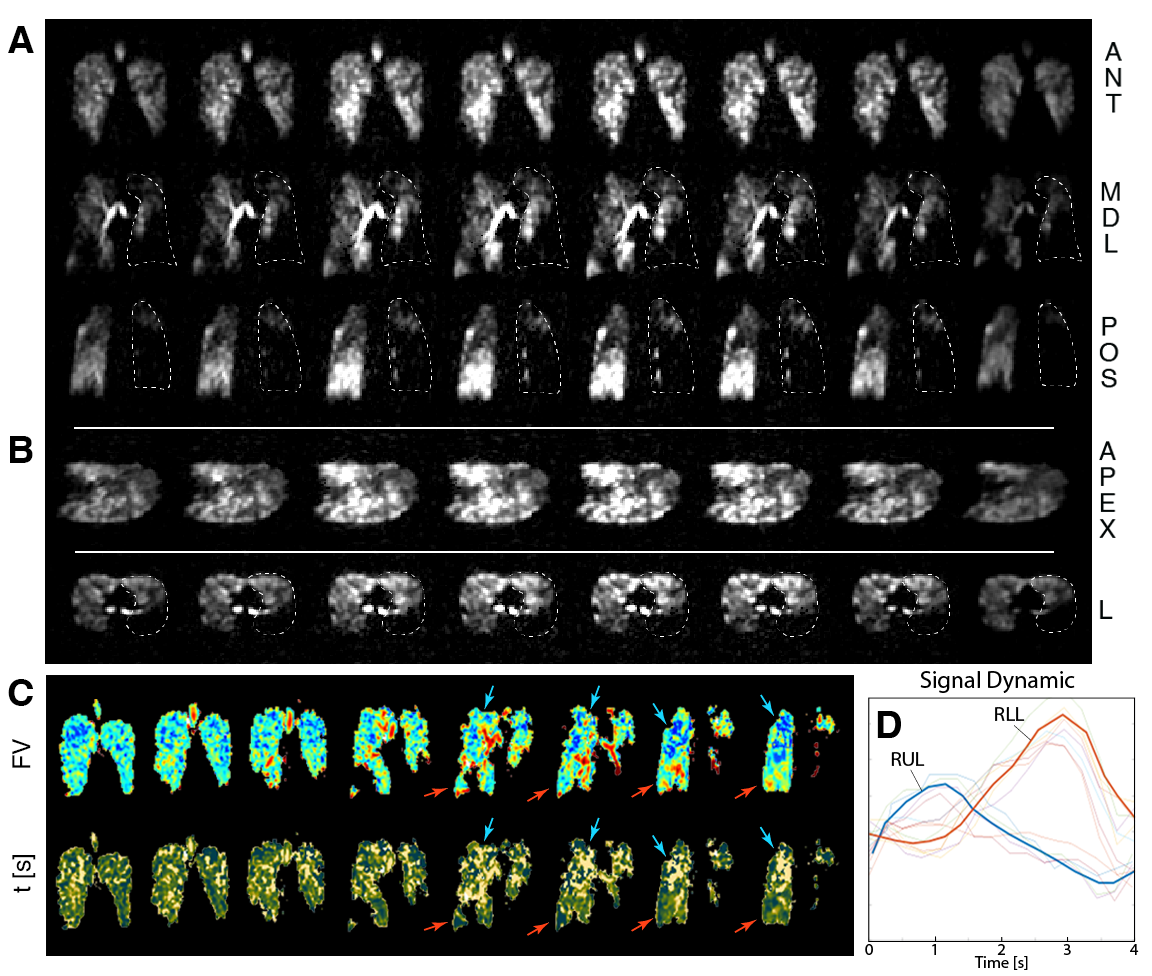
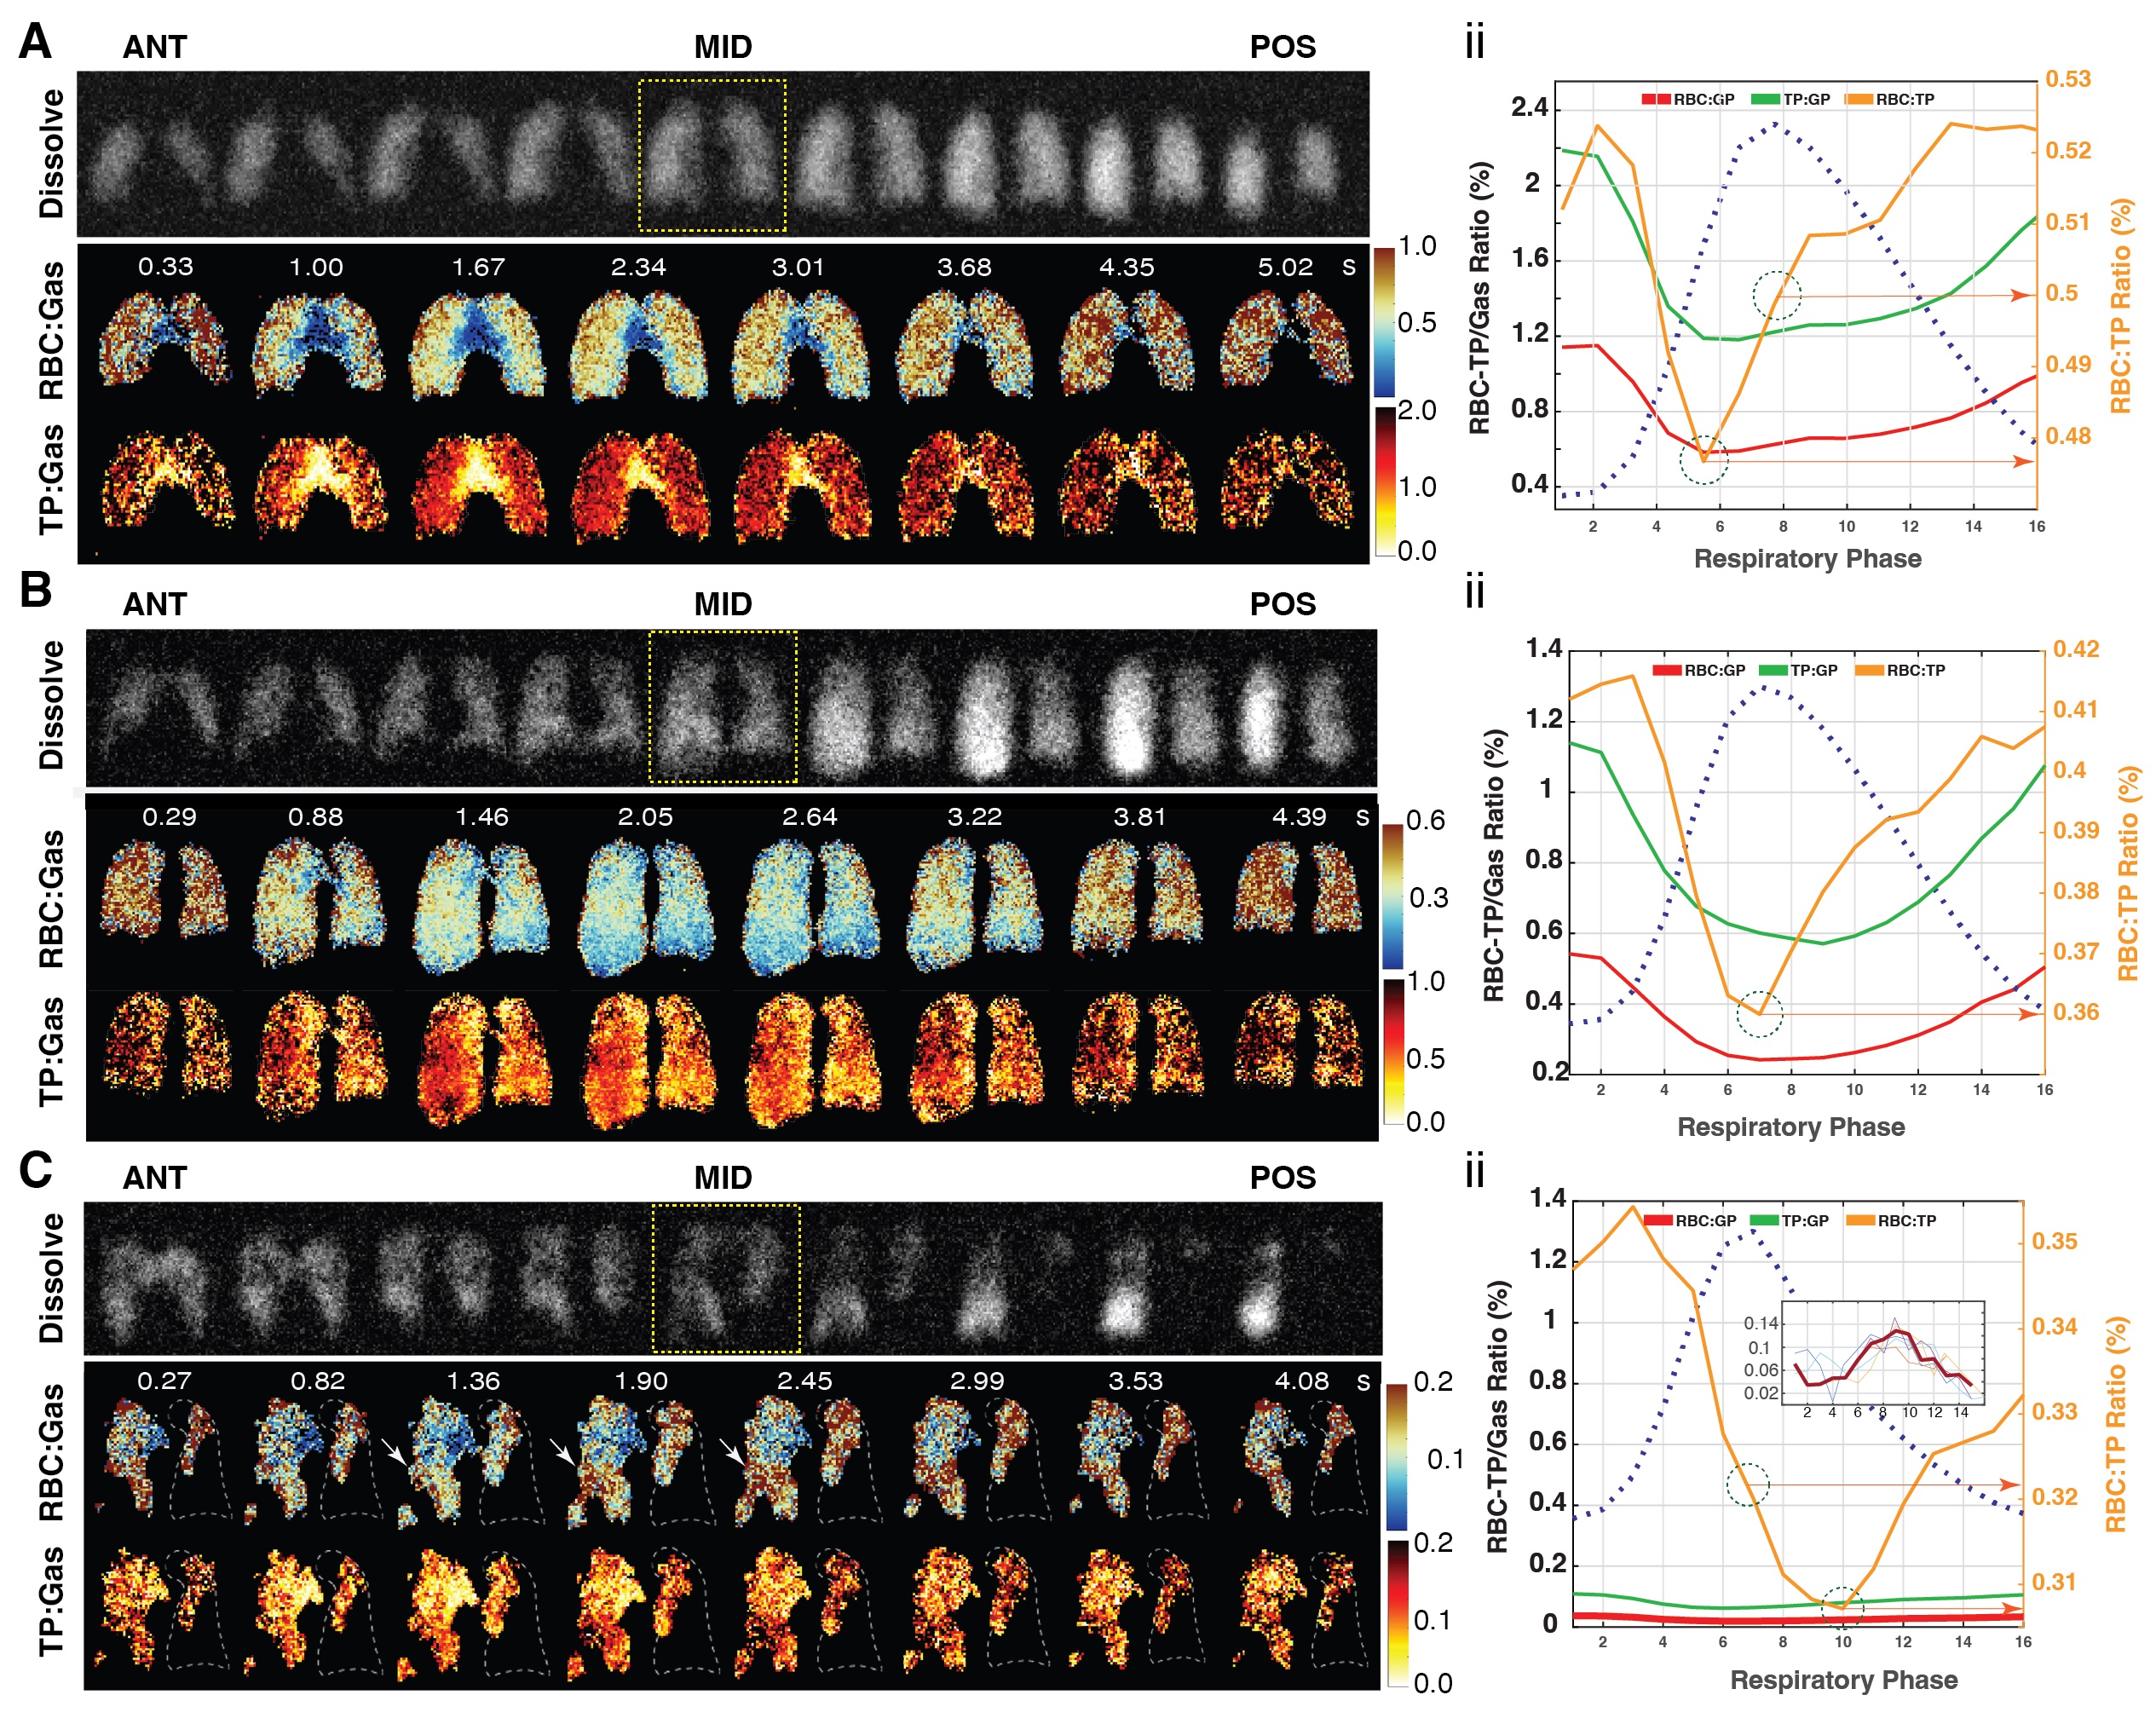
Figure 2 shows raw dynamic images for the healthy subjects. Figure 3 shows the resulting ventilation markers in the youngest healthy subject. All ventilation maps show homogenous ventilation in the plane, but TV and FV show anterior-to-posterior gravitational effects. Regional FRC and phase maps are less gravity-affected, but lobe-specific delivery time constants are visible, especially at the boundary between the right lung's upper and middle lobes, indicated by fissure lines (white arrows) marking gas arrival time differences.Figure 4A displays reconstructed images from a COPD subject (FEV1/FVC = 54%, FEV1 = 48.3% predicted, RV/TLC = 137.7%, DLCO = 37.8% predicted). FV and τ maps are presented in Figure 4C for the same subject. The phase map (τ) shows that the RUL and RLL out of sync during the breathing cycle: as the RUL fills, the RLL remains unventilated; as gas starts exiting the upper lobe, the lower lobe begins filling (further illustrated in Figure 4D's whole-lung signal dynamic curves). Gas mixing efficiency differs notably between the two lobes: the RUL shows lower values, while those in the RLL are slightly higher than usual. Imaging FRC could also identify regions with air trapping.Figure 5 shows results of 4D dynamic gas-dissolve imaging for three representative subjects. In each panel, the top row (gray colormap) displays the total dissolved phase image at the end-inhale, showing the homogenous distribution of the spin density maps (in each slice) in the healthy subject and the gravitational gradients (increasing from anterior-to-posterior) due to pulmonary vascular pressures. Both iso-gravitational homogeneity and gravitational gradients are altered in the smoker subject, and particularly the COPD patient. In each panel, the next two rows show the 4D dynamic coronal image results of separating the two peaks and normalizing them to the gas signal. An overall reduction in RBC and TP signal levels is evident between the healthy subjects vs. the smoker and COPD patient throughout the breathing cycle. Reduced RBC:Gas signal at higher lung volumes is explained by increased signal in the alveoli as well as a reduction of blood in the inter-alveolar space during inspiration (although there is more blood in the extra-alveolar space during inspiration, HP MRI is more sensitive to the site of gas exchange where expanded alveoli encroach on alveolar vessels, pushing the blood to the extra-alveolar space). This pattern is reversed in the COPD patient’s middle slice, however (white arrows and insert; note that the posterior RUL with the highest signal, the ratios for which are not shown here, resembles the same dynamic in the healthy subjects, which is also reflected in the whole-lung measures). These never-before-reported regional alterations throughout the breathing cycle are of particular interest in understanding COPD pathophysiology.Conclusion
The COPD patients displayed noticeable functional disparities: uneven ventilation was evident in two, with one lobe filling while the other emptied. Additionally, our novel imaging strategy successfully captured the sequential filling and emptying of regions, deepening our understanding of ventilation in COPD patients. The dissolved markers revealed a striking shift in the RBC trend in COPD patients, previously unreported in such a dynamic fashion.Acknowledgements
No acknowledgement found.References
1- ISMRM 2023 (5102): Repeatability of Hyperpolarized Xenon-129 4D ImagingFigures