0227
Measuring lipid turnover in human subjects using 2H magnetic resonance and heavy water loading1Sir Peter Mansfield Imaging Centre, University of Nottingham, Nottingham, United Kingdom, 2School of Physics and Astronomy, University of Nottingham, Nottingham, United Kingdom, 3Radiological Sciences, Mental Health and Clinical Neuroscience, School of Medicine, University of Nottingham, Nottingham, United Kingdom, 4NIHR Nottingham Biomedical Research Centre/Nottingham Clinical Research Facilities, Queen's Medical Centre, Nottingham, United Kingdom, 5MRC-Versus Arthritis Centre for Muscoskeletal Ageing Research, University of Nottingham, Nottingham, United Kingdom, 6School of Life Sciences, University of Nottingham, Nottingham, United Kingdom
Synopsis
Keywords: Deuterium, Deuterium, Spectroscopy
Motivation: During heavy water loading, deuterium is incorporated into newly synthesised lipids; measurement of deuterium content thus provides a measure of lipid turnover. Currently this involves in vitro analysis of biopsy samples.
Goal(s): We investigated whether deuterium magnetic resonance can detect increased deuteration of subcutaneous fat following heavy water loading.
Approach: Deuterium signals from calf and abdomen from three participants were monitored during/after a 28-day period of loading with heavy water to ~100x natural abundance.
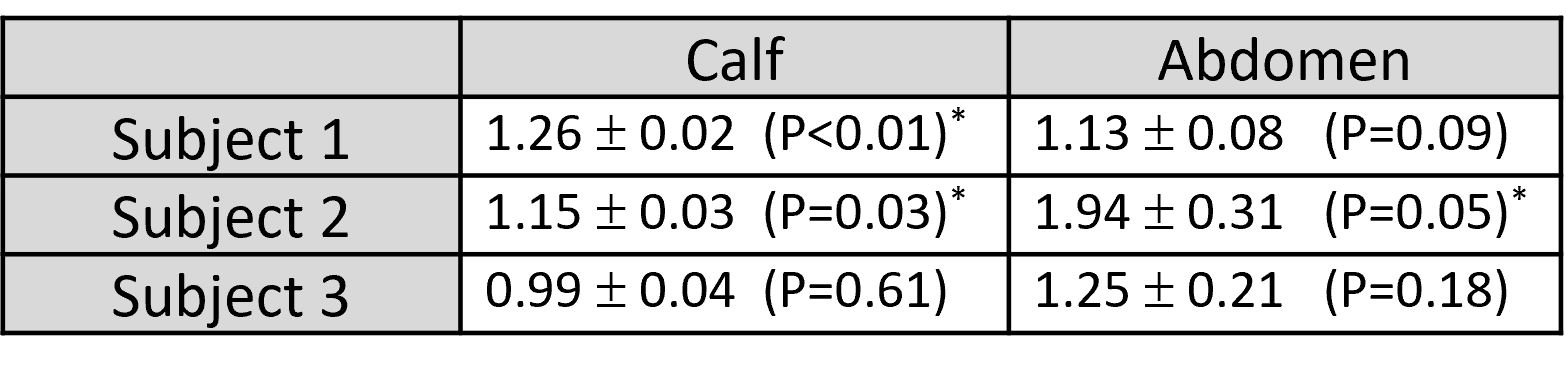
Results: Fat signal was increased relative to natural abundance in 5 of the 6 measurements (average at times > 50 days), reaching statistical significance (P<0.05) in three measurements.
Impact: A non-invasive technique for monitoring lipid turnover anywhere in the human body would be a powerful tool, allowing investigation of fat metabolism in health and disease. Deuterium magnetic resonance during heavy water loading could form this tool.
Introduction
Heavy water (D2O) loading over long periods has become a valuable technique for assessing fat turnover1-3 and hepatic lipogenesis4-5. It involves measuring the incorporation of deuterium (2H) from heavy water into the glycerol moiety and fatty acid chains of triglycerides during lipid formation. The current approach requires invasive tissue sampling, followed by in vitro analysis using mass spectrometry2,4: the need for biopsy restricts the range of tissue sites that can be sampled (e.g., making it difficult to sample visceral fat) and causes patient discomfort. Previous work has shown that 2H MR signals can be measured in fat in vivo5,6. Here we evaluate whether 2H MR in conjunction with D2O loading could be used for non-invasive monitoring of lipid turnover in human subjects.Methods
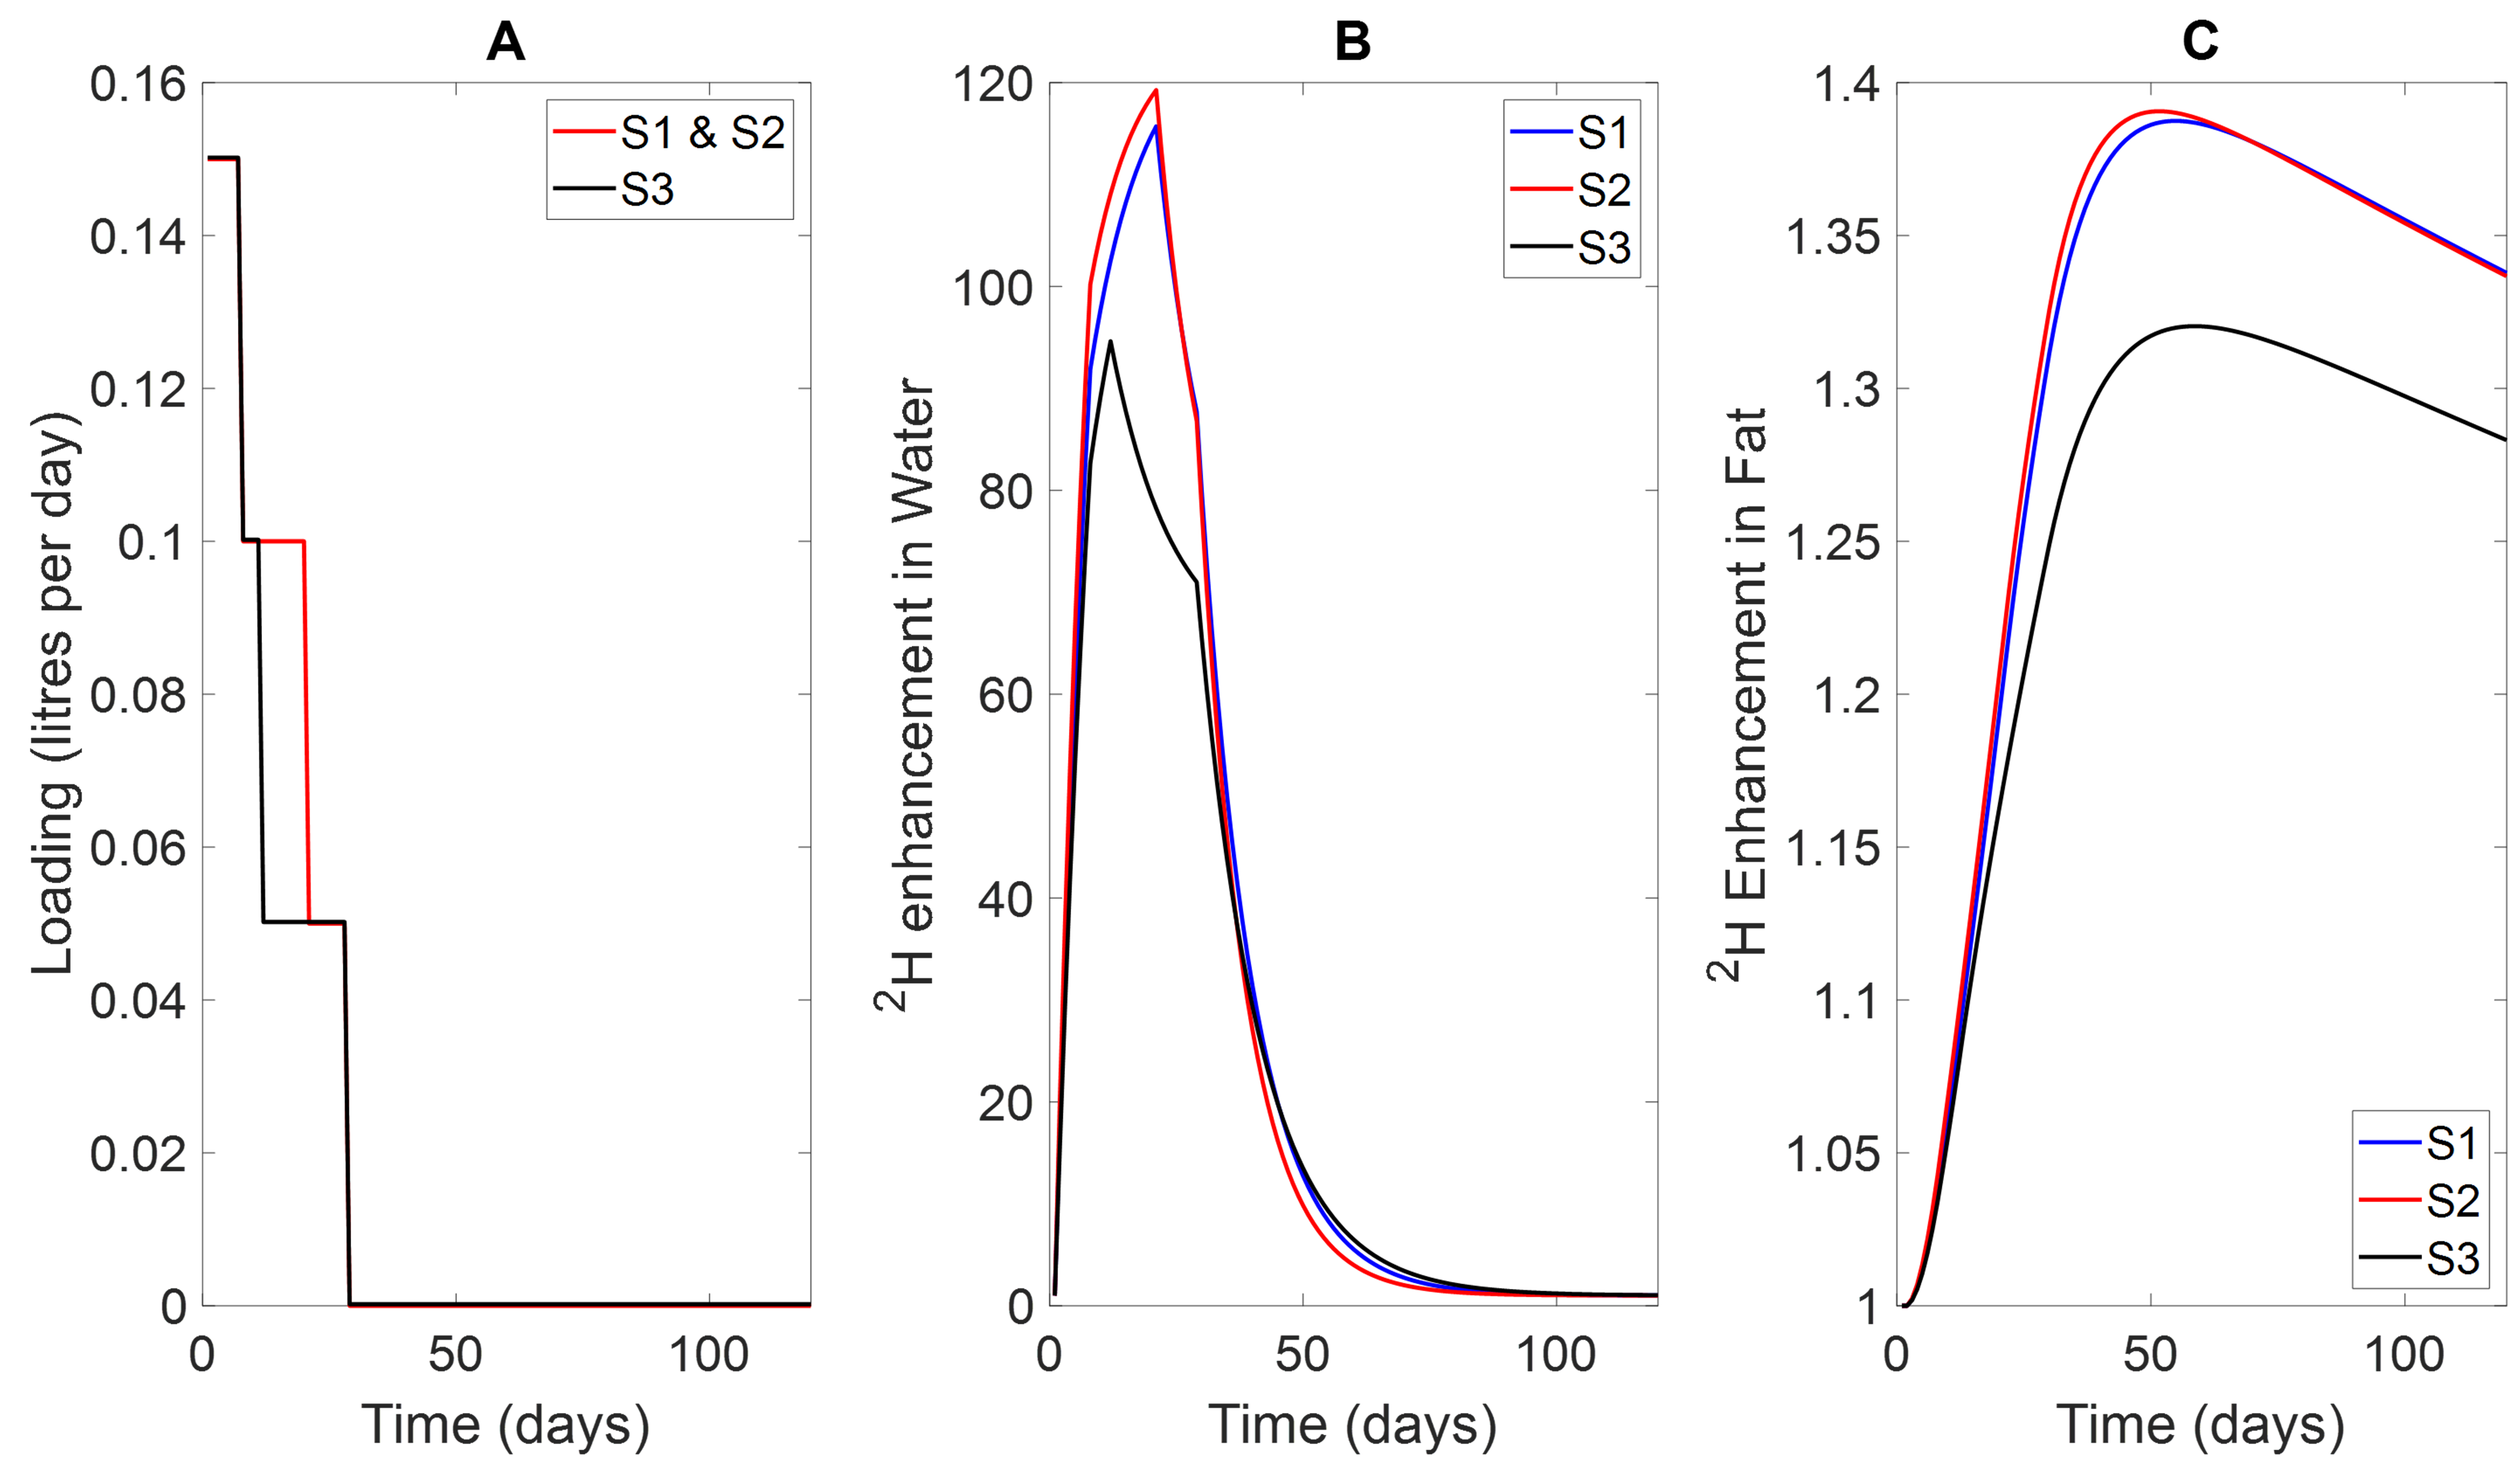
2H signals were measured from the calf and abdomen in three healthy participants who underwent 28-days of heavy water loading. Figure 1 shows the loading schedules that participants followed, plus estimates of the expected changes in water and fat signals over 120 days. The water signal increases to approximately 100x natural abundance (NA) in the loading period and then decreases after loading ceases, halving in amplitude every ~6 days. The fat signal rises more slowly to a maximum of 1.3-1.4 x NA and then slowly decreases.Scans were performed on a 3T scanner (Philips Achieva) equipped with 2H surface coils (5 cm-diameter for calf; 12 cm for abdomen). Measurements were made before loading, to characterise NA signals, and then every ~14 days during/after loading for a further 8 sessions. Anatomical landmarks were used to position the coils over the same region for each scan (under the calf/adjacent to the right abdomen near the liver). 1H gradient echo images were used for planning 3D-2H-CSI measurements (parameters for calf/abdomen FOV:150x150x200/140x140x200mm3; voxel size:15x15x20/20x20x20mm3; BW:2000Hz, TE:1.7ms; Samples:64, Averages:36/48, Tacq:520/420s). A TR of 50 or 70ms was used to maximise the signal-to-noise ratio of the signal from fat whose T1 is ~60ms (c.f. ~200ms for muscle water). Before loading started, subjects were scanned multiple times with inter-scan repositioning to allow estimation of fractional signal variation due to positioning errors.
OXSA-AMARES7 was used to fit each voxel to a model incorporating water and fat peaks; in the calf, the water signal was modelled as a doublet (due to quadrupolar splitting)8. To produce single measures of signal enhancement with reduced sensitivity to FOV-positioning, we averaged fat and water signal amplitudes over regions-of-interest (ROI=3x3x3/3x5x3 voxels for the calf/abdomen) sited relative to the voxel with maximum water signal (i.e., over the centre of the surface coil).
Results
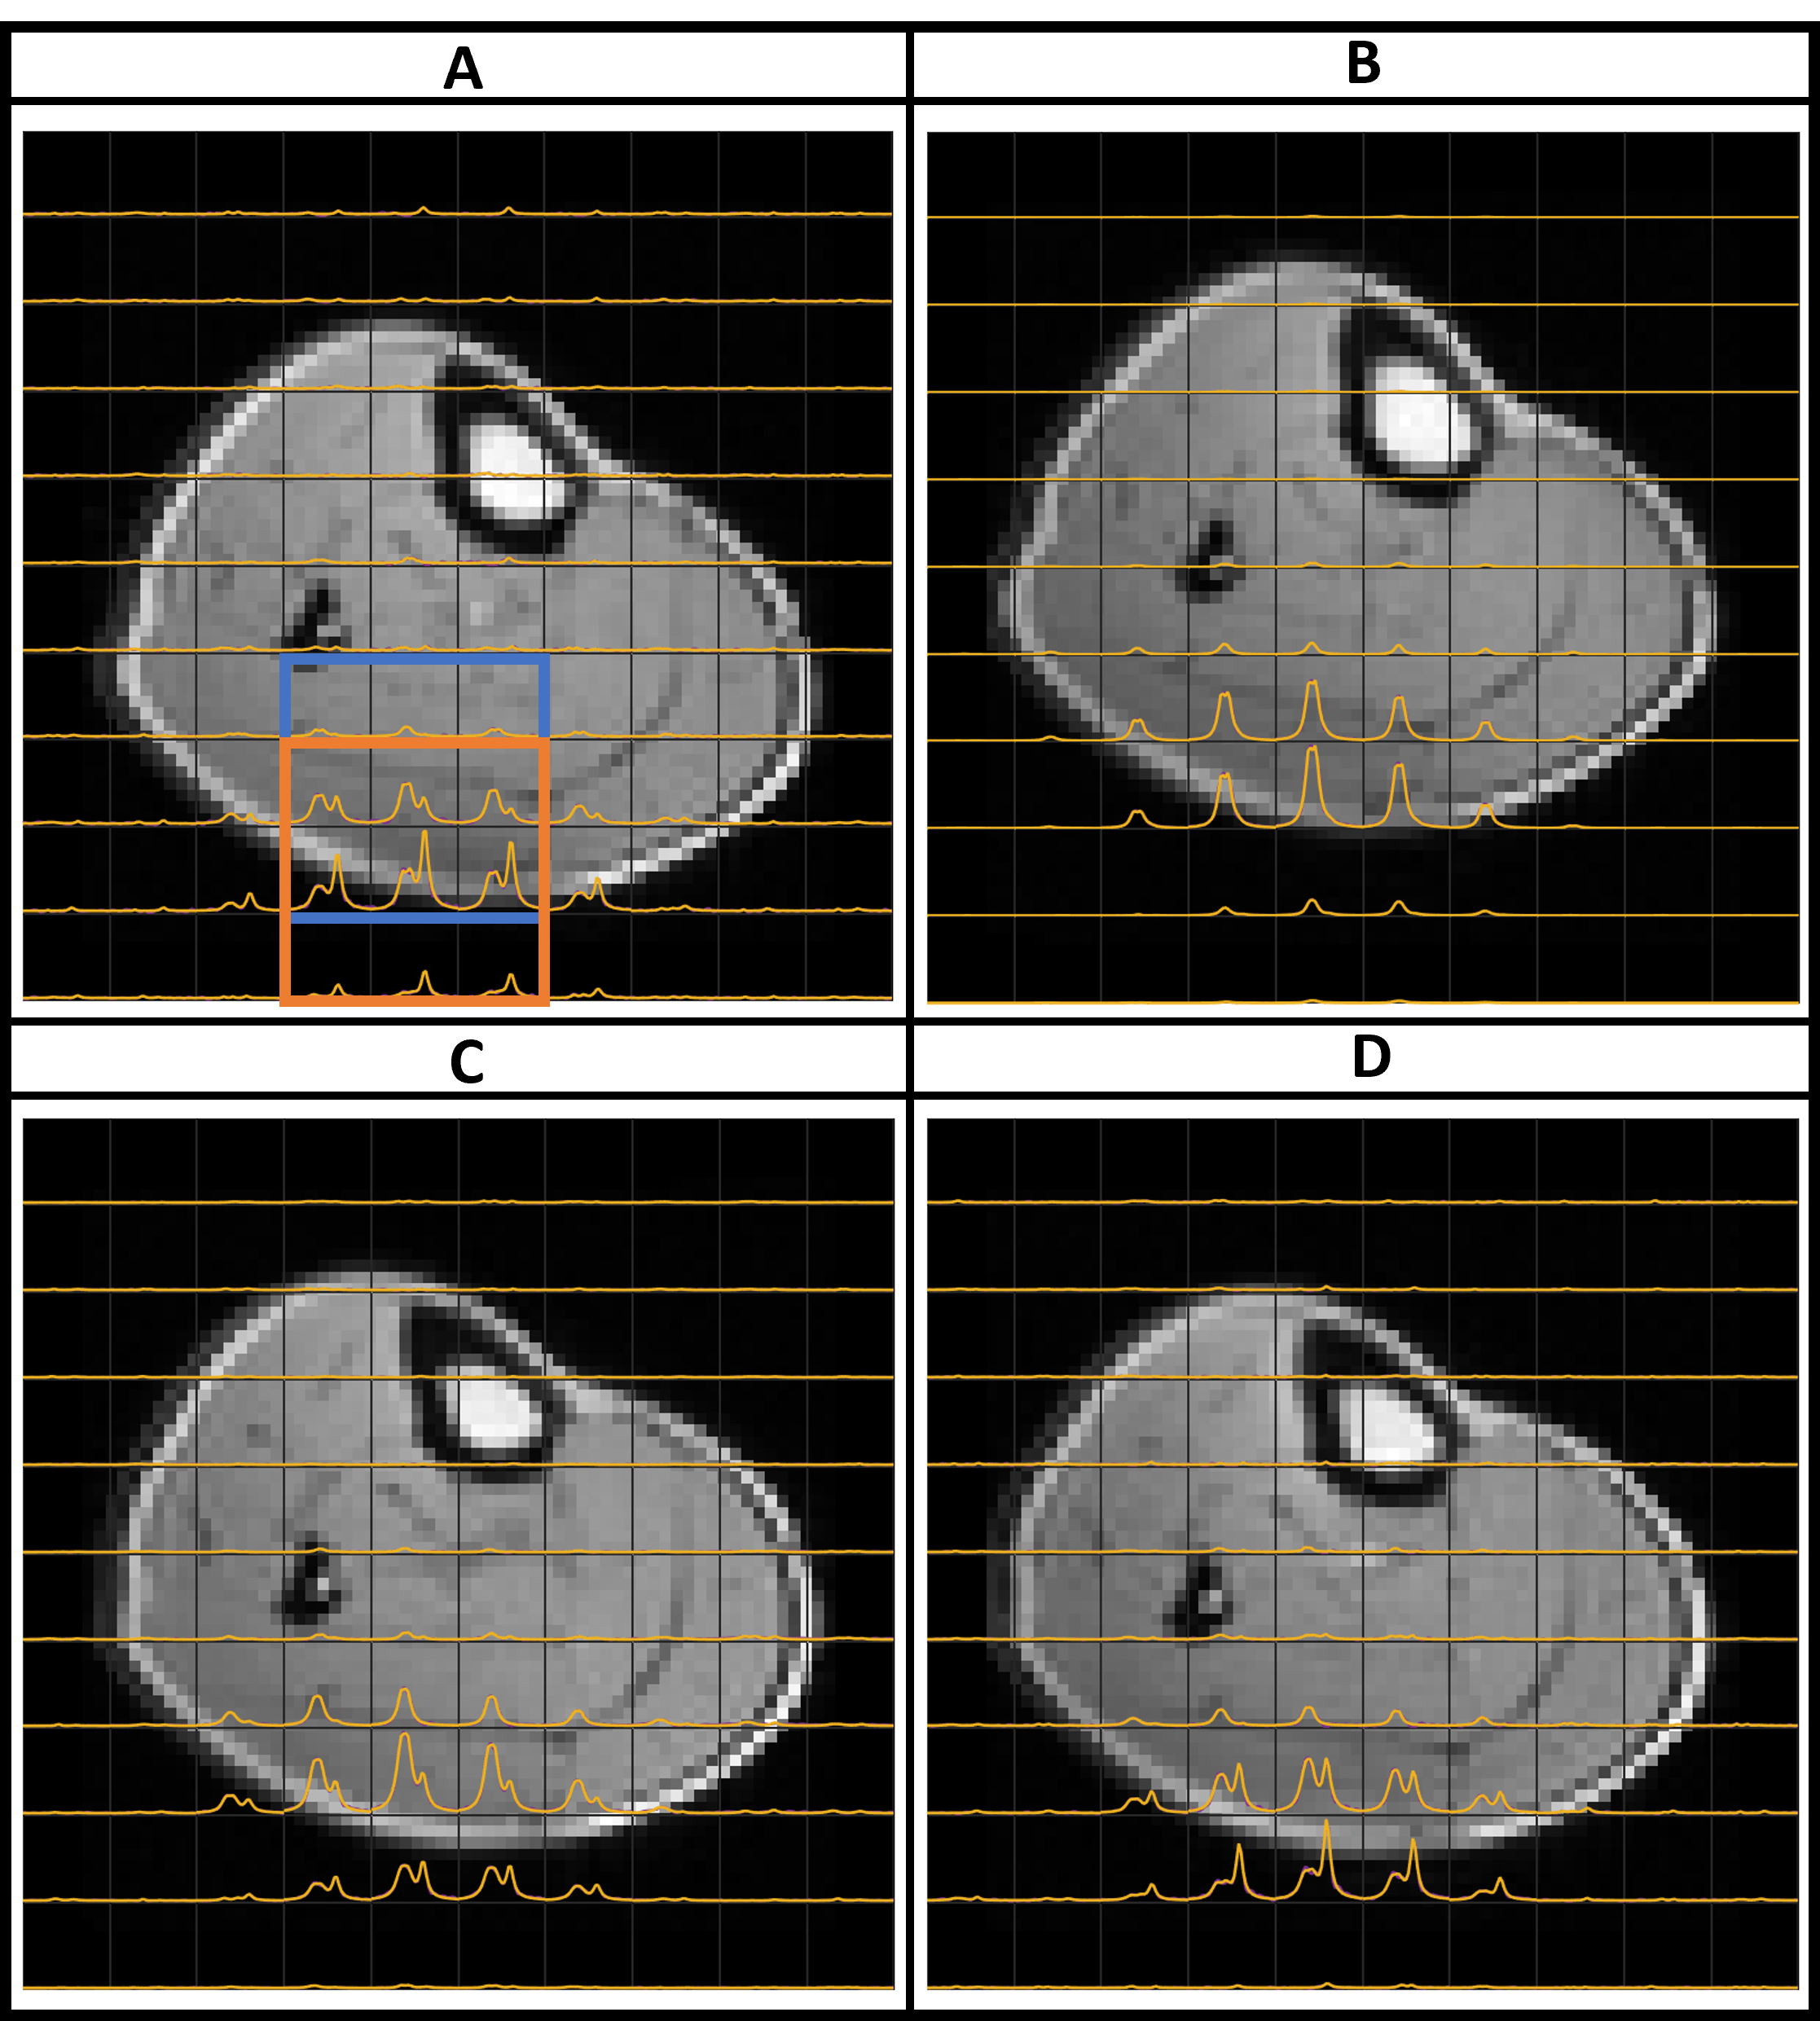
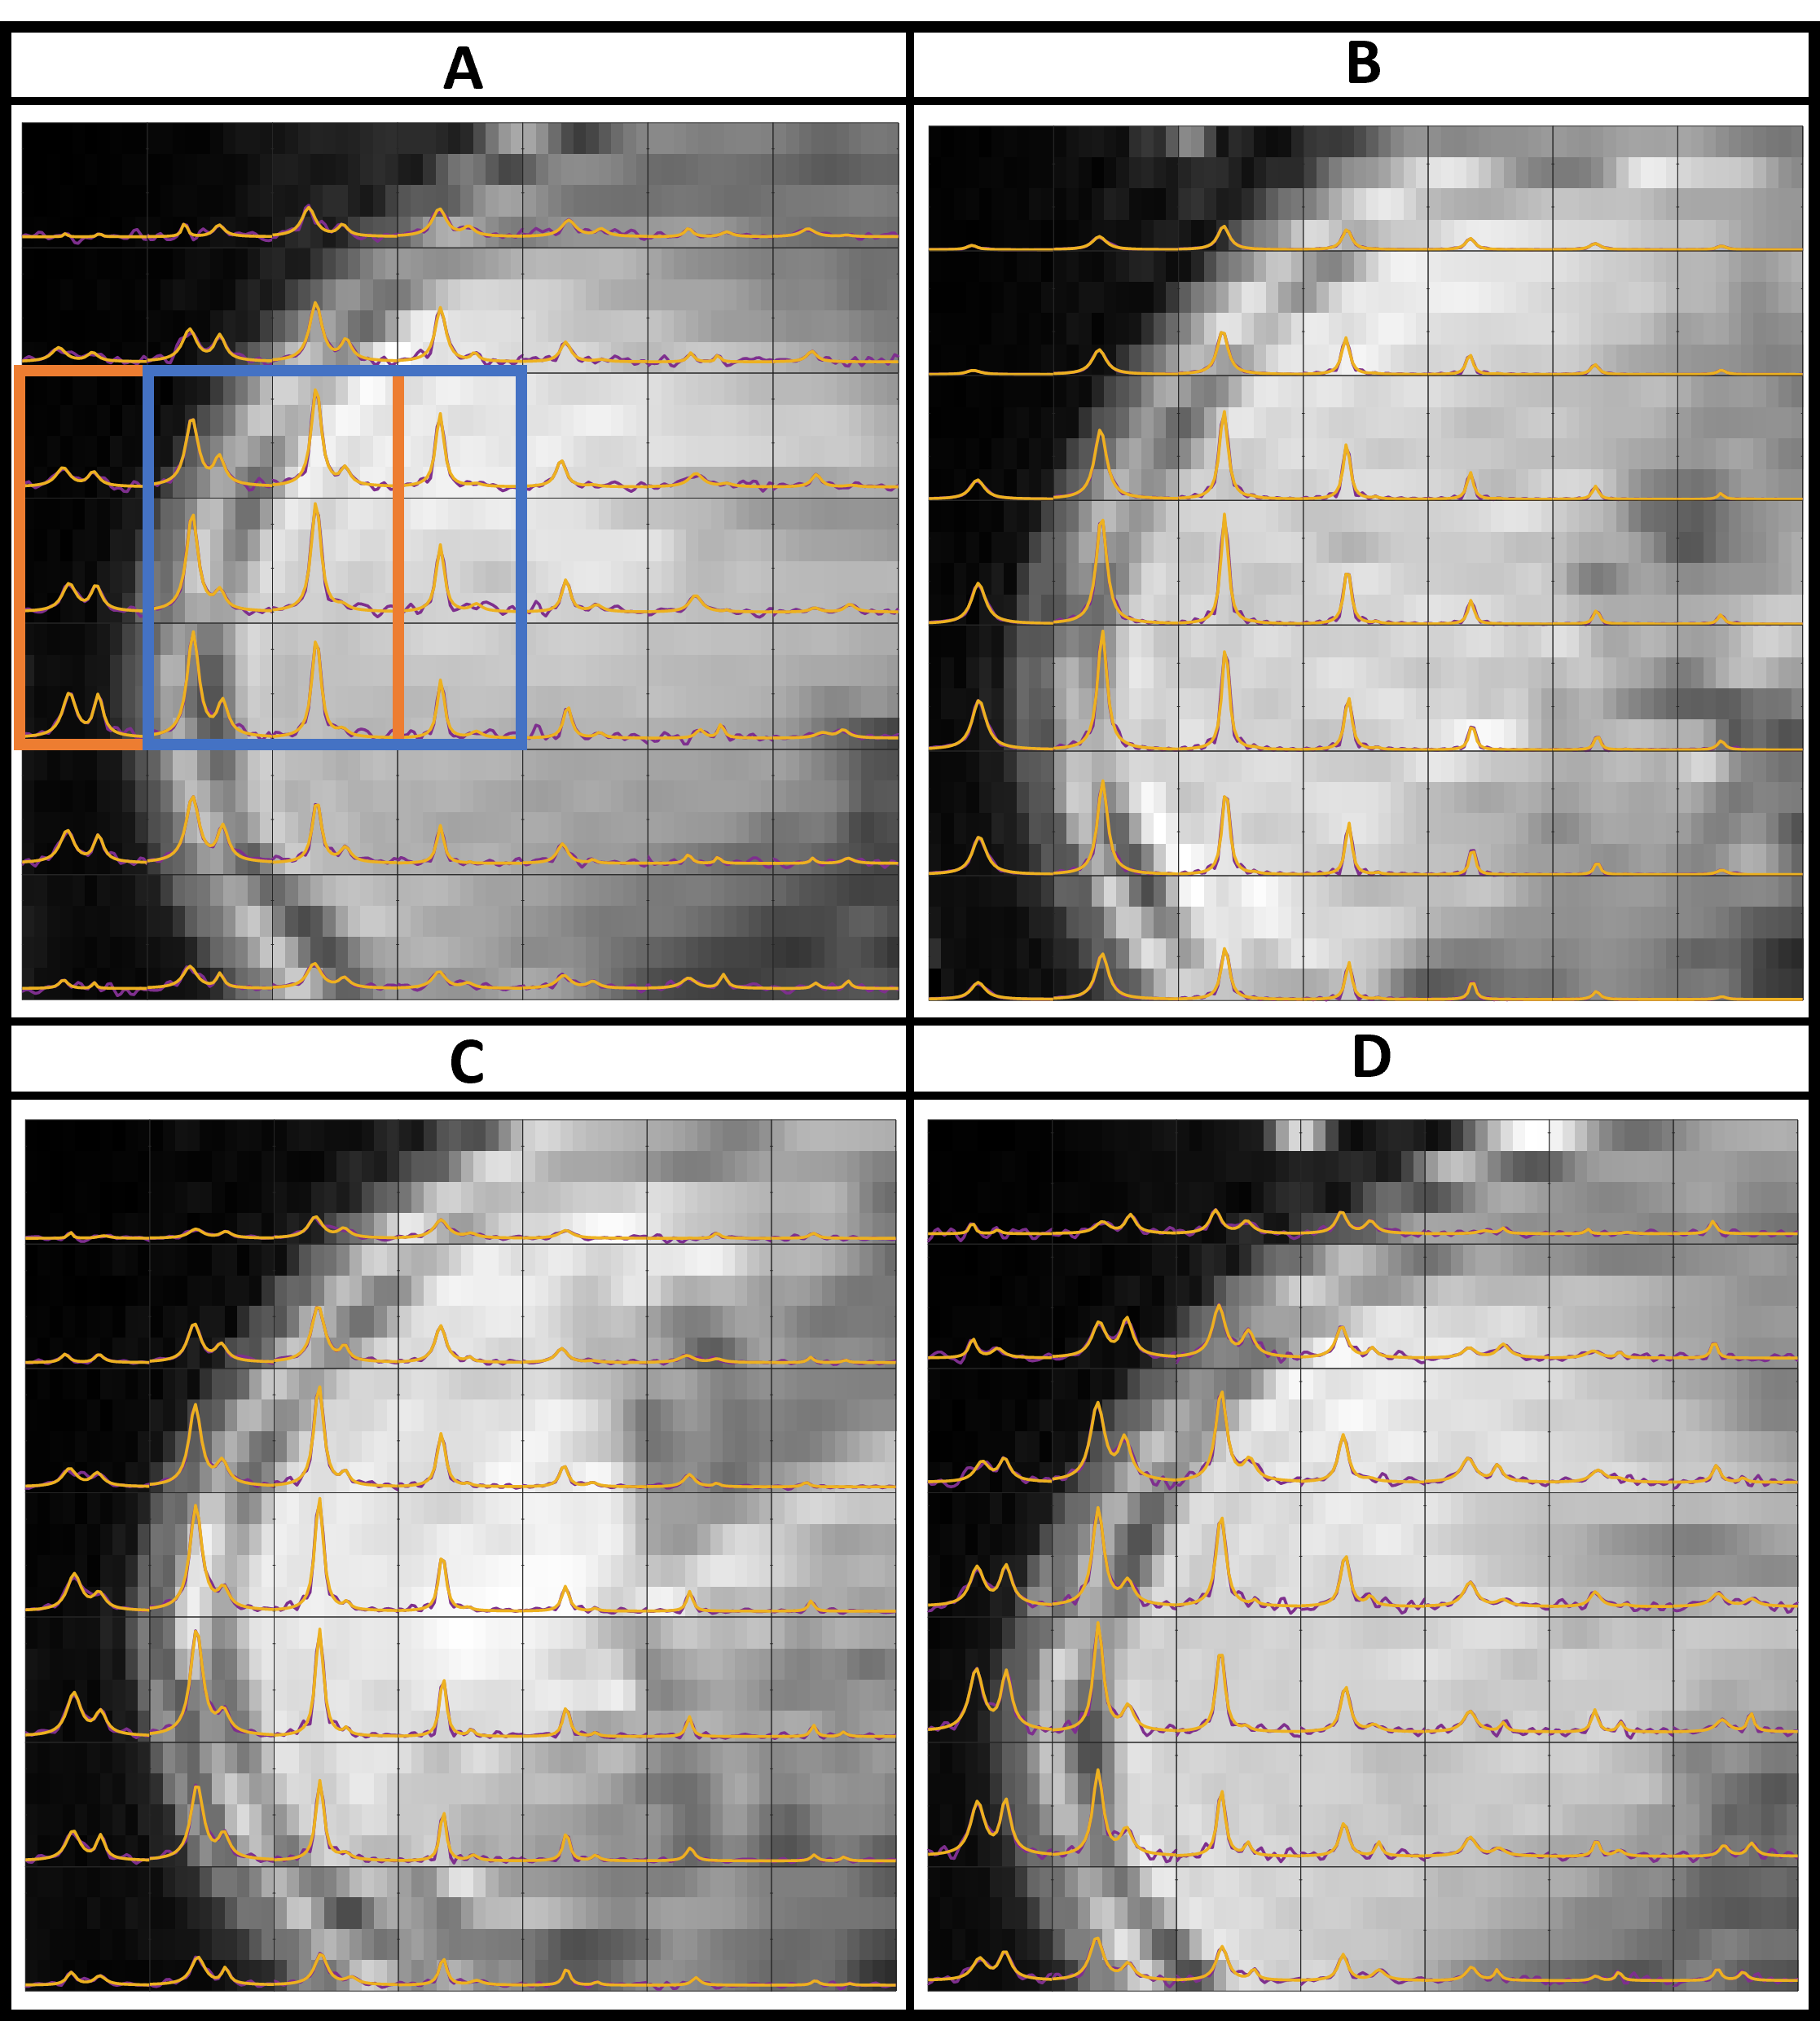
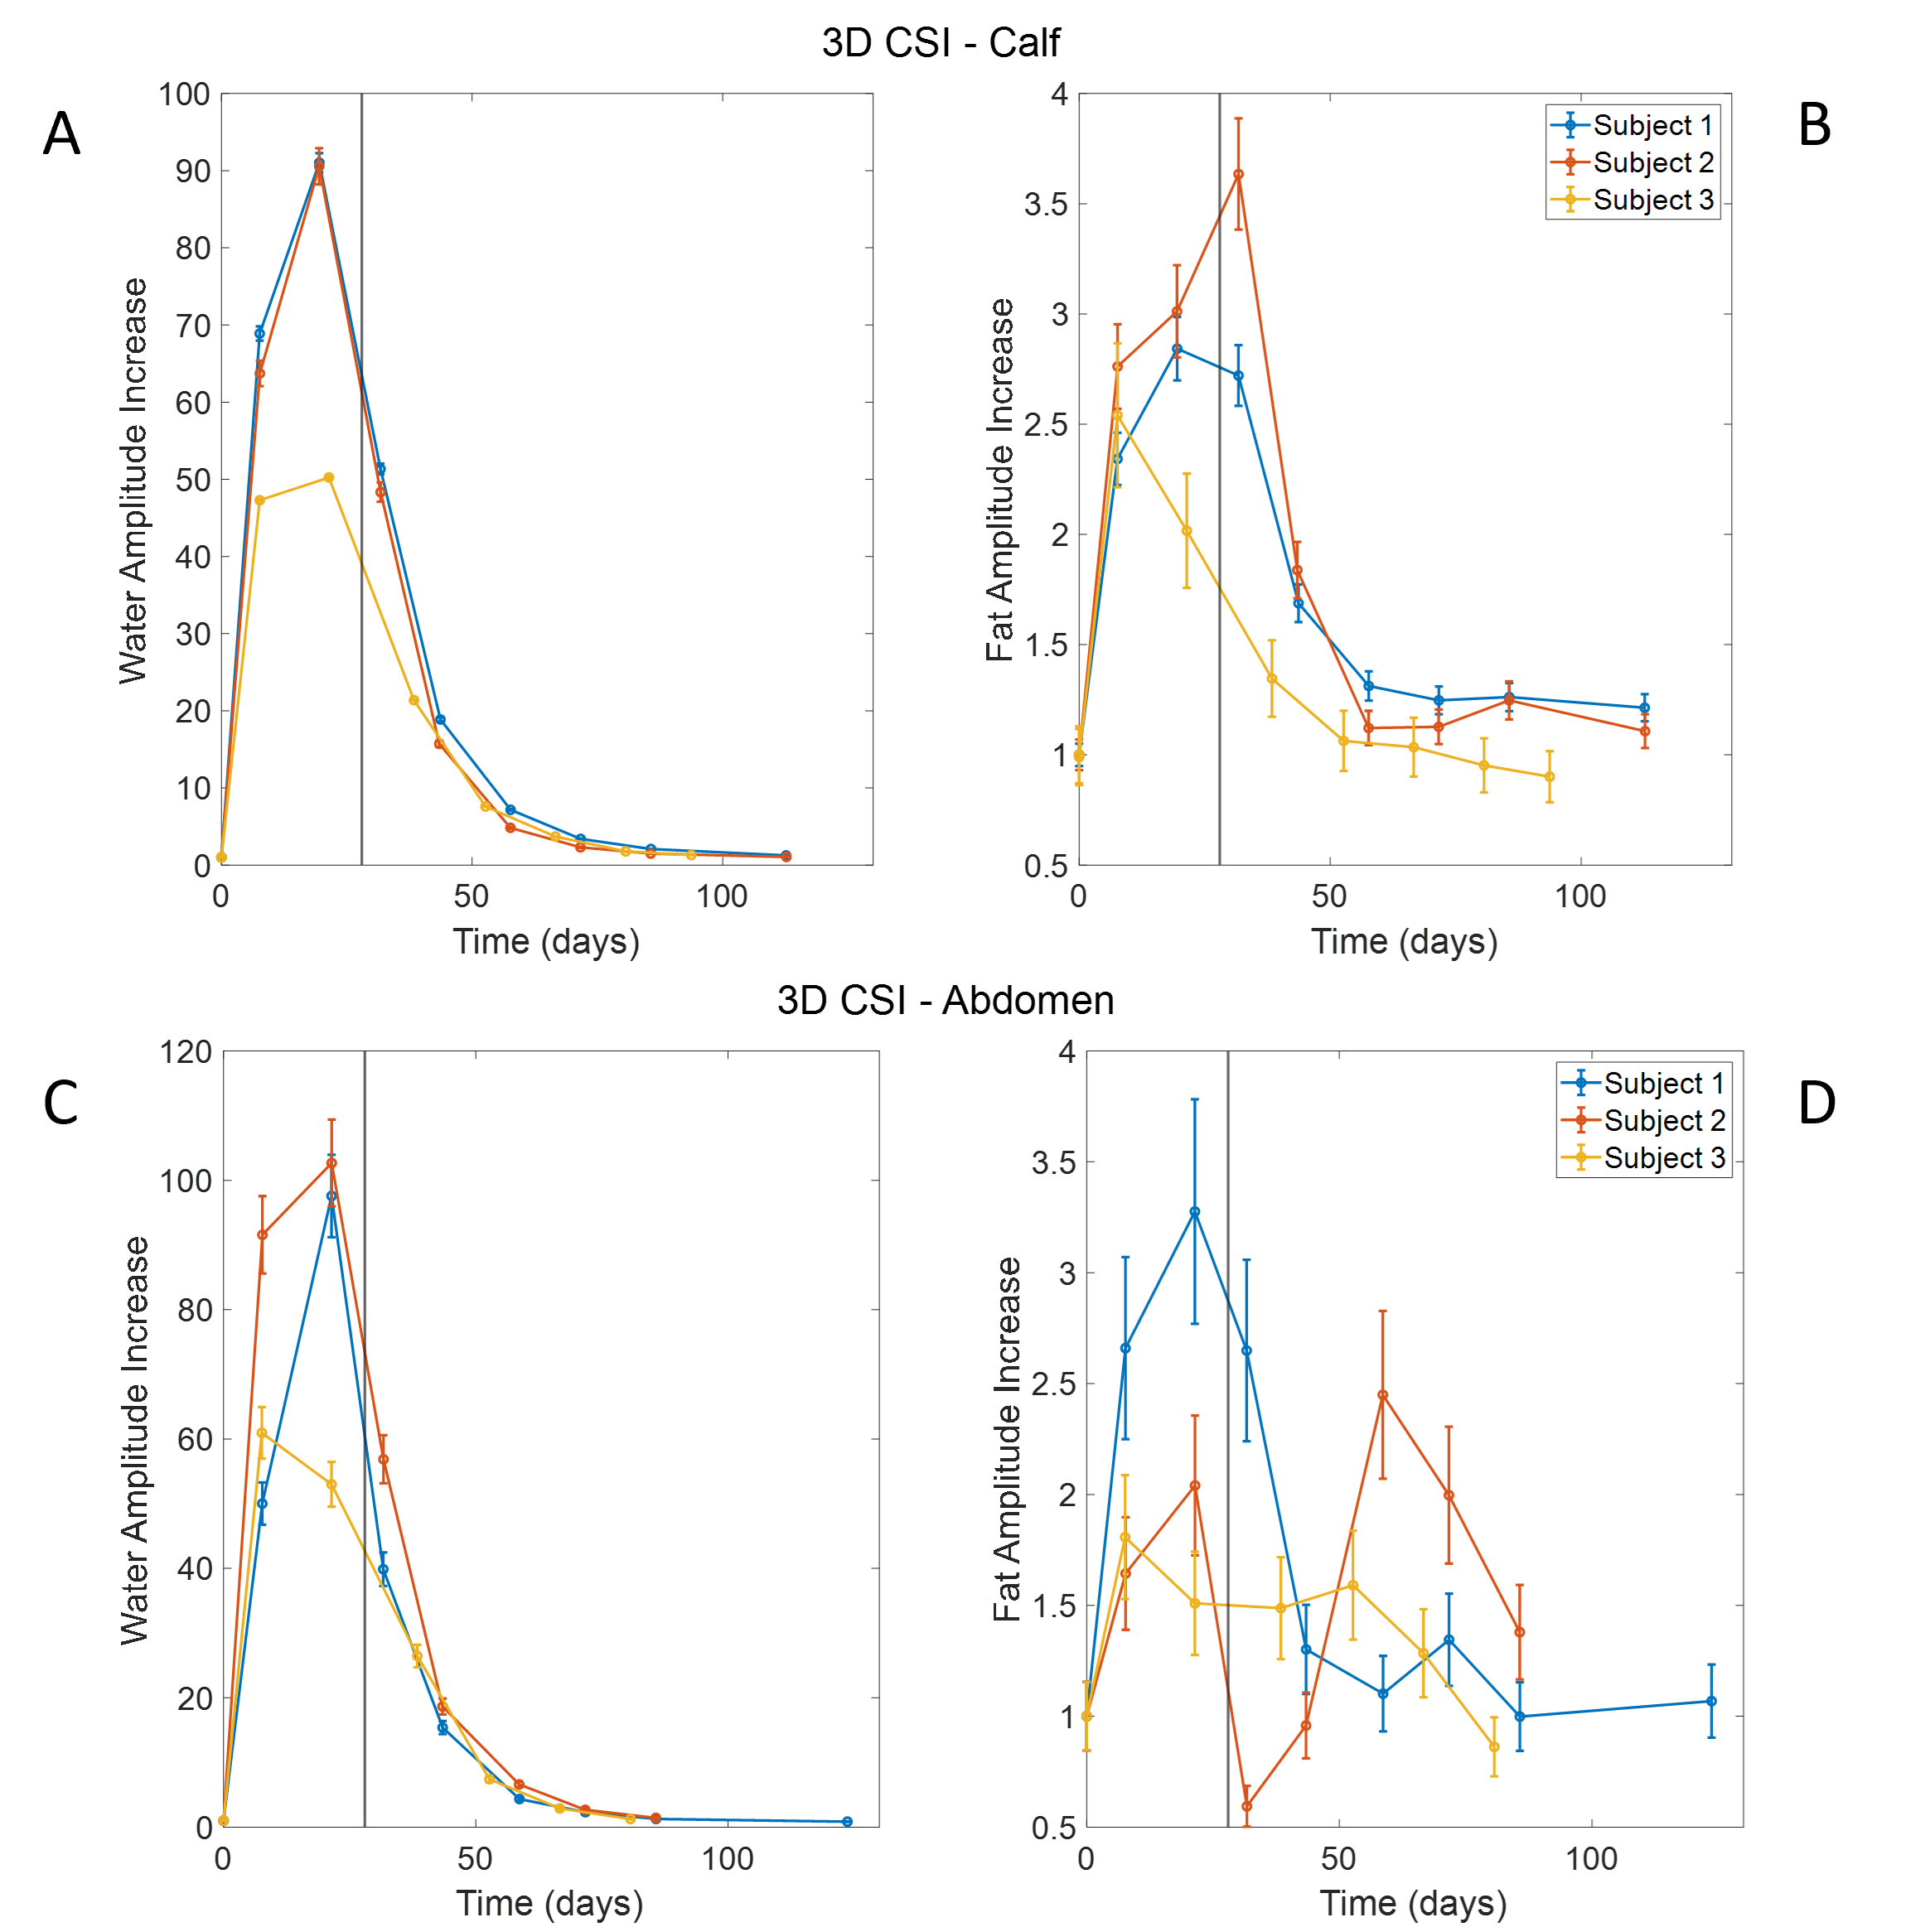
Figures 2 and 3 show 3D-CSI-data acquired from Subject 1 (single transverse/sagittal slice from calf/abdomen, overlaid on 1H GE images) at four time-points. A fat peak is seen in superficial voxels spanning subcutaneous fat close to the surface coil in the NA images (Figs.2&3A), along with a water peak, which appears over a wider spatial extent and is broadened by quadrupolar splitting in calf muscle (Fig.2). Superficial fat signals are also evident post-loading (Figs.2&3C,D), but during loading are swamped by the ~100x larger water signal (Figs.2&3B). A robust fit to the fat signal could only be achieved at times >50 days, when the water signal was <10xNA (indicated by significantly elevated Cramer-Rao lower bound values at t<50 days). Figure 4 shows the temporal variation of the ROI-averaged fat and water signals. As predicted from simulations (Fig. 1B) an increase in water signal to nearly x100 NA is evident, with a lower enhancement in Subject 3 who loaded less (Fig. 1A). Although the fat signal shows significant early enhancement (t < 50 days) this tracks the water enhancement and is likely due to poor spectral fitting. Based on the predicted long-term elevation of fat signal (Fig. 1C), we focused on the average fat signal enhancement at times > 50 days where fitting was robust (Figure 5).Discussion
Fat signal was increased relative to NA in 5 of the 6 measurements and the increase reached statistical significance (P<0.05) in three measurements (Figure 5). These results provide encouraging evidence that 2H MR can be used to detect the increased deuteration of subcutaneous fat resulting from lipid turn-over during long-term heavy water loading. The main experimental challenges were in quantifying fat signals in the presence of large water signals and in reproducibly positioning the surface RF coils in repeated experiments. In future work higher field could be used to provide better spectral separation of fat and water signals and 3D-printed, individualised coil holders would allow more reproducible coil positioning.Acknowledgements
This research was funded by the NIHR Nottingham Biomedical Research Centre. DJC’s Ph.D. studies are funded by the Precision Imaging Beacon at the University of Nottingham.References
- Turner, S.M.,et al. , Measurement of TG synthesis and turnover in vivo by (2HO)-O-2 incorporation into the glycerol moiety and application of MIDA. American Journal of Physiology-Endocrinology and Metabolism, 2003. 285(4): p. E790-E803.
- Strawford, A., et al. Adipose tissue triglyceride turnover, de novo lipogenesis, and cell proliferation in humans measured with (H2O)-H-2. American Journal of Physiology-Endocrinology and Metabolism, 2004. 286(4): p. E577-E588.
- White, U. and E. Ravussin, Dynamics of adipose tissue turnover in human metabolic health and disease. Diabetologia, 2019. 62(1): p. 17-23.
- Belew, G.D. and J.G. Jones, De novo lipogenesis in non-alcoholic fatty liver disease: Quantification with stable isotope tracers. European Journal of Clinical Investigation. 2022. 52(3):e13733.
- Delgado,et al., Sources of hepatic triglyceride accumulation during high-fat feeding in the healthy rat. NMR in Biomedicine, 2009. 22(3): p. 310-317.
- Damion, R.,et al. , Natural abundance deuterium MRS of the human calf and T1 measurements with a surface coil at 3 T. In Proceedings of the 29th Annual Meeting of ISMRM, 2021, 3836.
- Purvis, L. A. B., et al. OXSA: An open-source magnetic resonance spectroscopy analysis toolbox in MATLAB. PLOS ONE, 2017. 12(9), e0185356.
- Gursan, A.,et al. Residual quadrupolar couplings observed in 7 Tesla deuterium MR spectra of skeletal muscle. Magnetic Resonance in Medicine, 2022. 87(3), 1165–1173. https://doi.org/10.1002/mrm.29053
Figures