0226
Optimized deuterium metabolic imaging (DMI) for quantitative analysis of lactate in intracerebral hemorrhages1Innovation Academy for Precision Measurement Science and Technology, Chinese Academy of Sciences, Wuhan, China, 2Weizmann Institute of Sciences, Rehovot, Israel, 3Clinical & Technical Support, Philips Healthcare (Beijing), Beijing, China
Synopsis
Keywords: Biology, Models, Methods, Deuterium, Deuterium metabolic imaging; Intracerebral hemorrhage; Lactate
Motivation: Lactate, as an important metabolism product after intracerebral hemorrhage (ICH), plays a crucial role in the pathophysiology and prognosis. Deuterium metabolic imaging (DMI), as a potentially transformative technique, can localize abnormal metabolism associated with lactate.
Goal(s): Optimize deuterium coils and sequences to improve the signal-to-noise ratio of DMI, and quantitatively analyze lactate changes after ICH with optimized techniques.
Approach: Propose the active decoupling 2H/1H dual-tuned transceiver coil and CSI-bSSFP sequence for DMI and measure the dynamical lactate metabolism in three groups of rats before and after ICH.
Results: DMI can measure the lactate metabolic changes at different time points after ICH.
Impact: This study presents a non-invasive technique for monitoring the lactate metabolic changes after ICH, which holds clinical potential in determining the time of onset, treatment plan, and real-time response evaluation.
INTRODUCTION
Intracerebral hemorrhage (ICH) is the second most common stroke and a major public health problem that is associated with high mortality and long-term disability 1. The metabolic alterations after ICH play a crucial role in the pathophysiology and outcomes of the condition 2. Therefore, monitoring the change in metabolism is important for predicting secondary injury and determining the subsequent course of treatment 3. At present, the evaluation of brain metabolism in clinical assessment usually relies on invasive methods such as microdialysis. However, microdialysis cannot precisely localize the sampled molecules to specific regions within the brain affected by the ICH. As an emerging metabolic imaging method, DMI can localize abnormal metabolism associated with lactate 4. Compared to other metabolic imaging techniques such as PET, and HP-13C-MRI, DMI offers several advantages including its non-radiactive nature, ideal safety of tracers, little impact on normal metabolic processes, and relatively simple imaging techniques 5. In this work, we investigated whether DMI could observe the lactate metabolic changes at different time points after ICH. Moreover, the active decoupling 2H/1H transceiver coil and optimized CSI sequences with balanced steady-state free precession (CSI-bSSFP) are proposed to obtain a higher signal-to-noise ratio (SNR) and homogeneous excitation field.METHODS
The experimental design is shown in Fig .1. All animals were randomly divided into three groups (Control-Con, n=8; three days after ICH-ICH 3d, n=10; seven days after ICH-ICH 7d, n=8). For the ICH-3d group and ICH-7d group, stereotactic injection of collagenase was used to induce ICH. Half of the rats in every group underwent deuterium MR spectroscopy (NSPEC sequence), and the other underwent dynamic MR chemical shift imaging (CSI-bSSFP). After the scanning, all the animals were collected for staining and immunohistochemistry.Fig.2(A) shows the proposed coil and the setup in 7.0T/20 cm MRI scanner. From outside to inside, the proposed coil contains RF shielding, 1H birdcage coil for reference images, 2H saddle coil for excitation, and 2 loops surface 2H coil for receiving. To avoid the strong coupling between the two 2H coils, active detuning is applied to the 2H coils. Fig.2B shows the modified CSI-bSSFP sequence, compared to conventional CSI, all gradients are refocused during the TR to enhance the SNR.
RESULTS & DISCUSSION
Fig. 3(A) and (B) show the comparison of SNR obtained with different 2H coils. From left to right are shown the 2H images acquired with saddle transceiver coil, one loop surface transceiver coil, and the proposed coil with saddle coil for excitation and two loop surface coil for receiver. We can notice that the SNR of the surface coils is substantially higher than the saddle transceiver coil. Compared to one loop surface transceiver coil, the proposed coil is more homogenous. Fig. 3(C) shows the comparison of CSI-bSSFP and traditional CSI for phantoms (2H-glucose and 2H-acetonitrile). For 2H-glucose, SNR increased from 41.9 to 66.1, and for 2H-acetonitrile SNR increase from 13.8 to 21.7.Fig. 4 shows the comparison of dynamic deuterium spectra after the injection of 2H-glucose for three groups of rats. Every spectrum is acquired in 90 seconds, and a total scan time is 2 hours. AMARES toolbox is used to calculate the concentrations of 2H labeled water, glucose, Glx and lactate. Figure 4(G-I) shows the dynamic metabolic concentrations for Con, ICH 3d, and ICH 7d, respectively. The comparison of 2H MR spectroscopic imaging (water, glucose, and lactate) for control, ICH 3d, and ICH 7d groups are presented in Figure 5. From Figures 4 and 5, it can be noticed that the lactate concentration in the ICH group is higher than in the control group, indicating abnormal metabolism after intracerebral hemorrhage. Moreover, from the metabolic mapping of lactate, it can be noticed that the signal in the ICH region is much higher than in the normal brain tissue. Figure 5(I, J) shows the result of immunohistochemistry for three group brain tissue slices. The expression of LDHA enzyme in ICH 3d group is higher than that in ICH 7d group and control group, which was similar to the DMI result.
CONCLUSION
In this work, we proposed an active decoupling 2H/1H transceiver coil and optimized CSI sequences relying on bSSFPto obtain a higher SNR. We applied these techniques to measure the lactate changes at different time points (3days and 7days) after ICH through the dynamic deuterium spectra and CSI metabolic map.Acknowledgements
This work was supported by the National Major Scientific Research Equipment Development Project of China (81627901), the National key of R&D Program of China (Grant 2018YFC0115000, 2016YFC1304702), National Natural Science Foundation of China (11575287, 11705274), and the Chinese Academy of Sciences (YZ201677).References
1. Keep RF, Hua Y, Xi G. Intracerebral haemorrhage: mechanisms of injury and therapeutic targets. The Lancet Neurology. 2012;11(8):720-31.
2. Jalloh I, Helmy A, Shannon RJ, Gallagher CN, Menon DK, Carpenter KL, et al. Lactate uptake by the injured human brain: evidence from an arteriovenous gradient and cerebral microdialysis study. Journal of neurotrauma. 2013;30(24):2031-7.
3. Tisdall MM, Smith M. Multimodal monitoring in traumatic brain injury: current status and future directions. British journal of anaesthesia. 2007;99(1):61-7.
4. De Feyter HM, Behar KL, Corbin ZA, Fulbright RK, Brown PB, McIntyre S, et al. Deuterium metabolic imaging (DMI) for MRI-based 3D mapping of metabolism in vivo. Science advances. 2018;4(8):eaat7314.
5. Kaggie JD, Khan AS, Matys T, Schulte RF, Locke MJ, Grimmer A, et al. Deuterium metabolic imaging and hyperpolarized (13)C-MRI of the normal human brain at clinical field strength reveals differential cerebral metabolism. Neuroimage. 2022; 257:119284.
Figures
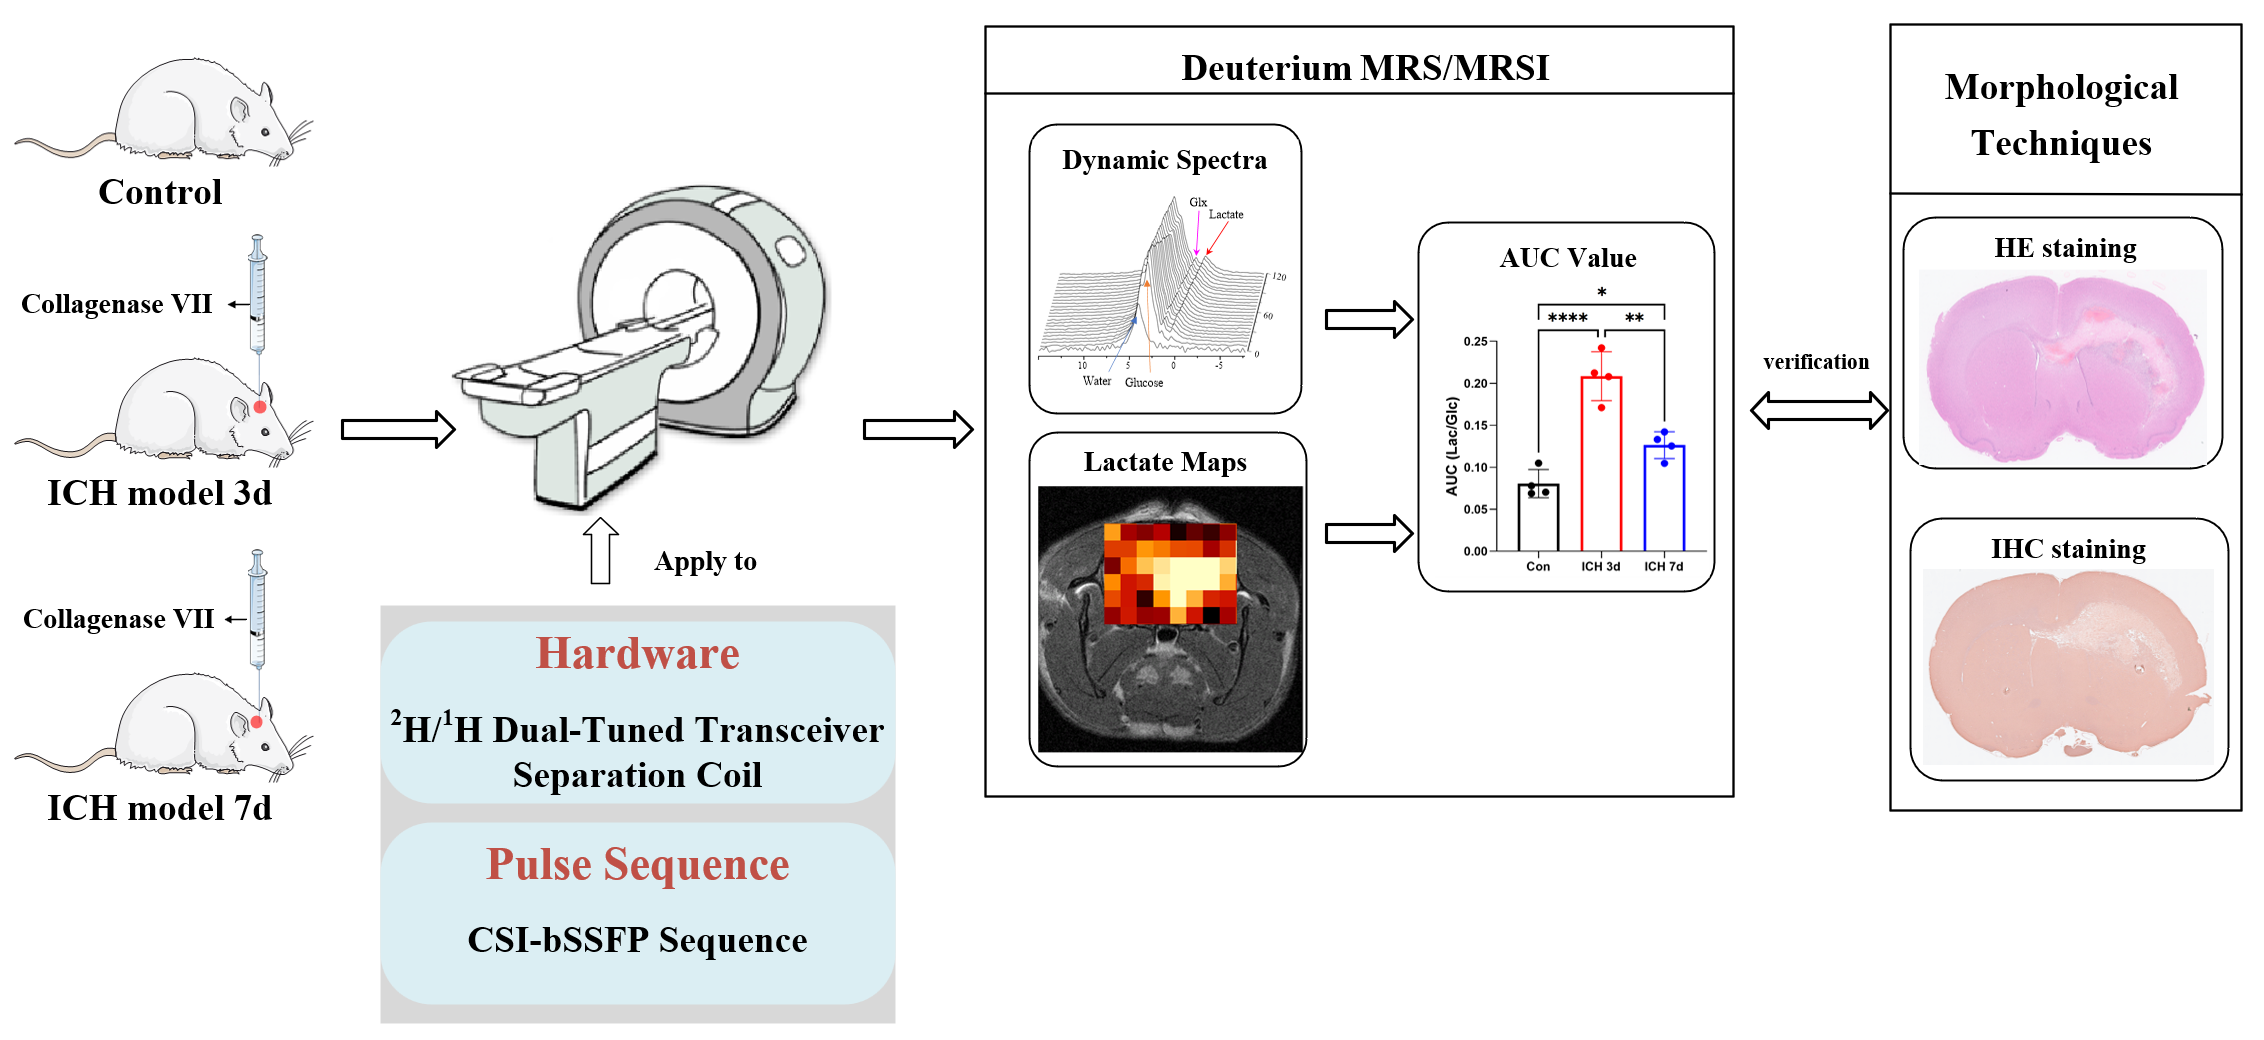
Figure 1. The experimental design of this study. 3 groups of rats (Control; ICH after 3days; ICH after 7days) are scanned with optimized active decoupling 2H coil and CSI-bSSFP to increase SNR and validated with HE staining and ICH staining.
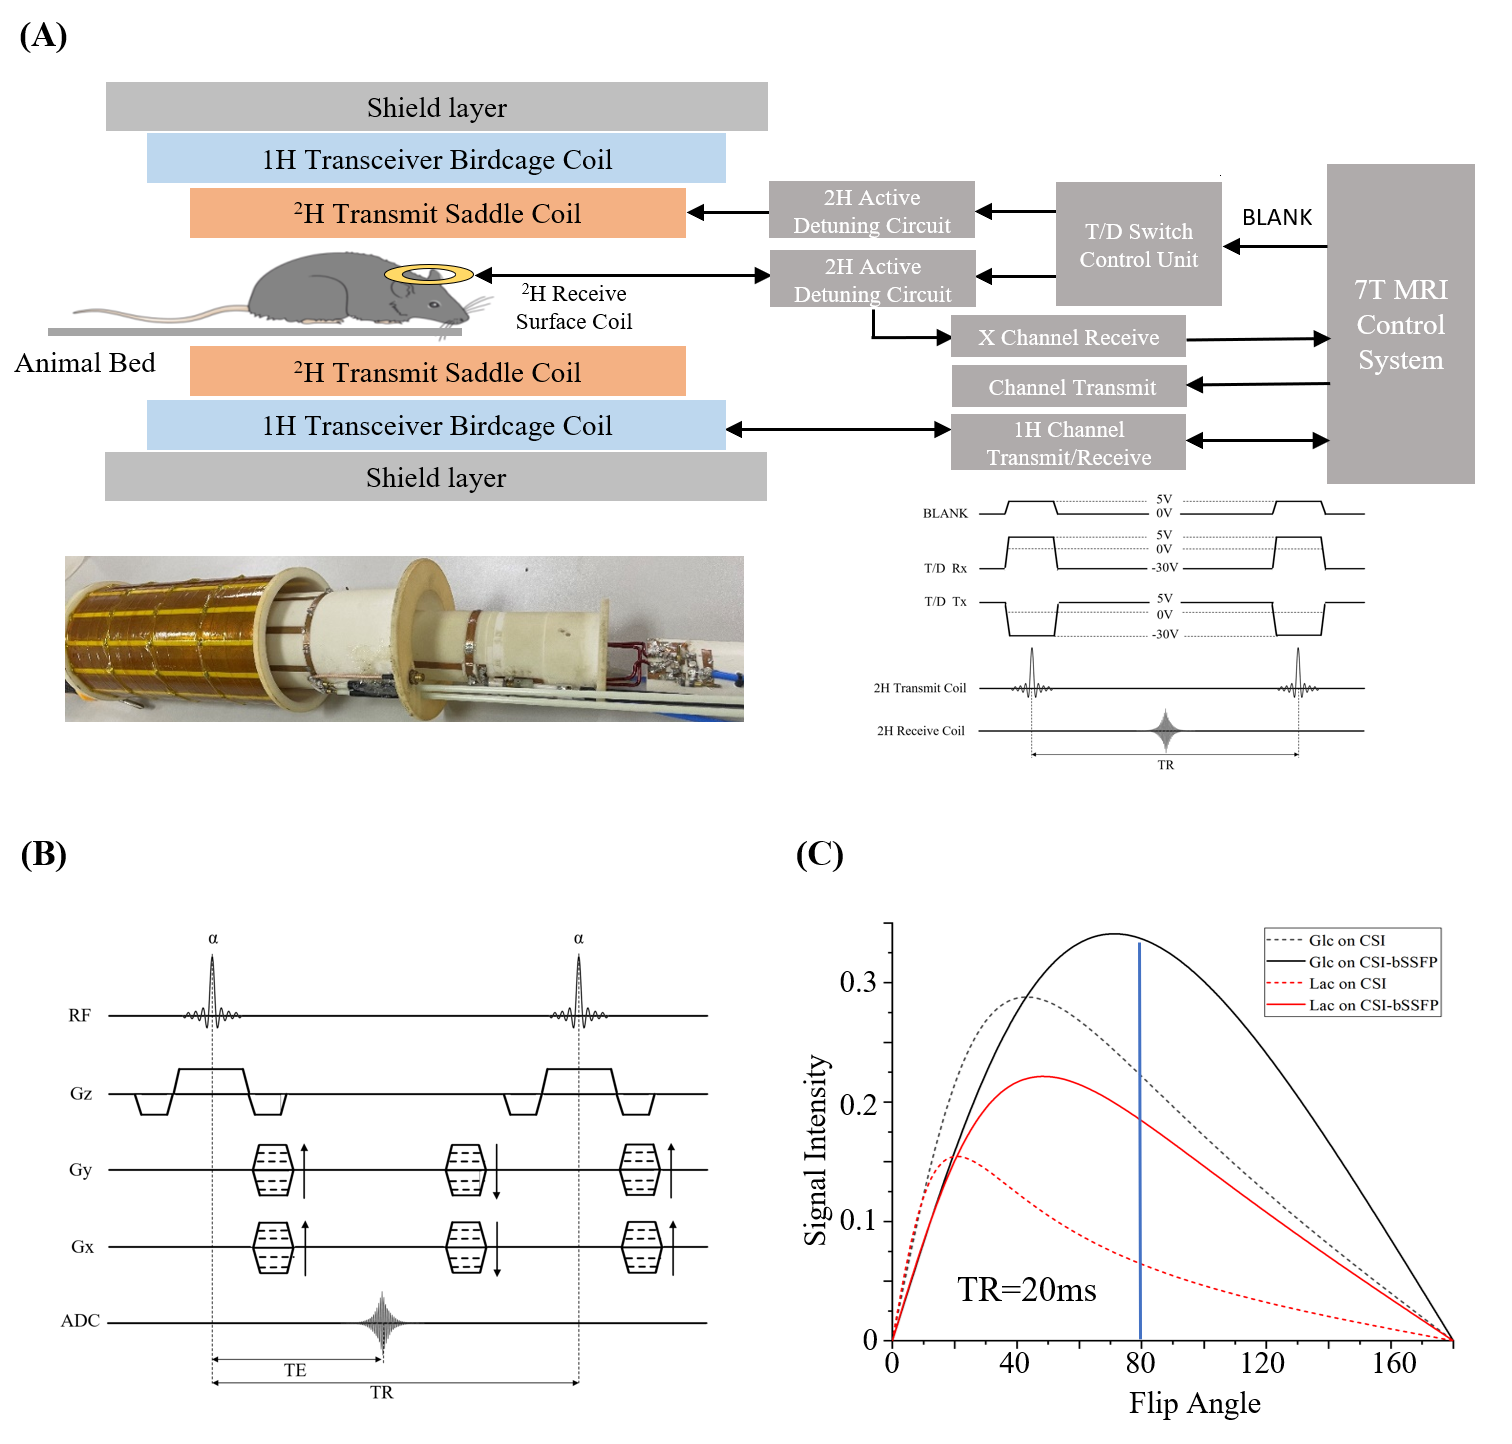
Figure 2. (A) The 2H/1H dual-tuned transceiver separation coil. (B) The CSI-bSSFP sequence. (C) The signal comparison for the conventional CSI and CSI-bSSFP experiment.
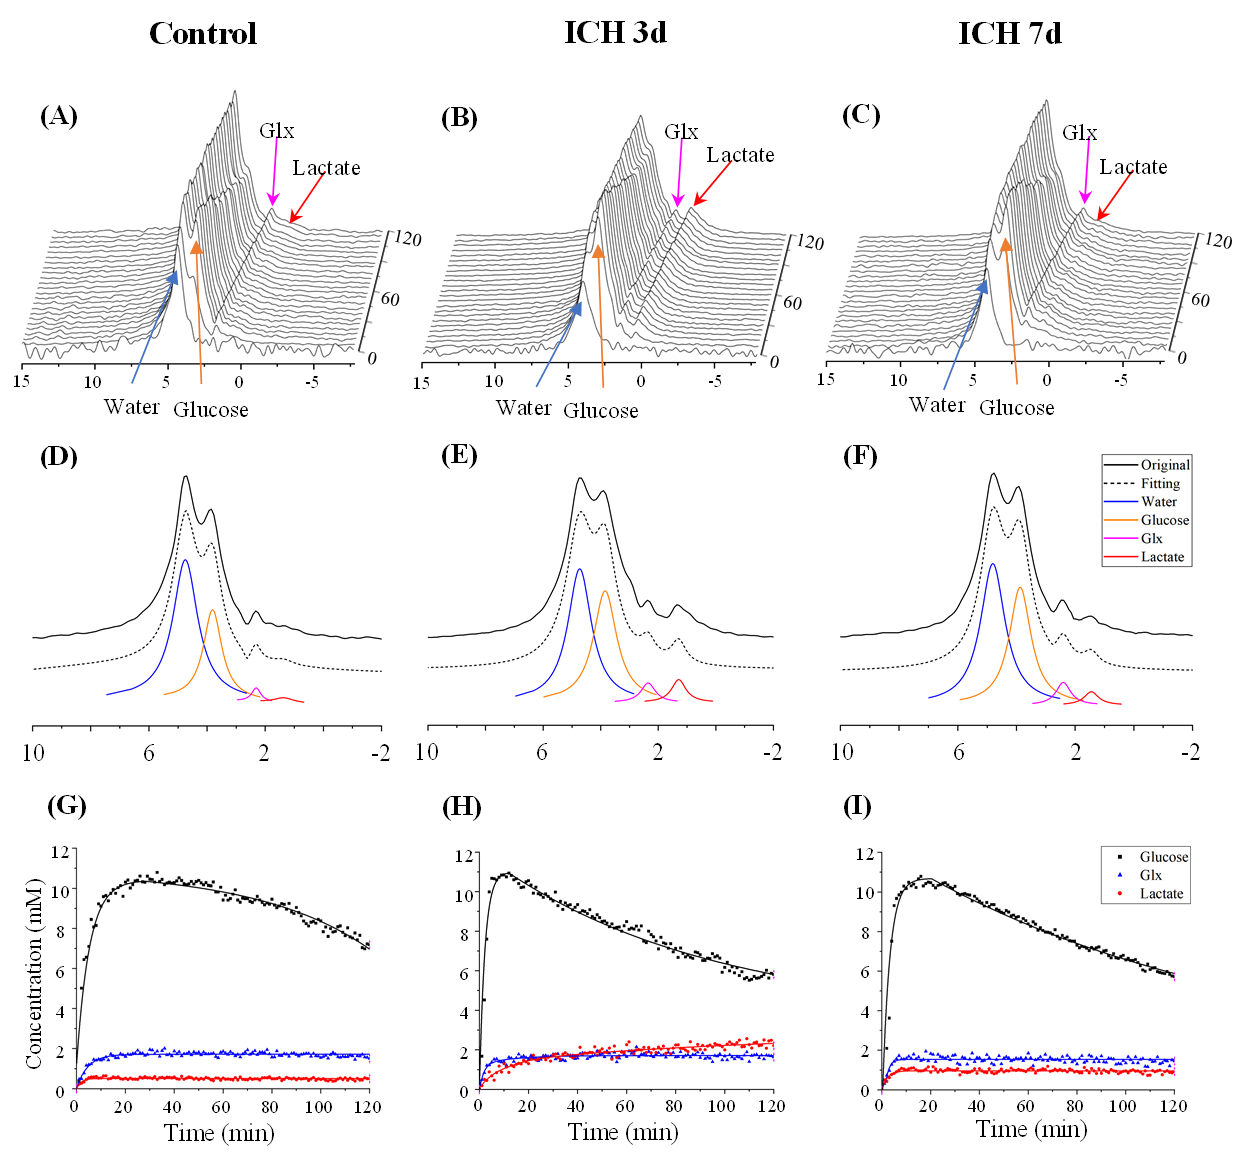
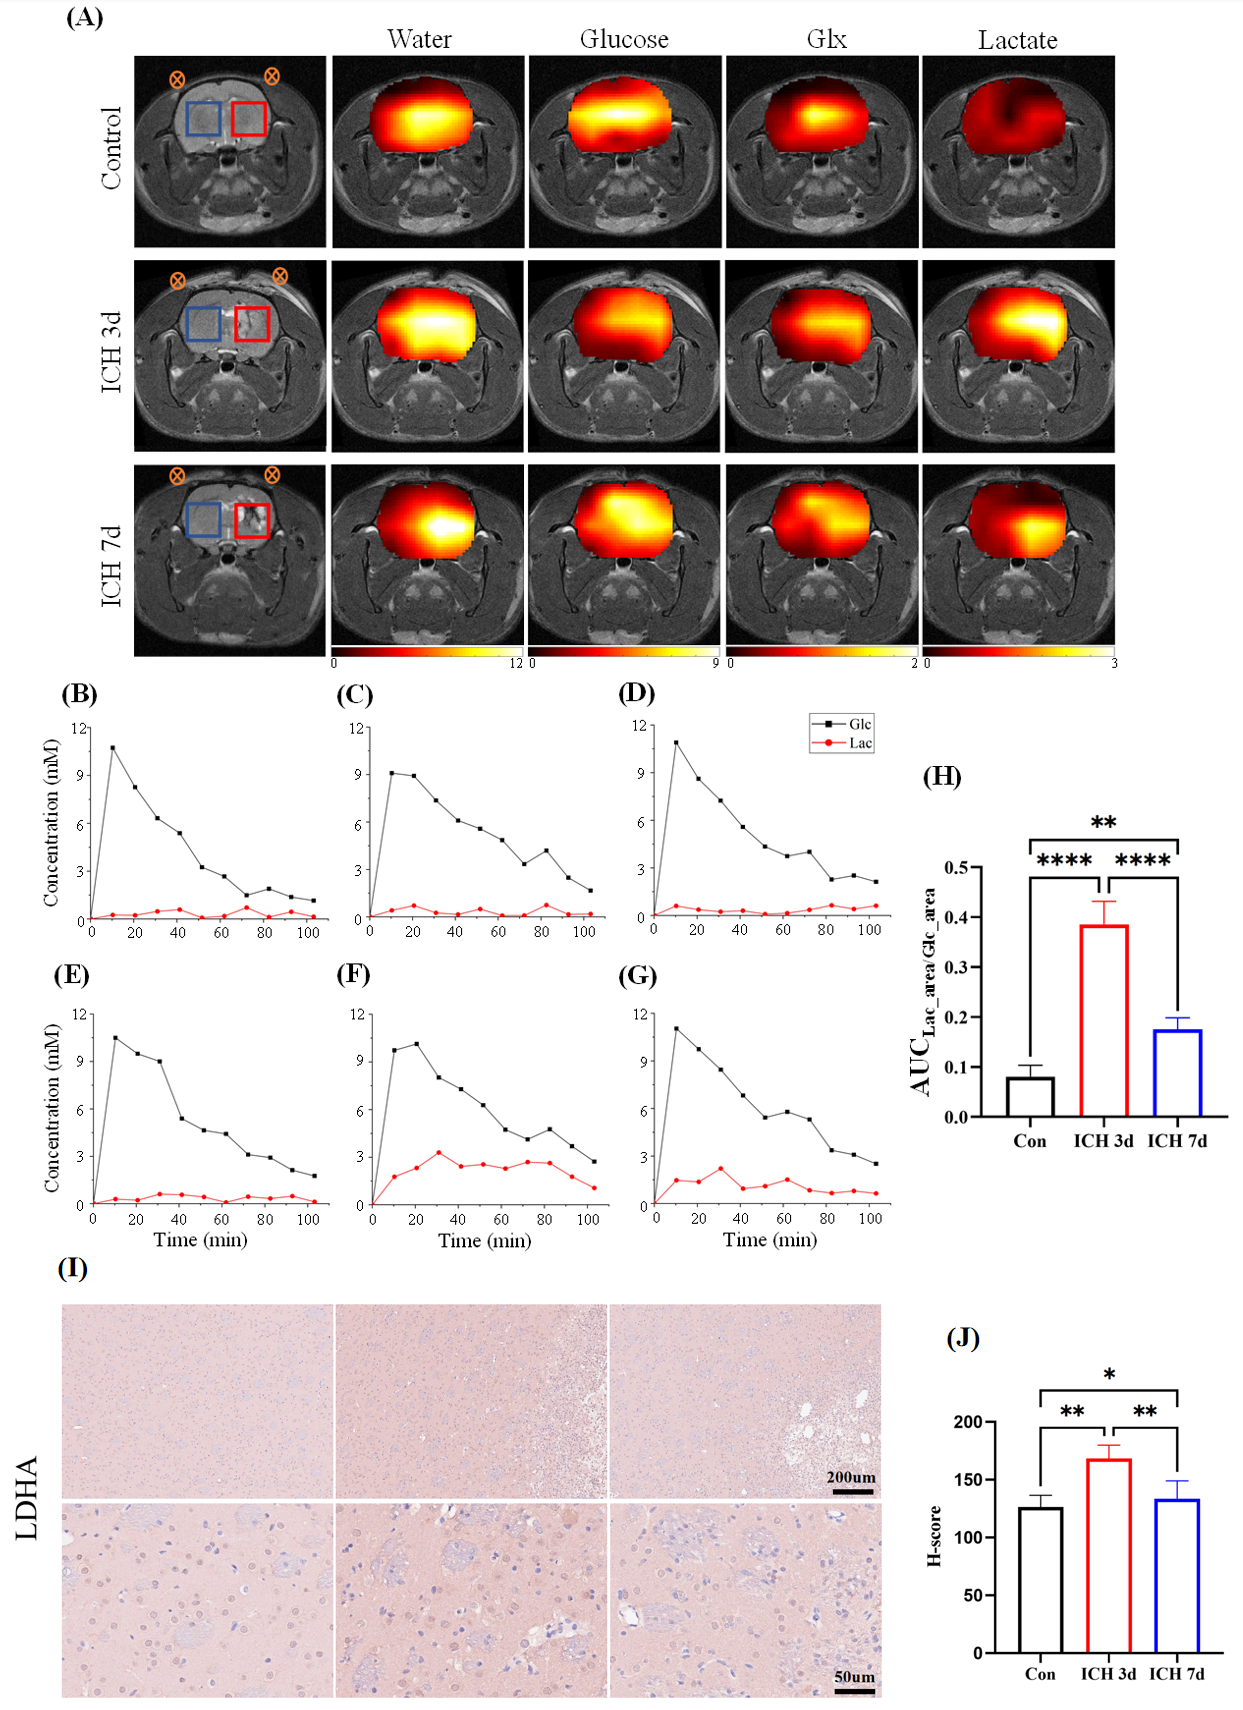
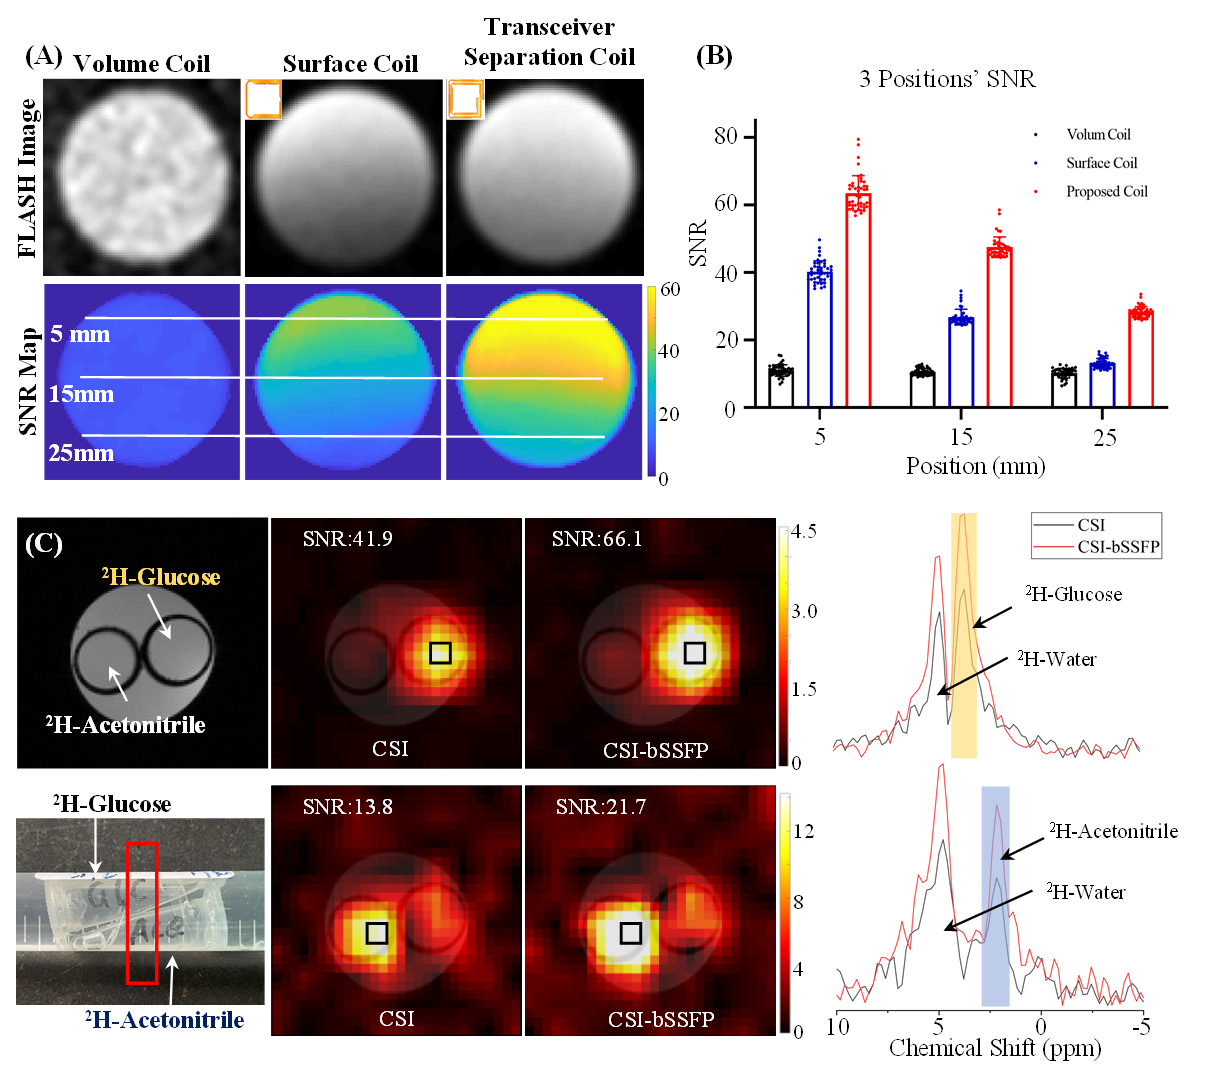
Figure 3. (A) and (B) show the comparison of SNR obtained with different 2H coils. From left to right shows the 2H images acquired with saddle volume transceiver coil, one loop surface transceiver coil, and the proposed coil with saddle coil for excitation and two loop surface coil for the receiver. (C) the comparison of CSI-bssfp and traditional CSI for phantoms (2H-glucose and 2H-acetonitrile).