0225
Deuterium metabolic imaging detects early treatment response to mitochondrial complex 1 inhibition1Cancer Research UK, Cambridge Institute, Cambridge, United Kingdom
Synopsis
Keywords: Tumors (Post-Treatment), Deuterium
Motivation: The oxidative subtype of glioblastoma (GB) has potential mitochondrial therapeutic vulnerabilities that can be targeted for treatment.
Goal(s): To detect early response to a mitochondrial complex 1 inhibitor, IACS-010759, using deuterium metabolic imaging (DMI).
Approach: Measurements of oxygen consumption, extracellular acidification rate and 2H-labelled lactate production in GB cell suspensions in vitro and 2H-labelled lactate and Glx production from [6,6’-2H2]glucose in GB xenografts in vivo, pre- and post-treatment.
Results: DMI detects an in vivo response to treatment with IACS-010759 from measurements of decreased 2H-labeled Glx production and increased 2H-labeled lactate production.
Impact: Deuterium metabolic imaging can be used to detect the early response of a glioblastoma model to treatment with a mitochondrial complex 1 inhibitor.
Introduction
Different metabolic subtypes of glioblastoma (GB) are associated with different prognoses, with the oxidative subtype exhibiting a potential therapeutic vulnerability to mitochondrial inhibition.1 Deuterium metabolic imaging (DMI) is a powerful metabolic imaging technique for probing metabolism in patients.2 We have shown previously that DMI is able to differentiate between metabolic subtypes of GB and can detect early response to chemoradiotherapy.3 Novel metabolic inhibitors have shown promise in the treatment of cancer,4 and the potent mitochondrial complex 1 inhibitor, IACS-010759, has been shown to inhibit proliferation and induce apoptosis in brain tumors.5 We demonstrate here that DMI, using deuterated glucose, can detect response to IACS-010759 treatment in GB models in vivo.Methods
Two primary human GB cell lines were characterized using a Seahorse Bioscience XF 96 analyzer (Agilent). Baseline oxygen consumption rate (OCR) measurements, a reflection of mitochondrial activity, and extracellular acidification rate (ECAR) measurements, a reflection of glycolytic activity, were made pre- and post-treatment with IACS-010759. Mitochondrial activity was further assessed using the Mitostress assay (Agilent). These cells were then seeded in T25 flasks at a density of 1 x 10⁶ cells/5 ml of medium, cultured for five days, and then incubated with 10 mM D-[6,6’-2H2]glucose (Sigma Aldrich) for 4 hours, after which extracellular media extracts were taken for 2H MRS measurements of 2H-labelled lactate. Spectra were acquired at 14.1T (Bruker) and 300 K using the 2H coil of a 5 mm proton/broadband inverse detection probe. A 90° pulse and 3 s repetition time were used and the spectra were the sum of 1024 transients collected over 62 min with a spectral width of 2000 Hz. Measurements of intracellular reactive oxygen species (ROS) were made using a 2′,7′‐dichloro-fluorescein diacetate (DCFDA) (Abcam) assay kit. Cell viability following 72 hours of incubation with IACS-010759 was assessed using the CellTiter-Glo 2.0 cell viability assay (Promega). Female athymic BALB/c nude mice underwent stereotactic intracranial implantation with 1.5 x 10⁶ S2 cells (n=3). When tumors had grown to >5 mm3, 2H MR spectroscopic images were acquired using a 7T spectrometer (Agilent) with a custom built 14-mm diameter 2H transmit-receive surface coil and a 1H volume transmit-receive coil (Rapid Biomedical). A baseline 2H spectrum was obtained prior to intravenous administration of 2 g/kg D-[6,6’-2H2]glucose dissolved in saline. Serial 2H CSI spectra were acquired using a 2 ms BIR4 pulse with a nominal flip angle of 50°, with phase encoding gradients encoding a 9 x 9 x 3 k-space matrix with a FOV of 27 x 27 x 27mm. Data were acquired into 256 spectra points with a spectral width of 2003 Hz and a TR of 140 ms. The animals were then treated with IACS-010759 (5 mg/kg/day for 2 days) via oral gavage. Post-treatment 2H spectra were acquired within 24-48 hours of completion of treatment.Results
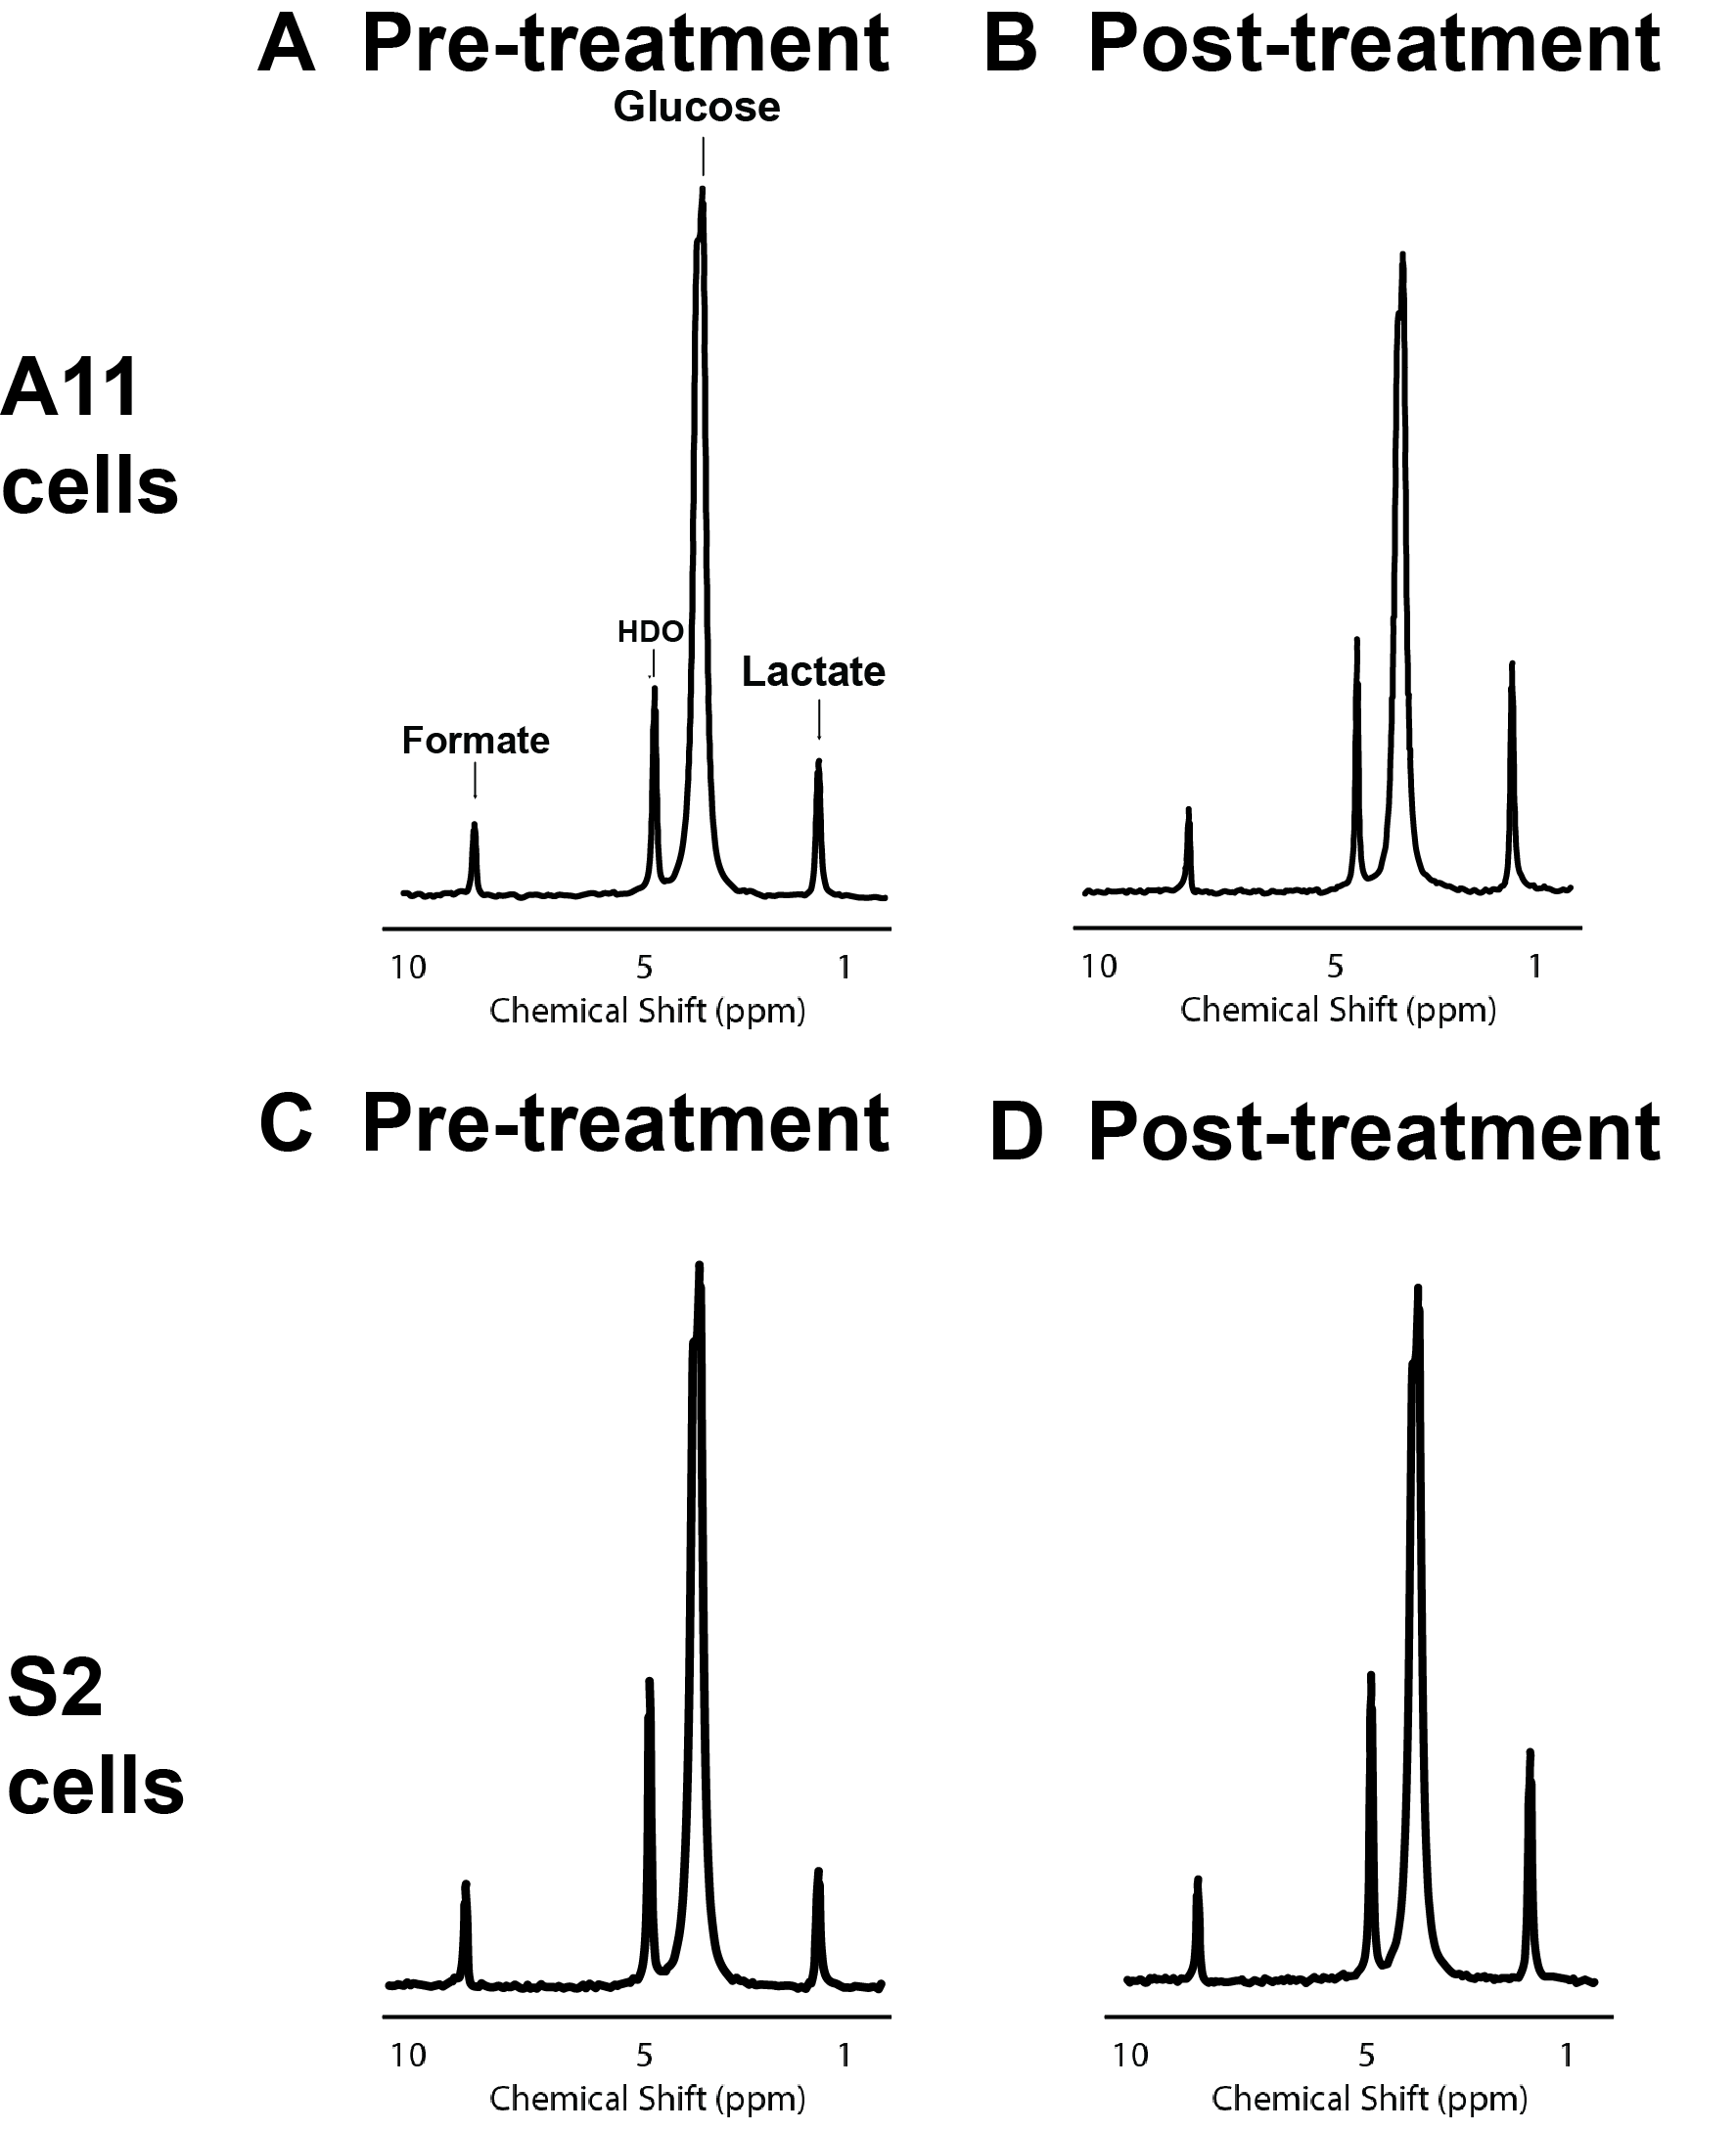
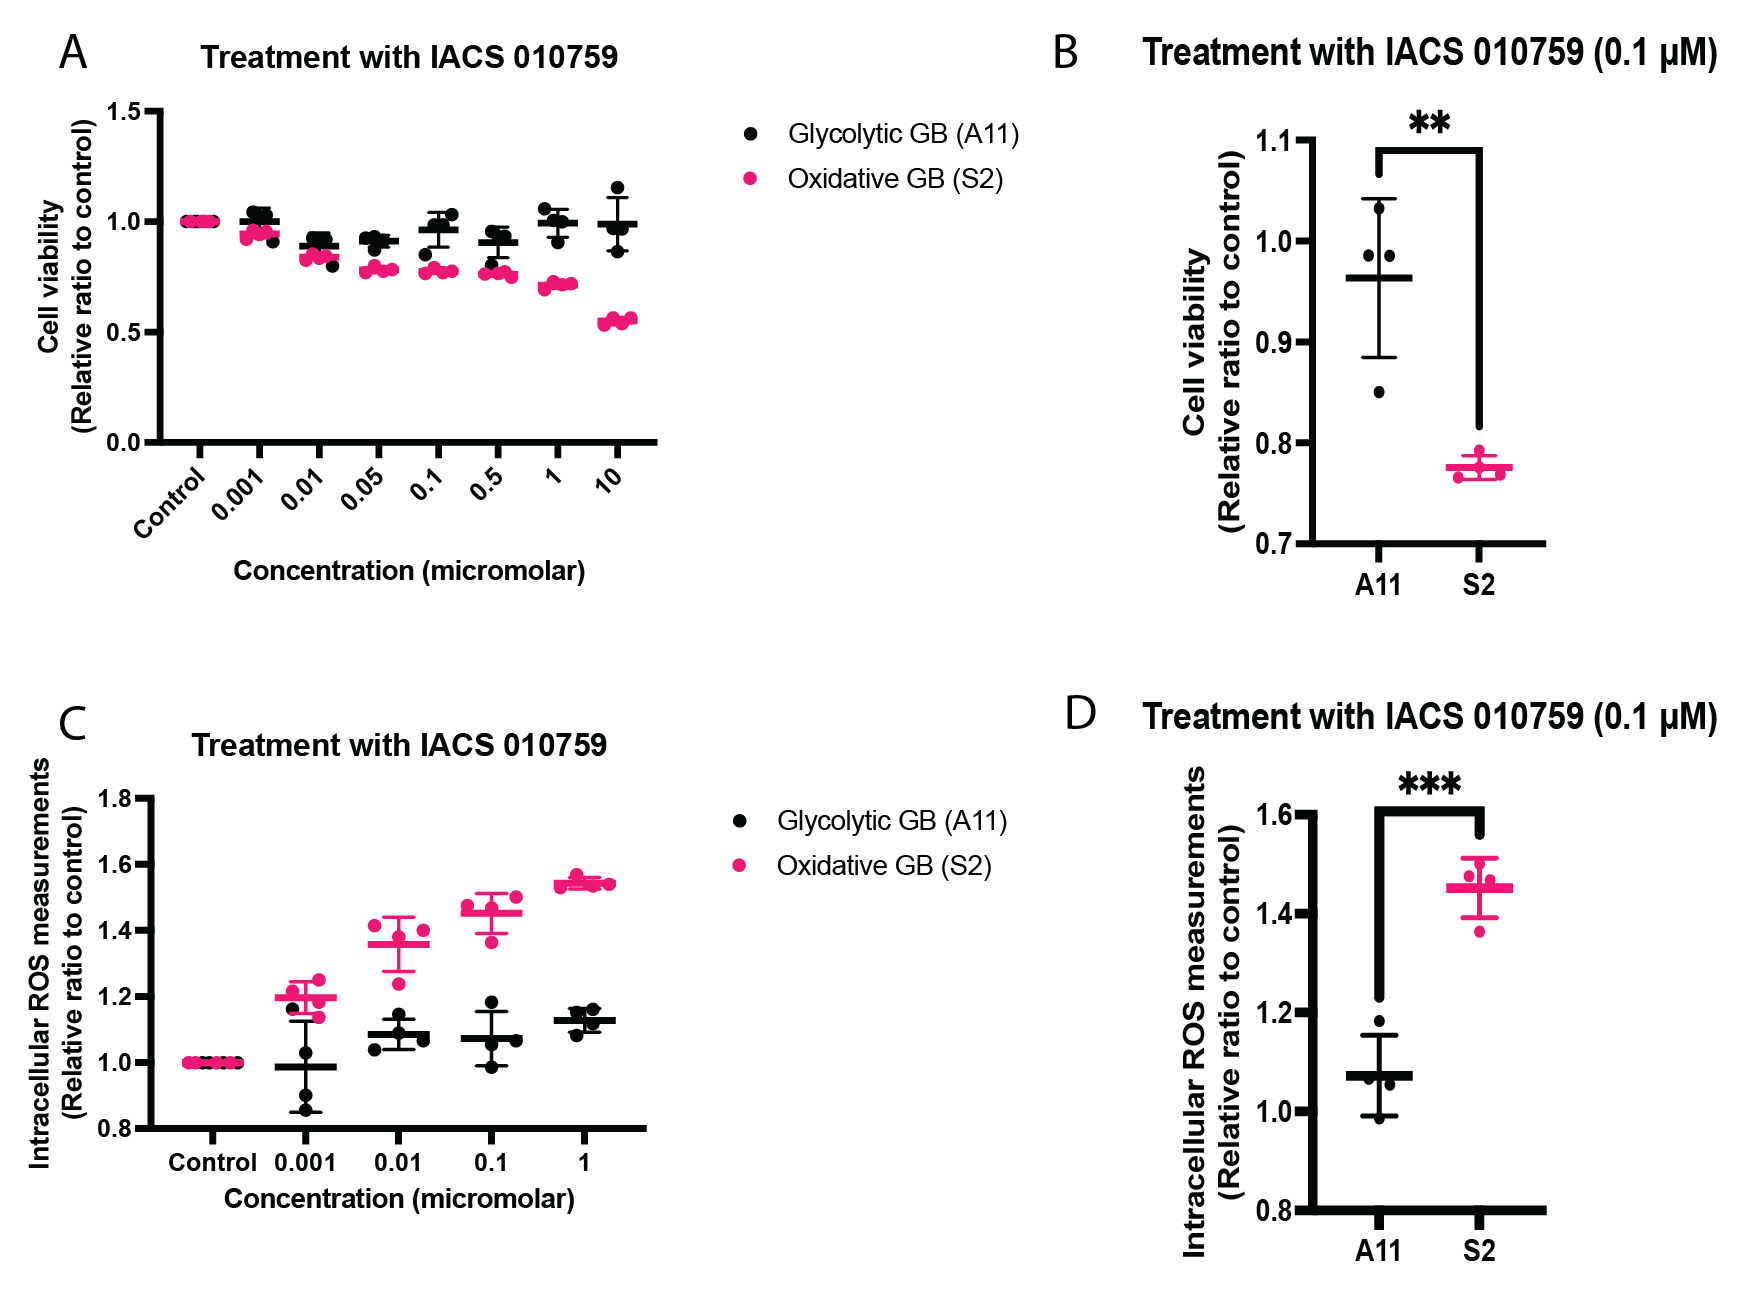
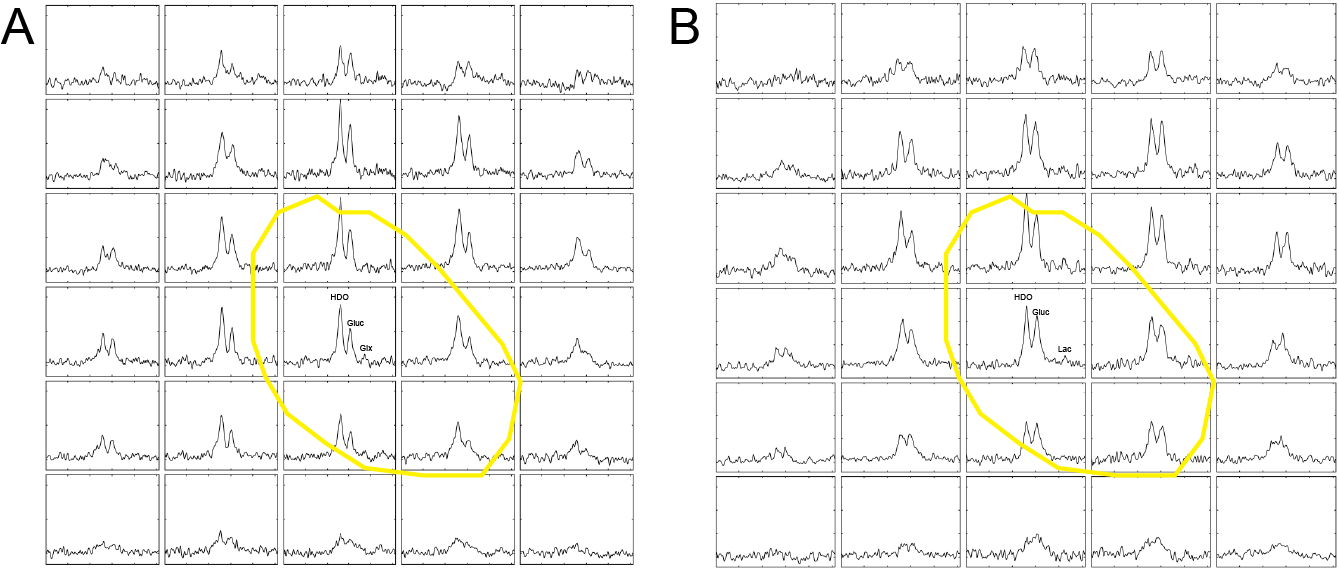
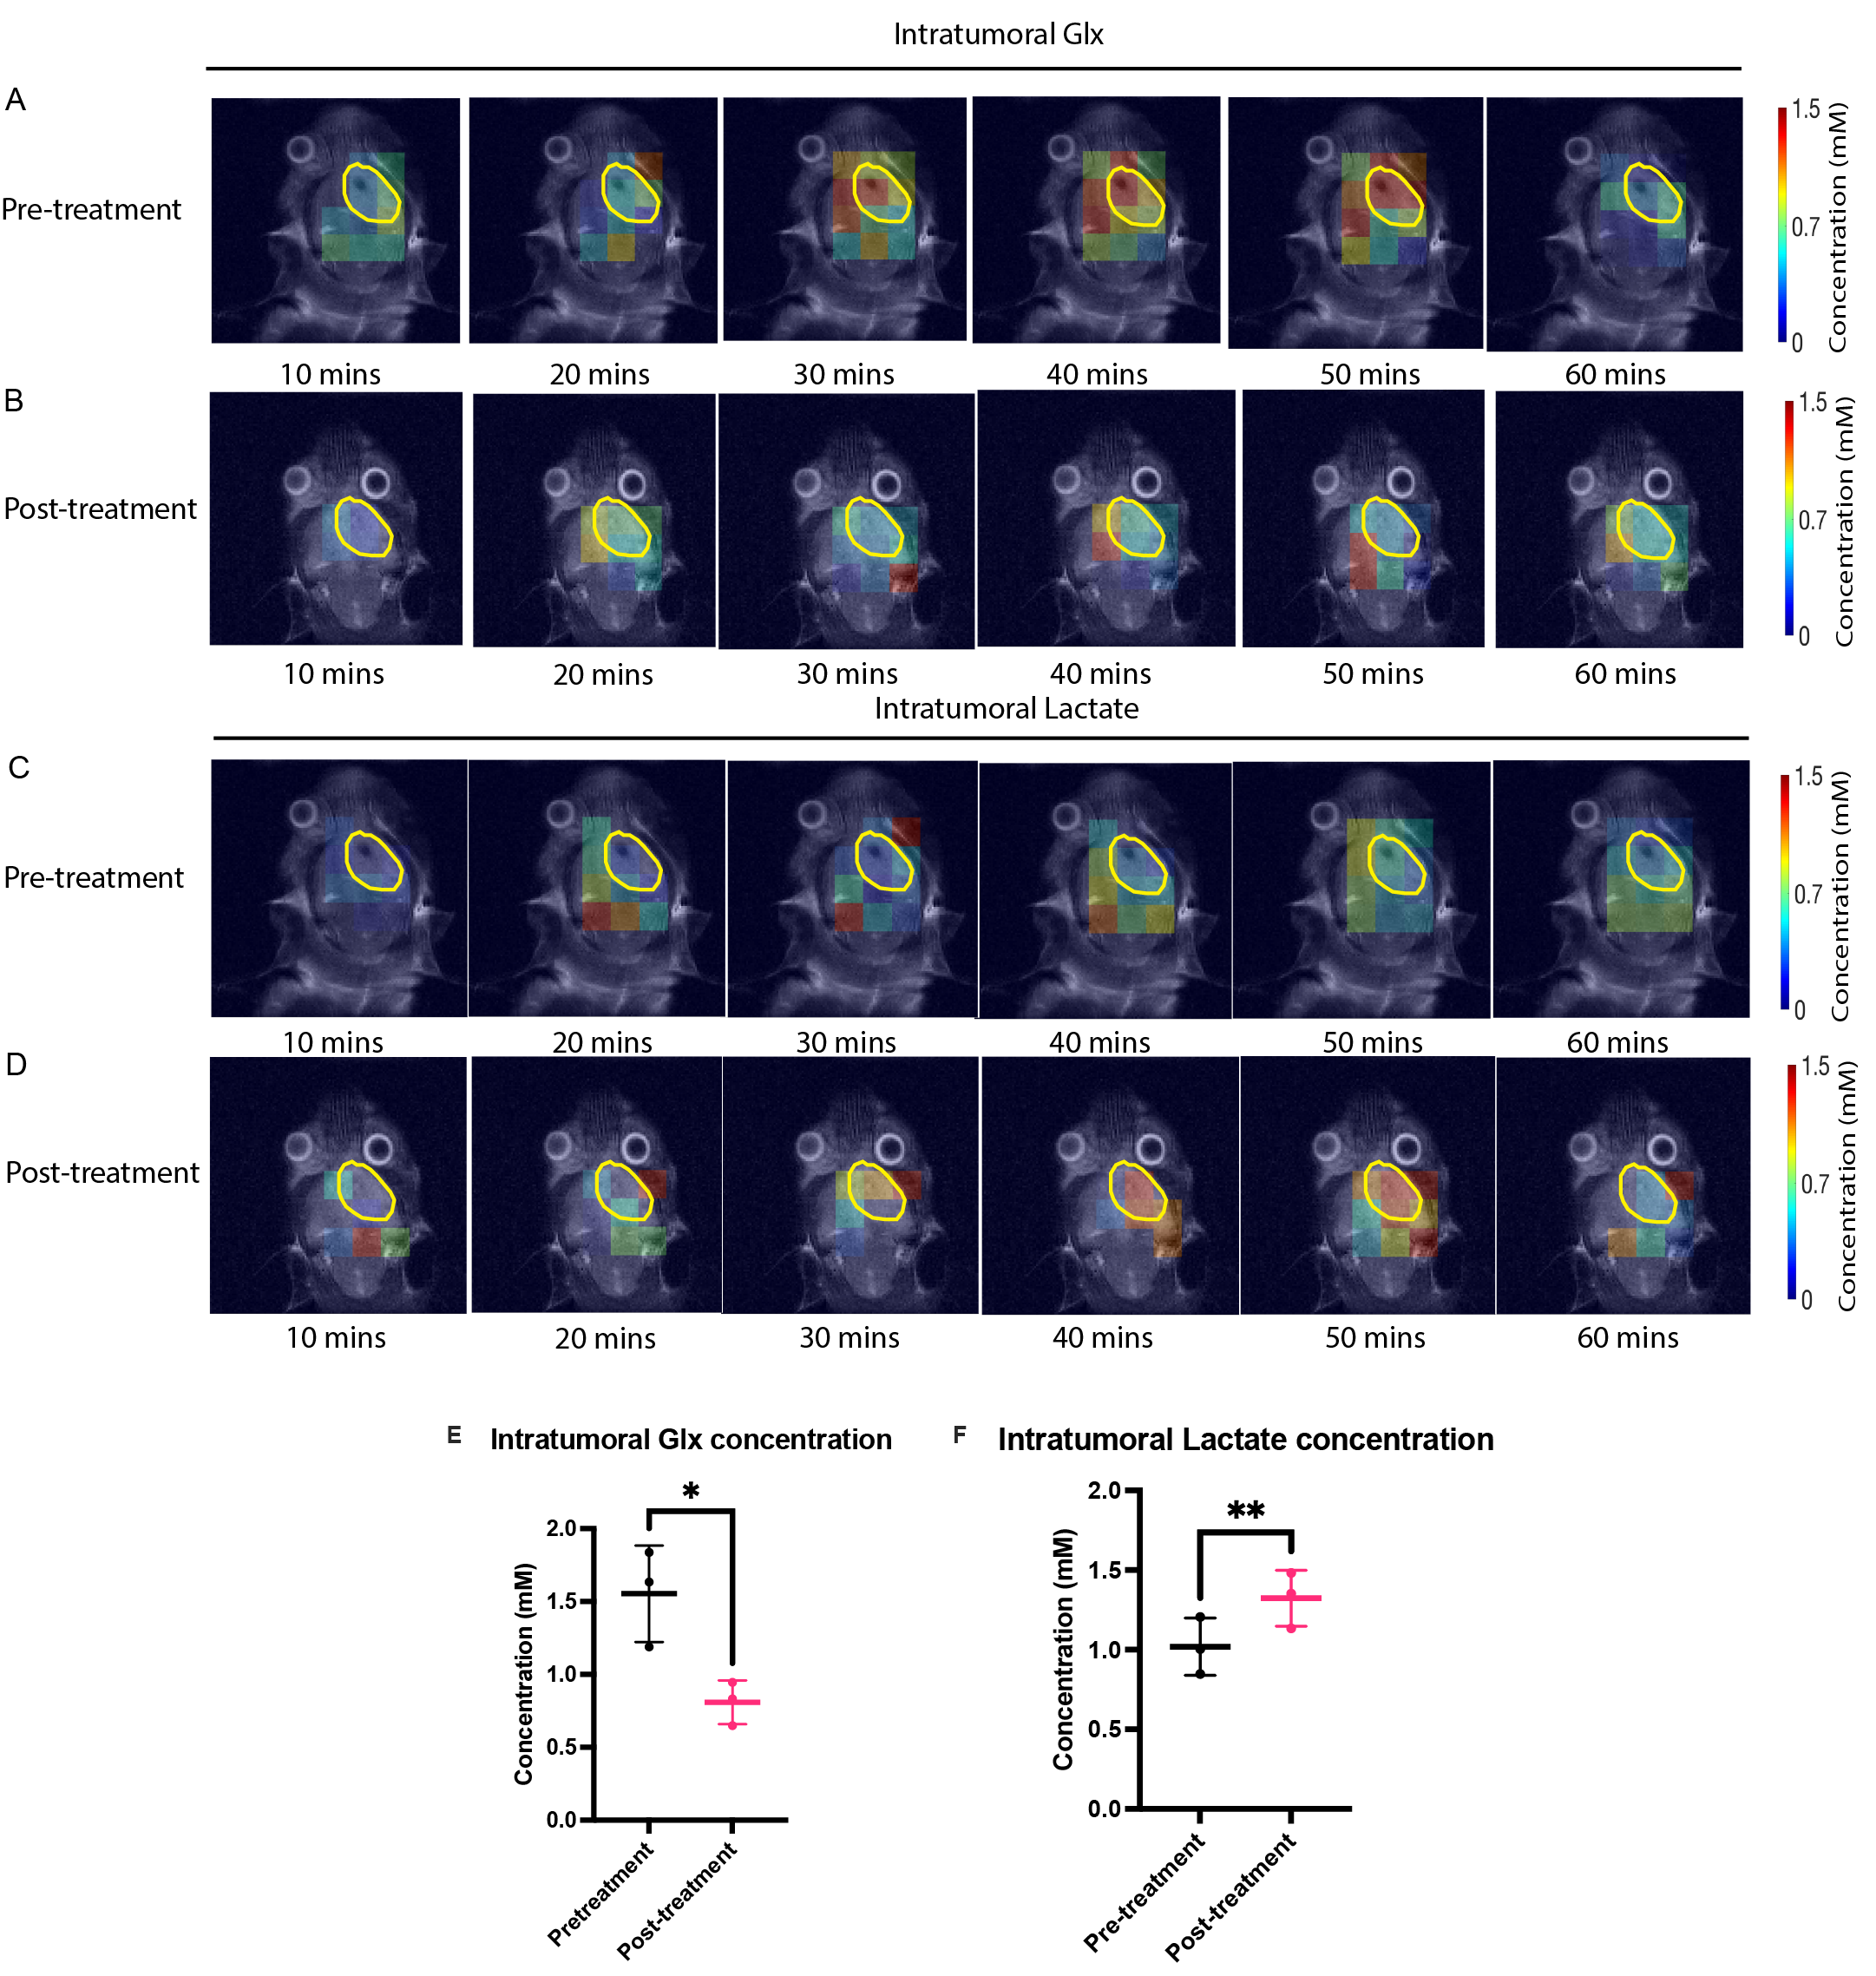
Following IACS-010759 treatment, Seahorse analysis and 2H NMR spectroscopy measurements of extracellular media samples showed a reduction in mitochondrial activity and a compensatory increase in glycolysis in both A11 tumor cells, which RNA sequencing data showed have a glycolytic metabolic phenotype, and S2 tumor cells, which exhibit an oxidative phenotype. Basal OCR was reduced in both S2 (p<0.0001) and A11 cells (p<0.0001), which coincided with an increase in basal ECAR in both models (S2, p=0.022 and A11, p=0.009) (Figure 1). 2H spectroscopy of media samples showed an increase in 2H-labeled lactate production, from 0.93 ± 0.05 mM/106 cells to 1.47 ± 0.12 mM/106 cells in A11 cells (p=0.002) and from 0.51 ± 0.06 mM/106 cells to 1.18 ± 0.09 mM/106 cells in S2 cells (p=0.0004) (Figure 2). The predominantly oxidative S2 cells generated more intracellular ROS than A11 (p=0.0003) and this was associated with a greater reduction in cell viability (Figure 3). 2H MR spectroscopic imaging was used to assess the early response of S2 tumor-bearing mice to IACS-010759 treatment (Figure 4). 2 g/kg D-[6,6’-2H2]glucose were administered i.v. and 2H-labeled Glx and lactate were measured (Figure 5). We observed a reduction in 2H-labeled Glx concentration from 1.55 ± 0.33 mM to 0.81 ± 0.15 mM (p=0.024) and an increase in 2H-labeled lactate from 1.02 ± 0.18 mM to 1.32 ± 0.18 mM (p=0.006) following a 2-day treatment with IACS-010759 (Figure 5).Discussion
As novel metabolic inhibitors are introduced to treat glioblastoma, non-invasive imaging techniques are required to monitor the responses to these therapies. DMI using deuterated glucose can detect a reduction in mitochondrial activity and an accompanying increase in glycolysis following treatment with IACS-010759.Conclusion
Deuterium metabolic imaging of deuterated glucose metabolism has the potential to detect early response to mitochondrial inhibition using IACS-010759.Acknowledgements
The authors acknowledge the support of the Cancer Research UK, Cambridge Institute core facilities, in particular the biological resources unit and preclinical imaging core. We would also like to thank Sarah McGuire, Madhu Basetti and Dominick McIntyre for their help. The work was supported by grants from Cancer Research UK (C197/A17242, C197/A16465, C9685/A25177). F.H. was in receipt of a Cambridge European Scholarship from the Cambridge Trust. J.C.M.L was supported by a clinical research training fellowship from the Medical Research Council UK (MR/V029452/1)References
1. Garofano, L. et al. Pathway-based classification of glioblastoma uncovers a mitochondrial subtype with therapeutic vulnerabilities. Nature Cancer 2020 2:2 2, 141–156 (2021).
2. De Feyter, H. M. et al. Deuterium metabolic imaging (DMI) for MRI-based 3D mapping of metabolism in vivo. Sci Adv 4, (2018).
3. Low, J. C. M., Cao, J., Hesse, F., Wright, A. & Brindle, K. Deuterium metabolic imaging distinguishes metabolic subtypes and detects early treatment response to current standard of care in glioblastoma. ISMRM, London (2023).
4. Stine, Z. E., Schug, Z. T., Salvino, J. M. & Dang, C. V. Targeting cancer metabolism in the era of precision oncology. Nature Reviews Drug Discovery 2021 21:2 21, 141–162 (2021).
5. Molina, J. R. et al. An inhibitor of oxidative phosphorylation exploits cancer vulnerability. Nat Med 24, 1036–1046 (2018).
Figures