0224
Combining multi-echo and phase cycling in bSSFP acquisition to improve whole-brain deuterium metabolic imaging at 9.4 T1High Field Magnetic Resonance, Max-Planck Institute for Biological Cybernetics, Tübingen, Germany, 2Department of Biomedical Magnetic Resonance, Eberhard Karls University Tübingen, Tübingen, Germany, 3Center for MR Research, University Children's Hospital, Zurich, Switzerland, 4Werner Siemens Imaging Center, Eberhard Karls University Tübingen, Tübingen, Germany, 5Cluster of Excellence iFIT (EXC 2180) «Image-Guided and Functionally Instructed Tumor Therapies», Eberhard Karls University Tübingen, Tübingen, Germany
Synopsis
Keywords: Deuterium, Deuterium, bSSFP, DMI, ultra high field, brain, metabolism, cancer
Motivation: Deuterium metabolic imaging could significantly impact the field of neuro-oncology by providing clinical quantitative metabolic information.
Goal(s): To improve the spatial resolution of human deuterium metabolic imaging at 9.4 T.
Approach: We performed phantom and in vivo experiments with oral intake of deuterated glucose using multi-echo phase-cycled bSSFP acquisitions. The results were compared with a standard 3D spectroscopy sequence.
Results: We achieved higher spatial resolution compared to a 3D spectroscopy sequence. Phase cycling improved the reliability of the metabolite quantification especially in the large off-resonance and low SNR regimes.
Impact: We present an improved whole-brain dynamic deuterium metabolic imaging strategy at 9.4 T using bSSFP with multiple echoes and phase cycling. The efficacy of this method is validated with phantom and in vivo experiments along with standard spectroscopy measurements.
Introduction
Deuterium metabolic imaging (DMI) is an emerging technique to probe metabolic pathways. The higher SNR and better spectral resolution at ultra-high field make it an ideal choice for imaging deuterium-labelled metabolic intermediates with low gyromagnetic ratio and low concentration. Typically, a CSI (chemical shift imaging)1 acquisition is used to perform DMI after an oral intake of labelled glucose2,3. Recently, multi-echo bSSFP has been shown to be SNR efficient in preclinical settings4–6. However, the large off-resonance in the human brain at ultra-high field makes the direct translation challenging. We propose a flexible method to perform DMI in the brain using a bSSFP technique with both multiple echoes and phase cycling.Methods
All experiments were performed using a Siemens 9.4T MRI system with a double-tuned 2H/1H phased array coil (deuterium: 8TxRx/2Rx)7. The in vivo measurements were approved by the local ethics board. Three healthy subjects (2 males) took part in the study and were asked to fast overnight and ingest [6,6′−2H2] glucose solution (0.75g /kg body weight) prior to the measurements. In addition, a 14 cm spherical phantom with seven cylindrical containers (25 mL each) with deuterated compounds as shown in figure 2 was used.Data acquisition:
All the 2H protocols were designed for 10 minutes of acquisition time irrespective of the resolution and other acquisition parameters to facilitate comparison.
3D CSI sequence: acquisition matrix=25x25x25, resolution= 8.3 mm isotropic (0.6 mL), hamming weighted, TR=115 ms , flip angle=46o, 4 averages, vector size= 256, bandwidth= 4kHz,and RF pulse duration=0.5ms. A similar low-resolution 10.3 mm isotropic (1.1 mL) protocol with more averages was also used.
bSSFP acquisition: acquisition matrix=32x24x24, resolution=10 mm isotropic (1mL), uniform k-space weighting, 5 echoes, 4.4 ms echo spacing, readout bandwidth=280 Hz/px, TR=24.34 ms, RF pulse duration=2ms to achieve a flip angle of 50°. The repetitions were split across 2 phase cycles/29 averages or only 58 phase cycles. A similar low-resolution 15.6 mm isotropic(3.7 mL) protocol with more averages was also tested.
Data processing:
The CSI data was noise pre-whitened, zero-padded to twice the acquisition matrix, and 3D Fourier transformed. The coil combination was performed with Whitened Singular Value Decomposition8. The obtained signal amplitudes from Lorentzian fitting were normalized by the first acquired water image to correct for inhomogeneous receive sensitivities.
The coil images from the bSSFP data were obtained similarly as the CSI data. The coil images were combined using adaptive combination9 followed by coil normalization10. The phase of the first echo image was subtracted from the other echoes to remove coil phase offsets. The system matrix for linear regression was formed using the theoretical bSSFP model11, and metabolite amplitudes were obtained as shown in Figure 1. Hamming k-space filtering and SVD denoising were applied only to the high-resolution (1 mL) data. SPM12 package12 was used to co-register 1H anatomy and field map to the 2H images.
Results
In Figure 2, the improvement in metabolite mapping by increasing the number of phase cycles is demonstrated by a more reliable prediction with fewer echoes and lower condition numbers of the spectral encoding matrices. The in vivo results of 1.1 mL acquisition-weighted CSI and 6.75 mL bSSFP protocols from subject 1 are shown in Figure 3. The high-resolution dynamic metabolite maps from subject 2 obtained using the above CSI and bSSFP protocols along with the whole-brain statistics are summarized in Figures 4 and 5 respectively. The temporal evolution of the deuterated metabolites predicted by both techniques is consistent and in agreement with the literature2,13.Discussion and conclusion
The combination of low bandwidth readouts (therefore, large TR>22ms) and large B0 inhomogeneity in the head at 9.4 T (3.5 ppm≈210 Hz) necessitates at least two phase cycles to achieve reliable metabolite amplitude estimation across the brain. In addition, with the full signal model, phase cycling also provided valuable spectral encoding compared to signal averaging. However, there is an SNR penalty with phase cycling, which can be partially compensated by increasing the number of phase cycles. All the protocols employ five echoes to image lactate for future clinical applications.Because of the acquisition weighting, CSI voxels are 7-8 times larger than the nominal voxel size. In both subjects, bSSFP protocols with uniform k-space weighting achieved significantly higher spatial resolution than the CSI protocols. In the high-resolution (1 mL) bSSFP measurement, the k-space filtering used to improve the accuracy of signal amplitude prediction degraded the spatial resolution. The initial results suggest that the proposed bSSFP technique can potentially improve the spatial resolution of human dynamic DMI at ultra-high fields.
Acknowledgements
We thank Christian Mirkes for providing initial matlab implementation for processing CSI data. The financial support of Max-Planck society is gratefully acknowledged.References
1. Keevil SF. Spatial localization in nuclear magnetic resonance spectroscopy. Phys Med Biol. 2006;51(16):R579-R636. doi:10.1088/0031-9155/51/16/R012. Ruhm L, Avdievitch N, Ziegs T, et al. Deuterium Metabolic Imaging of the human brain at 9.4 T: Coil design and dynamic glucose uptake. In: Proc. Intl. Soc. Mag. Reson. Med. 29 (2021). Virtual; 2021. https://index.mirasmart.com/ISMRM2021/PDFfiles/1802.html. Accessed October 27, 2023.
3. Serés Roig E, De Feyter HM, Nixon TW, et al. Deuterium metabolic imaging of the human brain in vivo at 7 T. Magnetic Resonance in Medicine. 2023;89(1):29-39. doi:10.1002/mrm.29439
4. Peters DC, Markovic S, Bao Q, et al. Improving deuterium metabolic imaging (DMI) signal‐to‐noise ratio by spectroscopic multi‐echo bSSFP: A pancreatic cancer investigation. Magn Reson Med. 2021;86(5):2604-2617. doi:10.1002/mrm.28906
5. Montrazi ET, Bao Q, Martinho RP, et al. Deuterium imaging of the Warburg effect at sub-millimolar concentrations by joint processing of the kinetic and spectral dimensions. NMR in Biomedicine. 2023;36(11):e4995. doi:10.1002/nbm.4995
6. Peters DC, Markovic S, Bao Q, et al. Linear combination SSFP for multi-site chemical shift imaging: Applications to Deuterium Metabolic Imaging. In: Proc. Intl. Soc. Mag. Reson. Med. 29 (2021). Virtual; 2021. https://index.mirasmart.com/ISMRM2021/PDFfiles/1193.html. Accessed November 1, 2023.
7. Avdievich NI, Ruhm L, Dorst J, Scheffler K, Korzowski A, Henning A. Double‐tuned 31 P/ 1 H human head array with high performance at both frequencies for spectroscopic imaging at 9.4T. Magn Reson Med. 2020;84(2):1076-1089. doi:10.1002/mrm.28176
8. Rodgers CT, Robson MD. Receive array magnetic resonance spectroscopy: Whitened singular value decomposition (WSVD) gives optimal Bayesian solution. Magn Reson Med. 2010;63(4):881-891. doi:10.1002/mrm.22230
9. Walsh DO, Gmitro AF, Marcellin MW. Adaptive reconstruction of phased array NMR imagery. US Patent 6,160,398. 2000;690:682-690.
10. Griswold MA, Walsh D, Heidemann R, Haase A, Jakob P. The Use of an Adaptive Reconstruction for Array Coil Sensitivity Mapping and Intensity Normalization. Proceedings of the 10th Annual Meeting of the ISMRM, Honolulu, HI, USA. 2002;43(5):2410.
11. Ganter C. Steady state of gradient echo sequences with radiofrequency phase cycling: Analytical solution, contrast enhancement with partial spoiling. Magn Reson Med. 2006;55(1):98-107. doi:10.1002/mrm.20736
12. SPM12 : Statistical Parametric Mapping package for fmri. https://www.fil.ion.ucl.ac.uk/spm/software/spm12/.
13. Hm DF, Kl B, Za C, et al. Deuterium metabolic imaging (DMI) for MRI-based 3D mapping of metabolism in vivo. Science advances. 2018;4(8). doi:10.1126/sciadv.aat7314
Figures
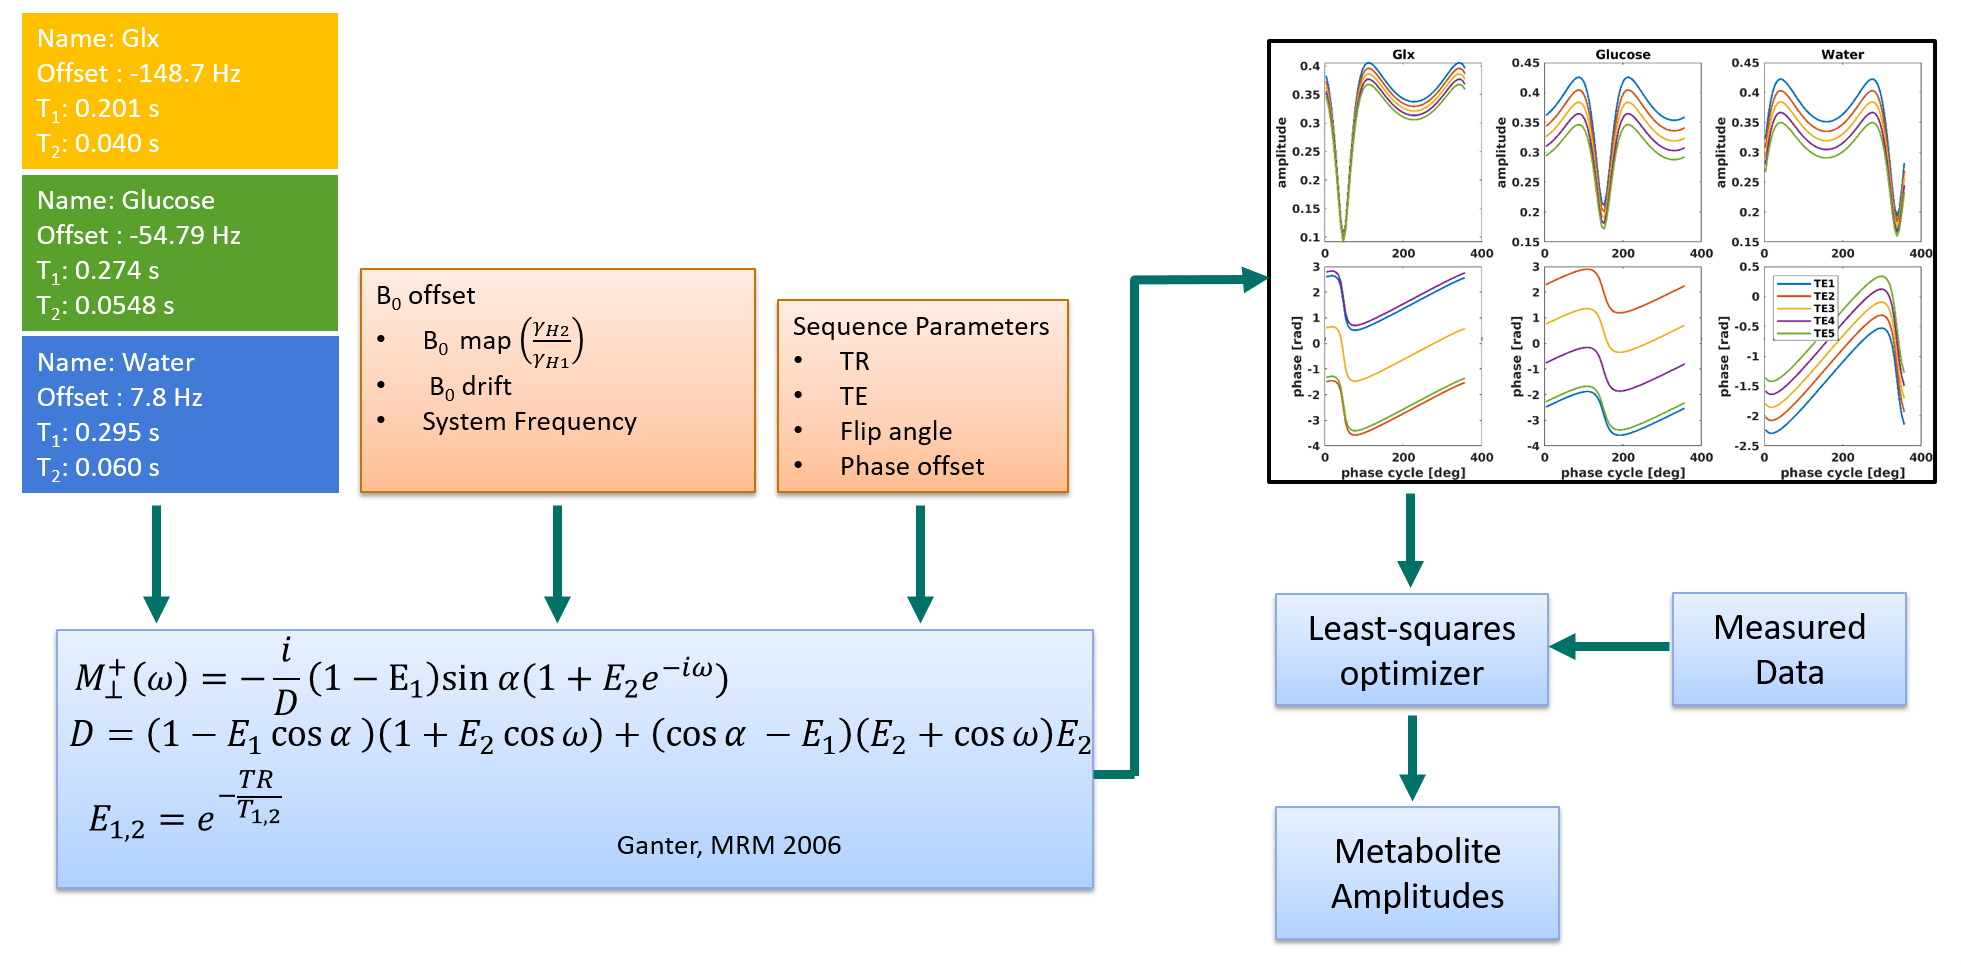
Figure 1: Formulation of deuterium metabolite mapping as an ordinary least square problem using a multi-echo phase-cycled balanced SSFP signal model. The metabolite amplitudes are estimated from the reconstructed complex images using linear regression.
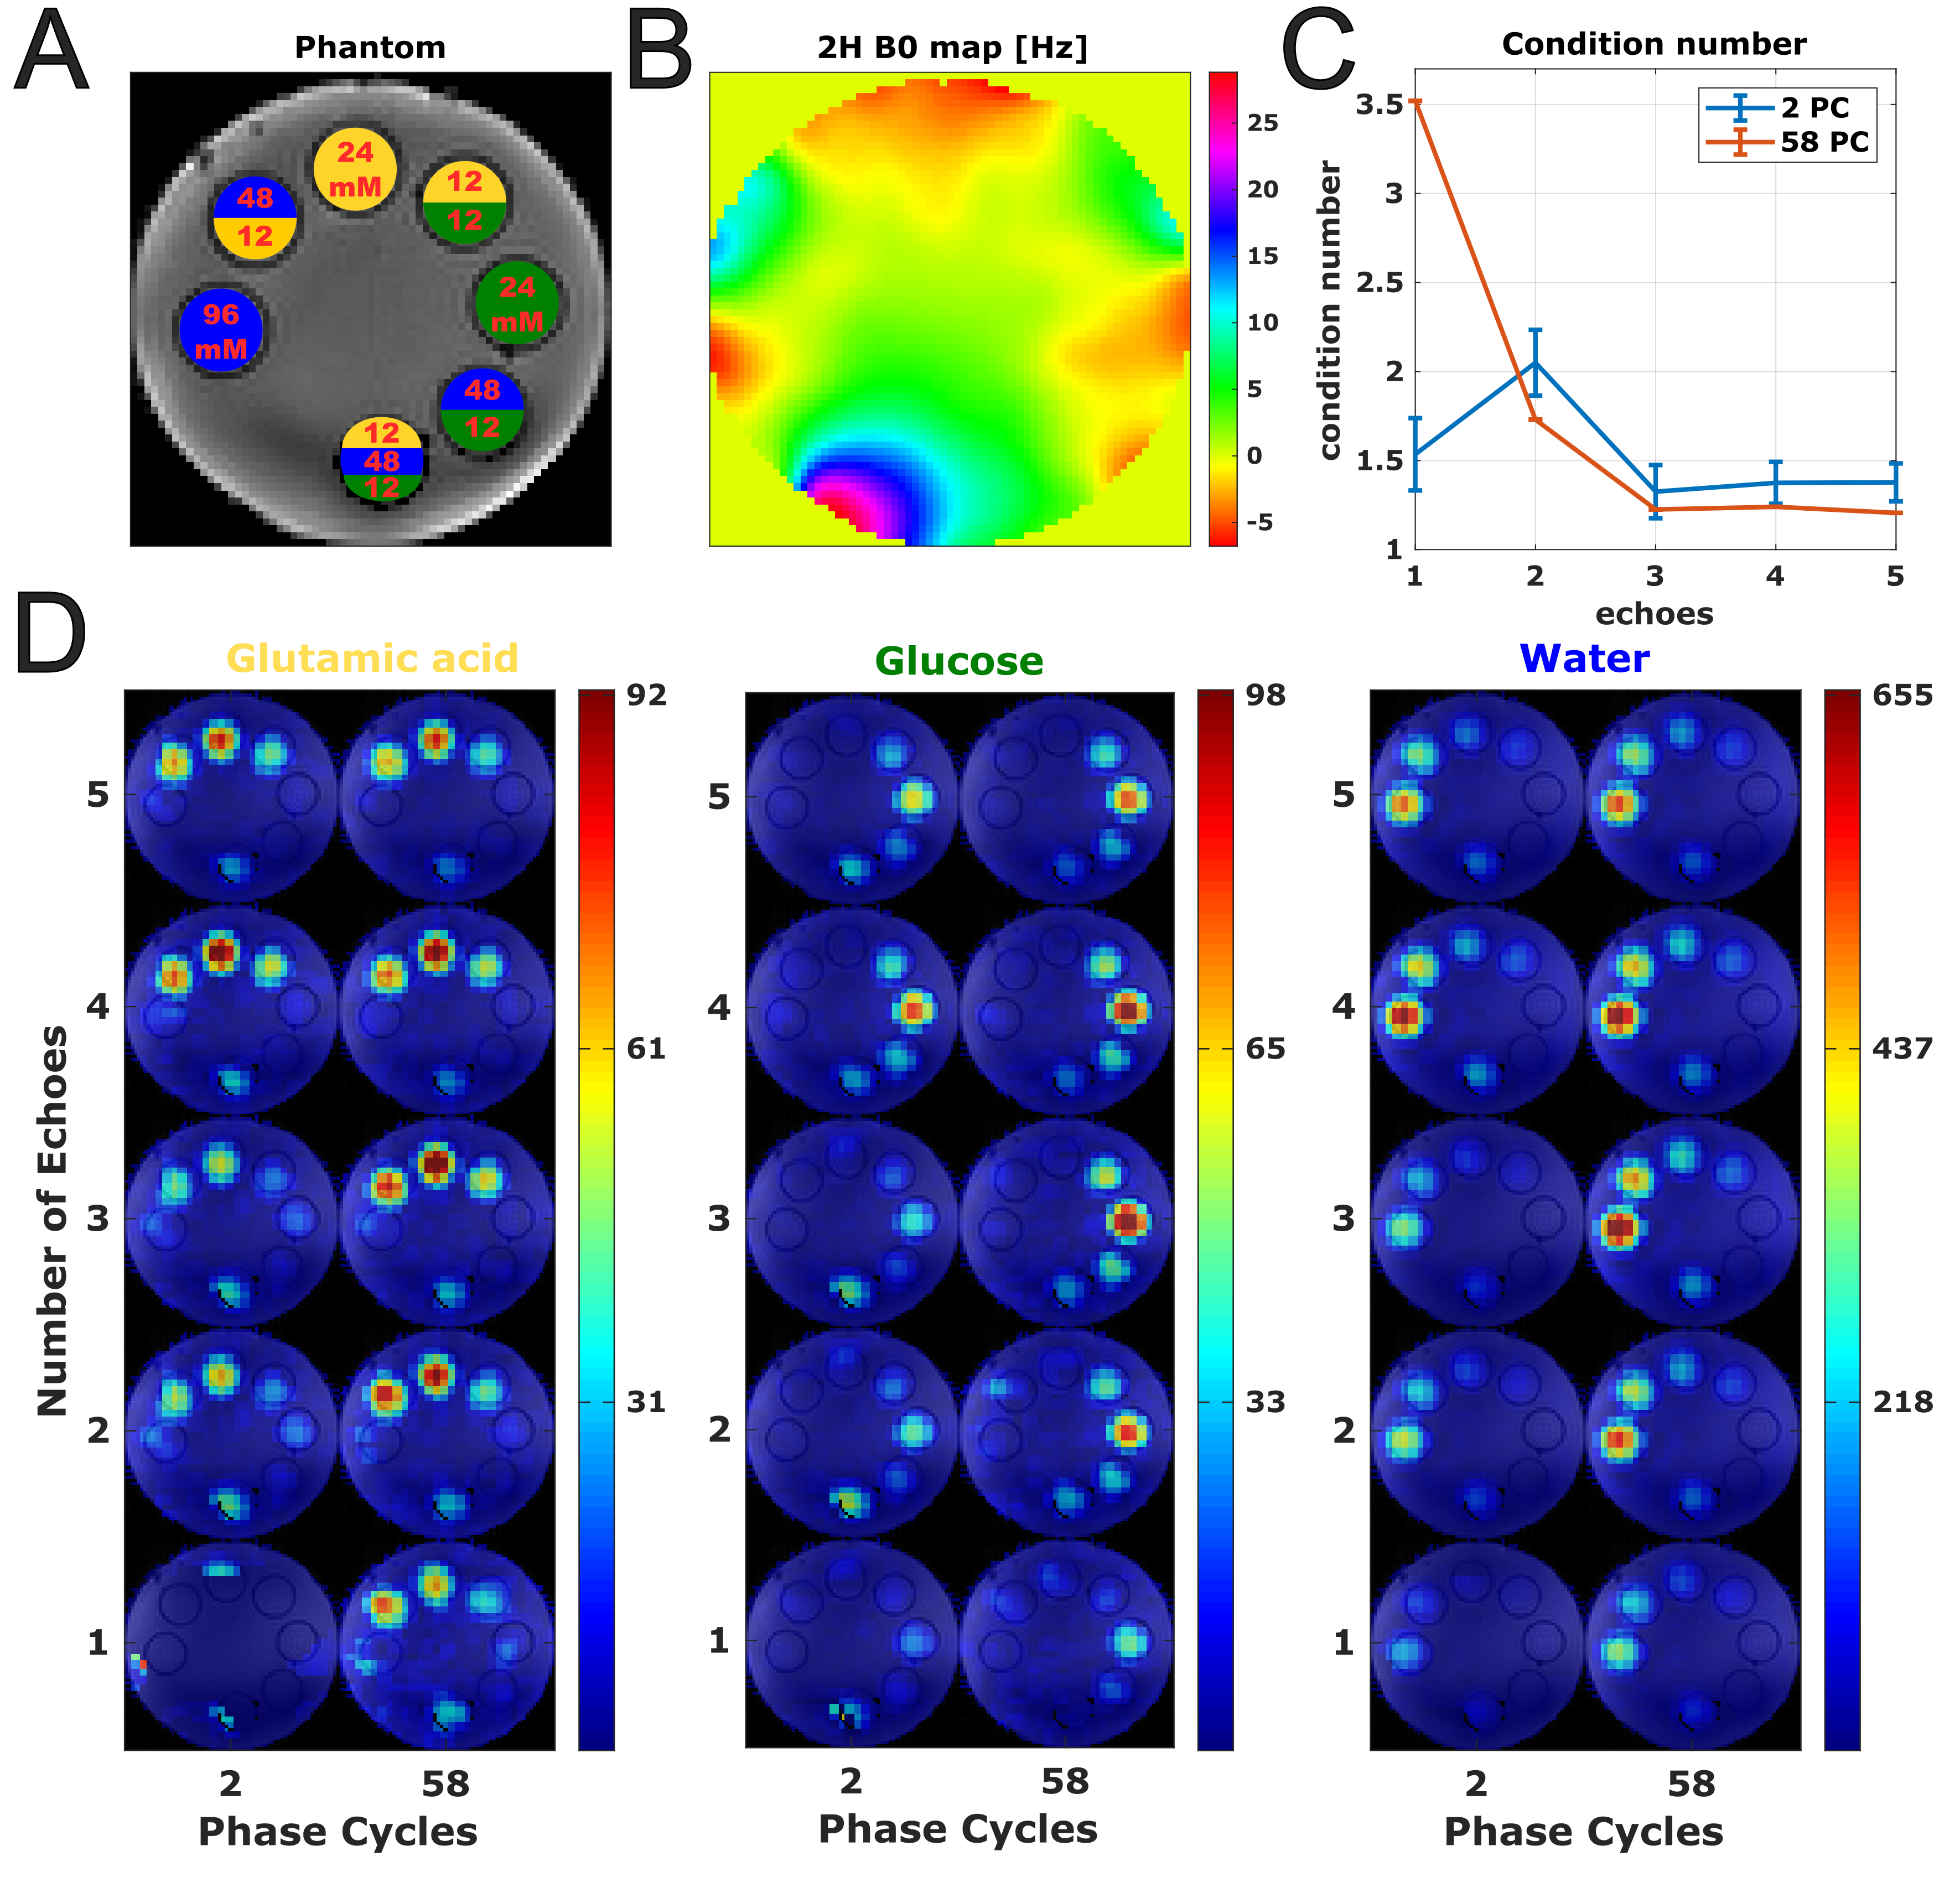
Figure 2: A) The constructed phantom with various concentrations of three deuterated compounds (yellow: Glx, green: Glucose, blue: water). B) shows the 2H B0 map calculated from the 1H B0 map. C) shows better conditioning of the model for matrix inversion with higher number of phase cycles and echoes. There is also less dispersion due to B0 off-resonance with 58 phase cycles. D) Metabolite maps at 1 mL resolution calculated from two measurements with 2 and 58 phase cycles and different numbers of echoes (echoes were retrospectively removed).
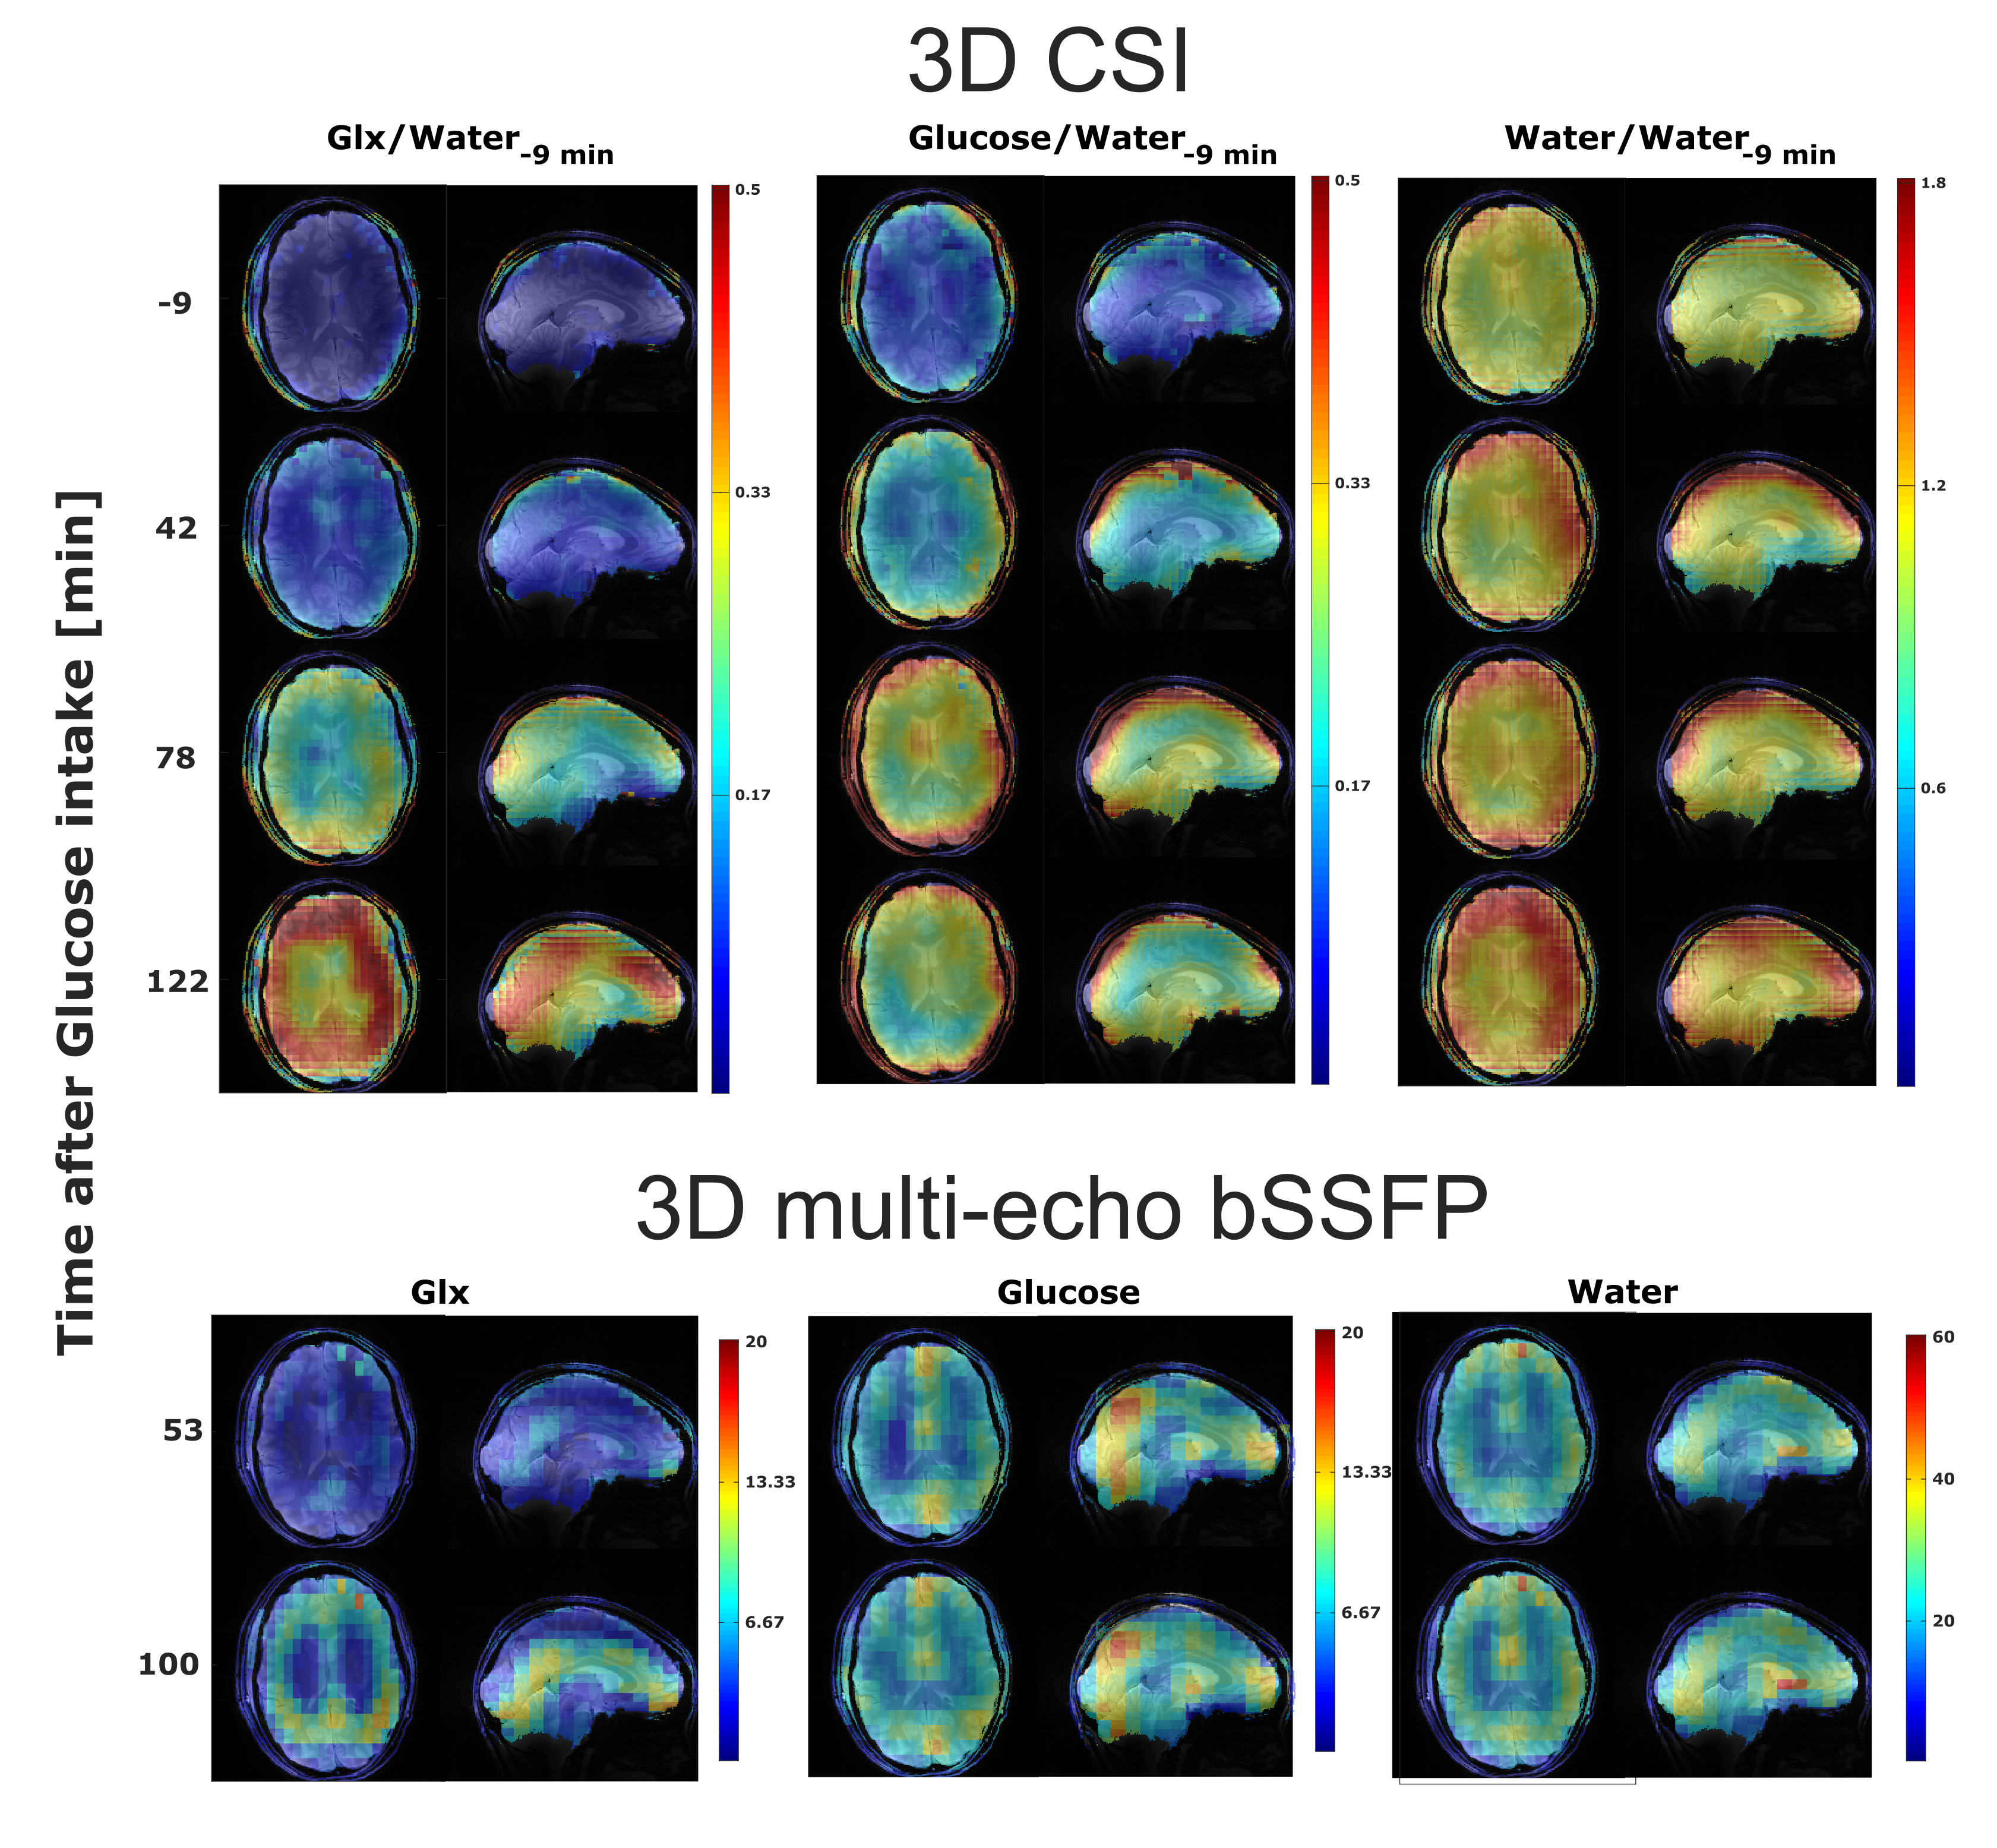
Figure 3: The maps of three deuterium metabolites (Glx (glutamate+glutamine), Glucose, and water) measured using the 1.1 mL CSI (7.89 mL from PSF calculation) and 6.75 mL bSSFP protocol at different time points after the glucose intake are overlaid over an anatomical reference. The 3D CSI data is normalized with the water image acquired before the glucose intake.
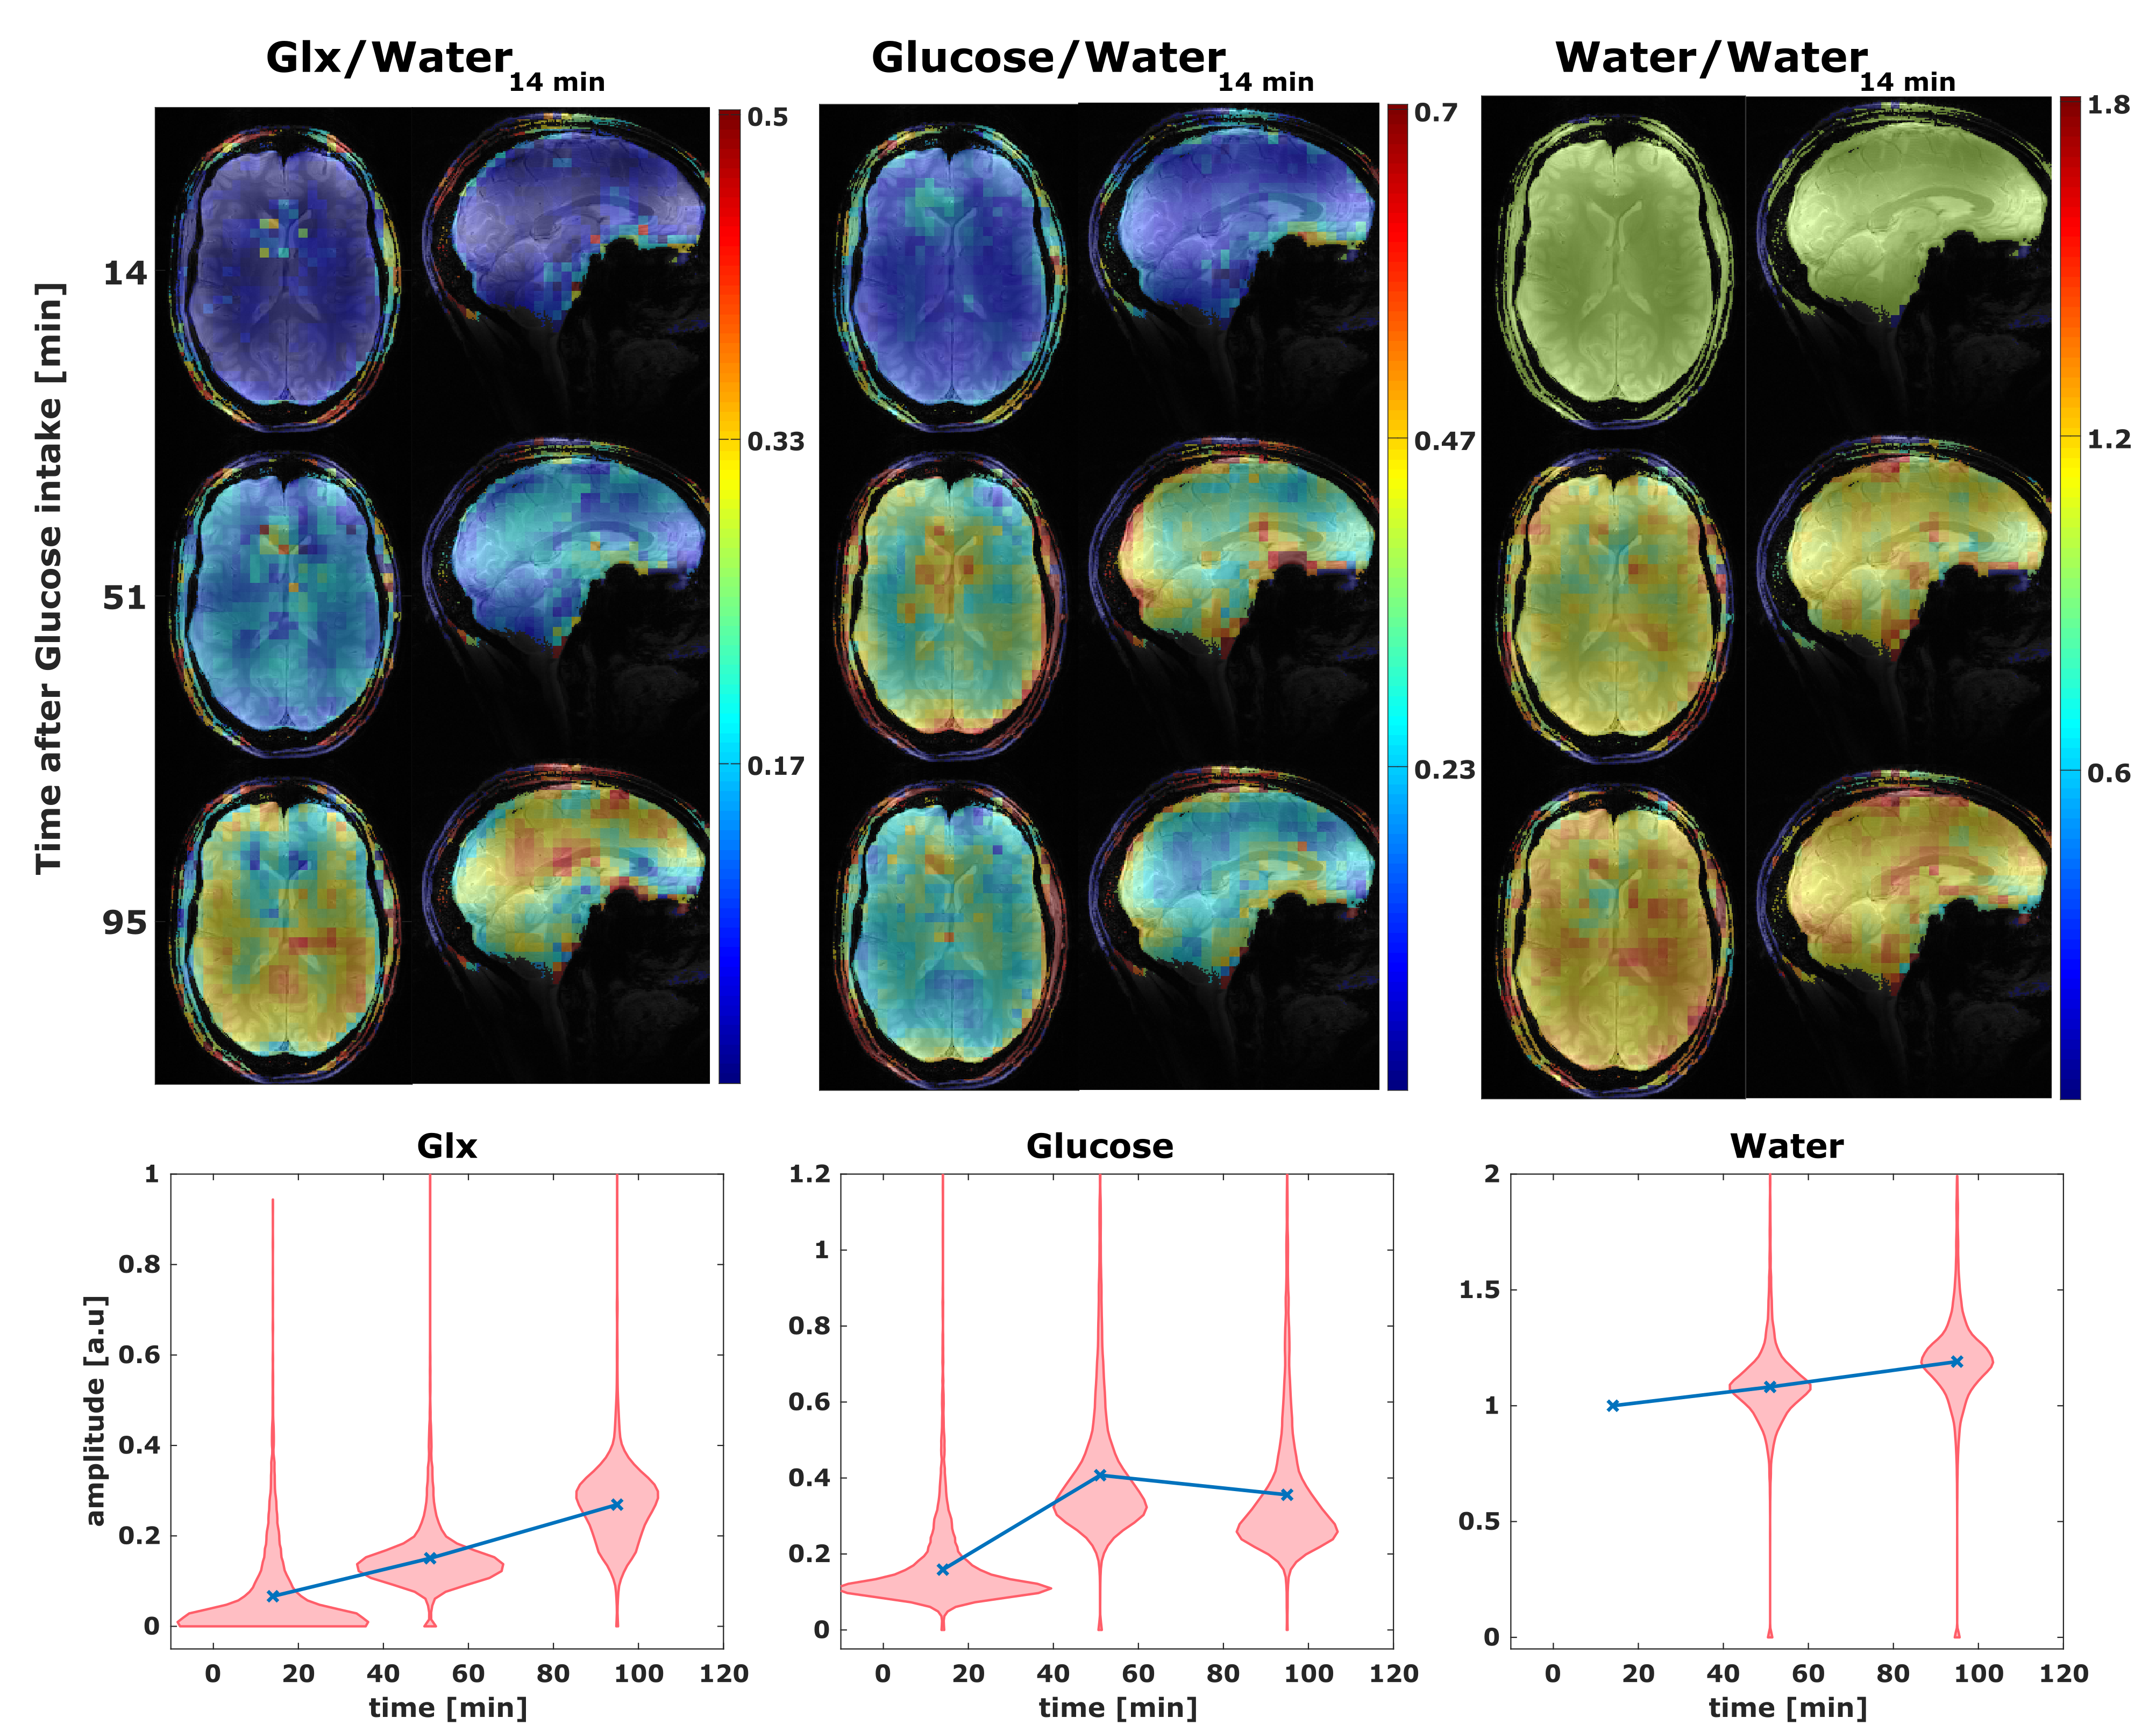
Figure 4: The high-resolution 3D CSI results acquired with a nominal spatial resolution of 0.6 mL (4.1 mL from PSF calculation). The violin plots show the time evolution of 2H metabolites across the entire brain.
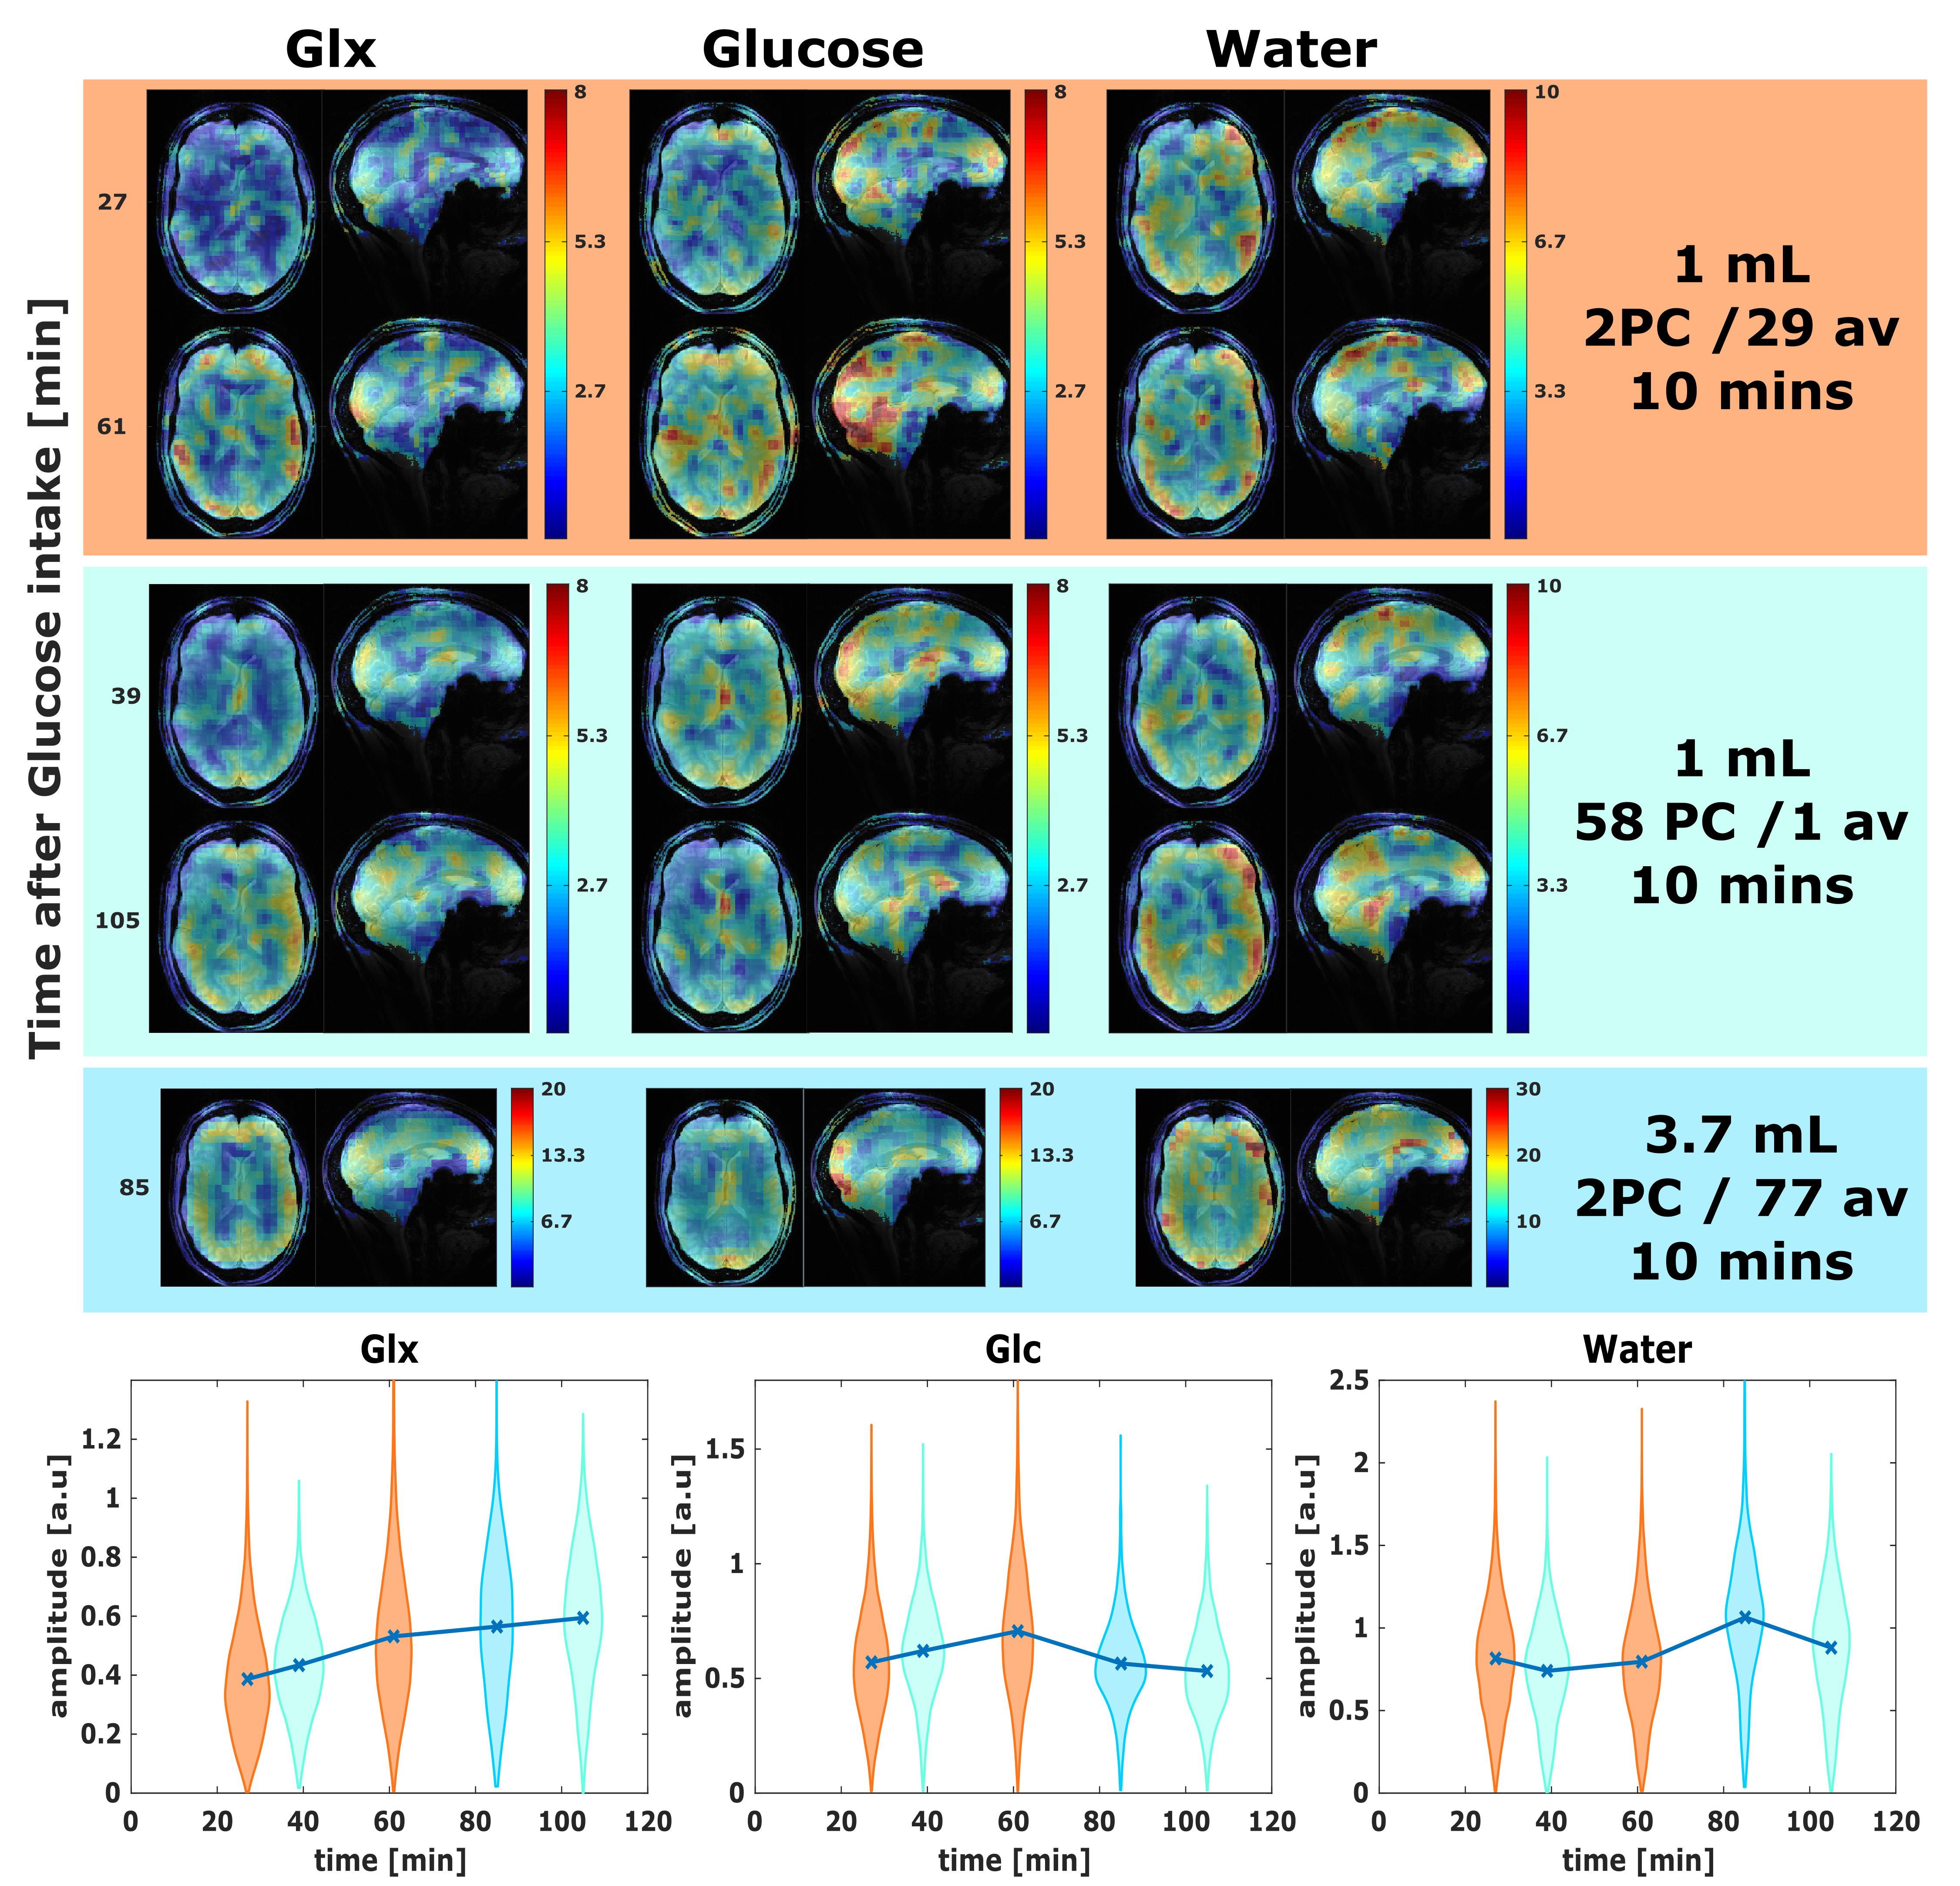
Figure 5: The bSSFP 2H maps of Glx, glucose, and water using three different protocols with variable number of phase cycles (PC), averages (av), and resolution at five time points after oral glucose intake from subject 2. The violin plots show the time evolution of 2H compounds across the entire brain. The low-resolution (3.7 mL) signal amplitudes at 85 minutes are scaled with the voxel volume to match the higher resolution results.