0223
2H imaging of [2,3,3-2H2]serine metabolism1CRUK CI, University of Cambridge, Cambridge, United Kingdom, 2Bayer, Berlin, Germany
Synopsis
Keywords: Deuterium, Deuterium
Motivation: Formate overflow linked to mitochondrial oxidative serine catabolism has been observed in various forms of cancer, and there is evidence that elevated formate concentrations promote cell infiltration.
Goal(s): Our goal was to monitor serine catabolism using deuterium metabolic imaging.
Approach: Cell experiments were conducted using a 14.1 T high-resolution NMR spectrometer and 2H experiments on tumors in vivo using a 7.0 T horizontal bore magnet.
Results: [2,3,3-2H2]serine catabolism can be monitored directly from measurements of 2H-formate production and indirectly from 2H-labeling of water.
Impact: Monitoring [2,3,3-2H2]serine metabolism holds huge potential when assessing novel cancer treatments that target the one-carbon pathway to inhibit tumor cell proliferation.
Introduction
Cancer cells meet their increased demand for nucleotide supply by boosting one-carbon (1C) metabolism, which includes upregulation of the enzymes methylenetetrahydrofolate dehydrogenase-cyclohydrolase 1 and 2 (MTHFD1 and MTHFD2). One-carbon units are essential for nucleotide synthesis and methylation1. Aberrations in one-carbon metabolism have been linked to various medical conditions, such as neural tube defects during embryonic development2 and cancer3. The non-essential amino acid serine serves as the primary source of one-carbon units in actively dividing cancer cells and relies on mitochondrial metabolism. One pathway that depends on properly functioning mitochondria is the conversion of the third carbon in serine into formate, a process often occurring at rates surpassing the one-carbon requirements for biosynthesis. Excess formate is subsequently released from the cells, a phenomenon referred to as formate overflow. Formate overflow hinges on the expression of enzymes involved in mitochondrial one-carbon metabolism and proficient oxidative phosphorylation4. We demonstrate here that tumor 1C metabolism can be assessed directly by monitoring formate accumulation and indirectly by observing an increase in HDO concentration following the injection of [2,3,3-2H2]serine. The mitochondrial forms of the enzymes serine hydroxymethyltransferase (SHMT) and methylenetetrahydrofolate dehydrogenase (MTHFD) are consistently the most overexpressed metabolic enzymes in human tumors and have emerged as potential targets for anticancer treatment, offering a promising therapeutic strategy5.Methods
Cell experiments were conducted using a 14.1 T high-resolution NMR spectrometer and experiments on tumors in vivo using a 7.0 T horizontal bore magnet. Serial 2H spectra were acquired from patient-derived glioblastoma (GB)-bearing mice using a pulse-acquire sequence with a 2 ms BIR4 adiabatic excitation pulse and were also imaged using a fast 2H chemical shift imaging sequence with a time resolution of 5 minutes, and a spatial resolution of 3 x 3 x 9 mm6, following an injection of [2,3-2H2]serine (1 g/kg).Results
Five hours after [2,3,3-2H2]serine addition, medium from S2 cells, which RNA sequencing data showed are a neural progenitor-like cell with an oxidative metabolic phenotype, showed increased formate production (Figure 1 B,D) when compared to medium from A11 cells, which are a mesenchymal subtype with a glycolytic metabolic phenotype (Figure 1 A,C). The deuterium-labeled formate concentration was 0.35 ± 0.2 mM in the S2 cell suspension as compared to 0.13 ± 0.05 mM in the A11 cell suspension (P = 0.014, n = 3). There was significantly higher expression of SHMT2, the mitochondrial isoform of SHMT, in S2 tumors (Figure 2B) as well as increased expression levels of the mitochondrial content marker TOMM20 (Figure 3), In contrast, the expression levels of the transmembrane transporters for serine were similar in both tumor models (as indicated in Figure 4). When the mitochondrial enzymes SHMT2 and MTHFD2 were inhibited, there was a significant reduction in 2H-formate and HDO concentrations, whereas inhibiting the cytosolic variant of SHMT, SHMT1, had no effect (Figure 5). Surface-coil localized 2H MR spectroscopy and spectroscopic imaging were used to assess the production of HDO following [2,3,3-2H2]serine injection in orthotopically implanted GB tumors following injection of labelled serine (1g/kg) into tumor-bearing mice (Figures 6 - 8). The HDO production rate in S2 tumors was ~2.6x higher within the first 20 min post-[2,3,3-2H2]serine injection compared to that in A11 tumors.Discussion
Deuterium metabolic imaging (DMI) can be used to investigate [2,3,3-2H2]serine metabolism in GB tumors in vivo. Formate production depends on the mitochondrial enzymes SHMT2 and MTHFD2, with the latter utilising NADP+ as a coenzyme, which leads to loss of the deuterium label into water7. Consequently, the assessment of serine metabolism can be accomplished either directly by monitoring formate production, which was possible in cell suspension, or indirectly by measuring the increase in water labelling, which enabled imaging of serine metabolism in vivo. Inhibition of the mitochondrial isoforms, SHMT2 or MTHFD2 resulted in a significant reduction in both 2H-formate and HDO production in vitro, whereas the inhibition of the cytosolic form of SHMT, SHMT1, had no effect. To minimize the effect of HDO wash-in from other organs, the rate of HDO production was monitored during the initial 20 minutes post serine injection. As 2H-formate has a long T1 of over 1 s, we were unable to directly detect the accumulation of formate in vivo.Conclusion
We have demonstrated that 2H MRS(I) can be used to monitor [2,3,3-2H2]serine metabolism in vivo, which could be particularly useful when assessing novel cancer treatments that target the one-carbon pathway to inhibit tumor cell proliferation.Acknowledgements
The authors acknowledge the support of the Cancer Research UK Cambridge Institute core facilities, in particular the biological resources unit and preclinical imaging sections. We would also like to thank Mike Mitchell, Toby Fewster, Sarah McGuire, and Madhu Basetti for their help. The work was supported by grants from Cancer Research UK (C197/A17242, C197/A16465, C9685/A25177). F.H. was in receipt of a Cambridge European Scholarship from the Cambridge Trust.References
(1) Cuthbertson CR, Arabzada Z, Bankhead A 3rd, Kyani A, Neamati N. A Review of Small-Molecule Inhibitors of One-Carbon Enzymes: SHMT2 and MTHFD2 in the Spotlight. ACS Pharmacol Transl Sci. 2021;4(2):624-646. Published 2021 Mar 1. doi:10.1021/acsptsci.0c00223
(2) Tibbetts AS, Appling DR. Compartmentalization of Mammalian folate-mediated one-carbon metabolism. Annu Rev Nutr. 2010;30:57-81. doi:10.1146/annurev.nutr. 012809.104810
(3) Locasale JW. Serine, glycine and one-carbon units: cancer metabolism in full circle. Nat Rev Cancer. 2013;13(8):572-583. doi:10.1038/nrc3557
(4) Meiser J, Schuster A, Pietzke M, et al. Increased formate overflow is a hallmark of oxidative cancer. Nat Commun. 2018;9(1):1368. Published 2018 Apr 10. doi:10.1038/s41467-018-03777-w
(5) Green AC, Marttila P, Kiweler N, et al. Formate overflow drives toxic folate trapping in MTHFD1 inhibited cancer cells. Nat Metab. 2023;5(4):642-659. doi:10.1038/s42255-023-00771-5
(6) Kreis F, Wright AJ, Hesse F, Fala M, Hu DE, Brindle KM. Measuring Tumor Glycolytic Flux in Vivo by Using Fast Deuterium MRI. Radiology. 2020;294(2):289-296. doi:10.1148/radiol.2019191242
(7) Zhang Z, Chen L, Liu L, Su X, Rabinowitz JD. Chemical Basis for Deuterium Labeling of Fat and NADPH. J Am Chem Soc. 2017;139(41):14368-14371. doi:10.1021/jacs.7b08012
Figures
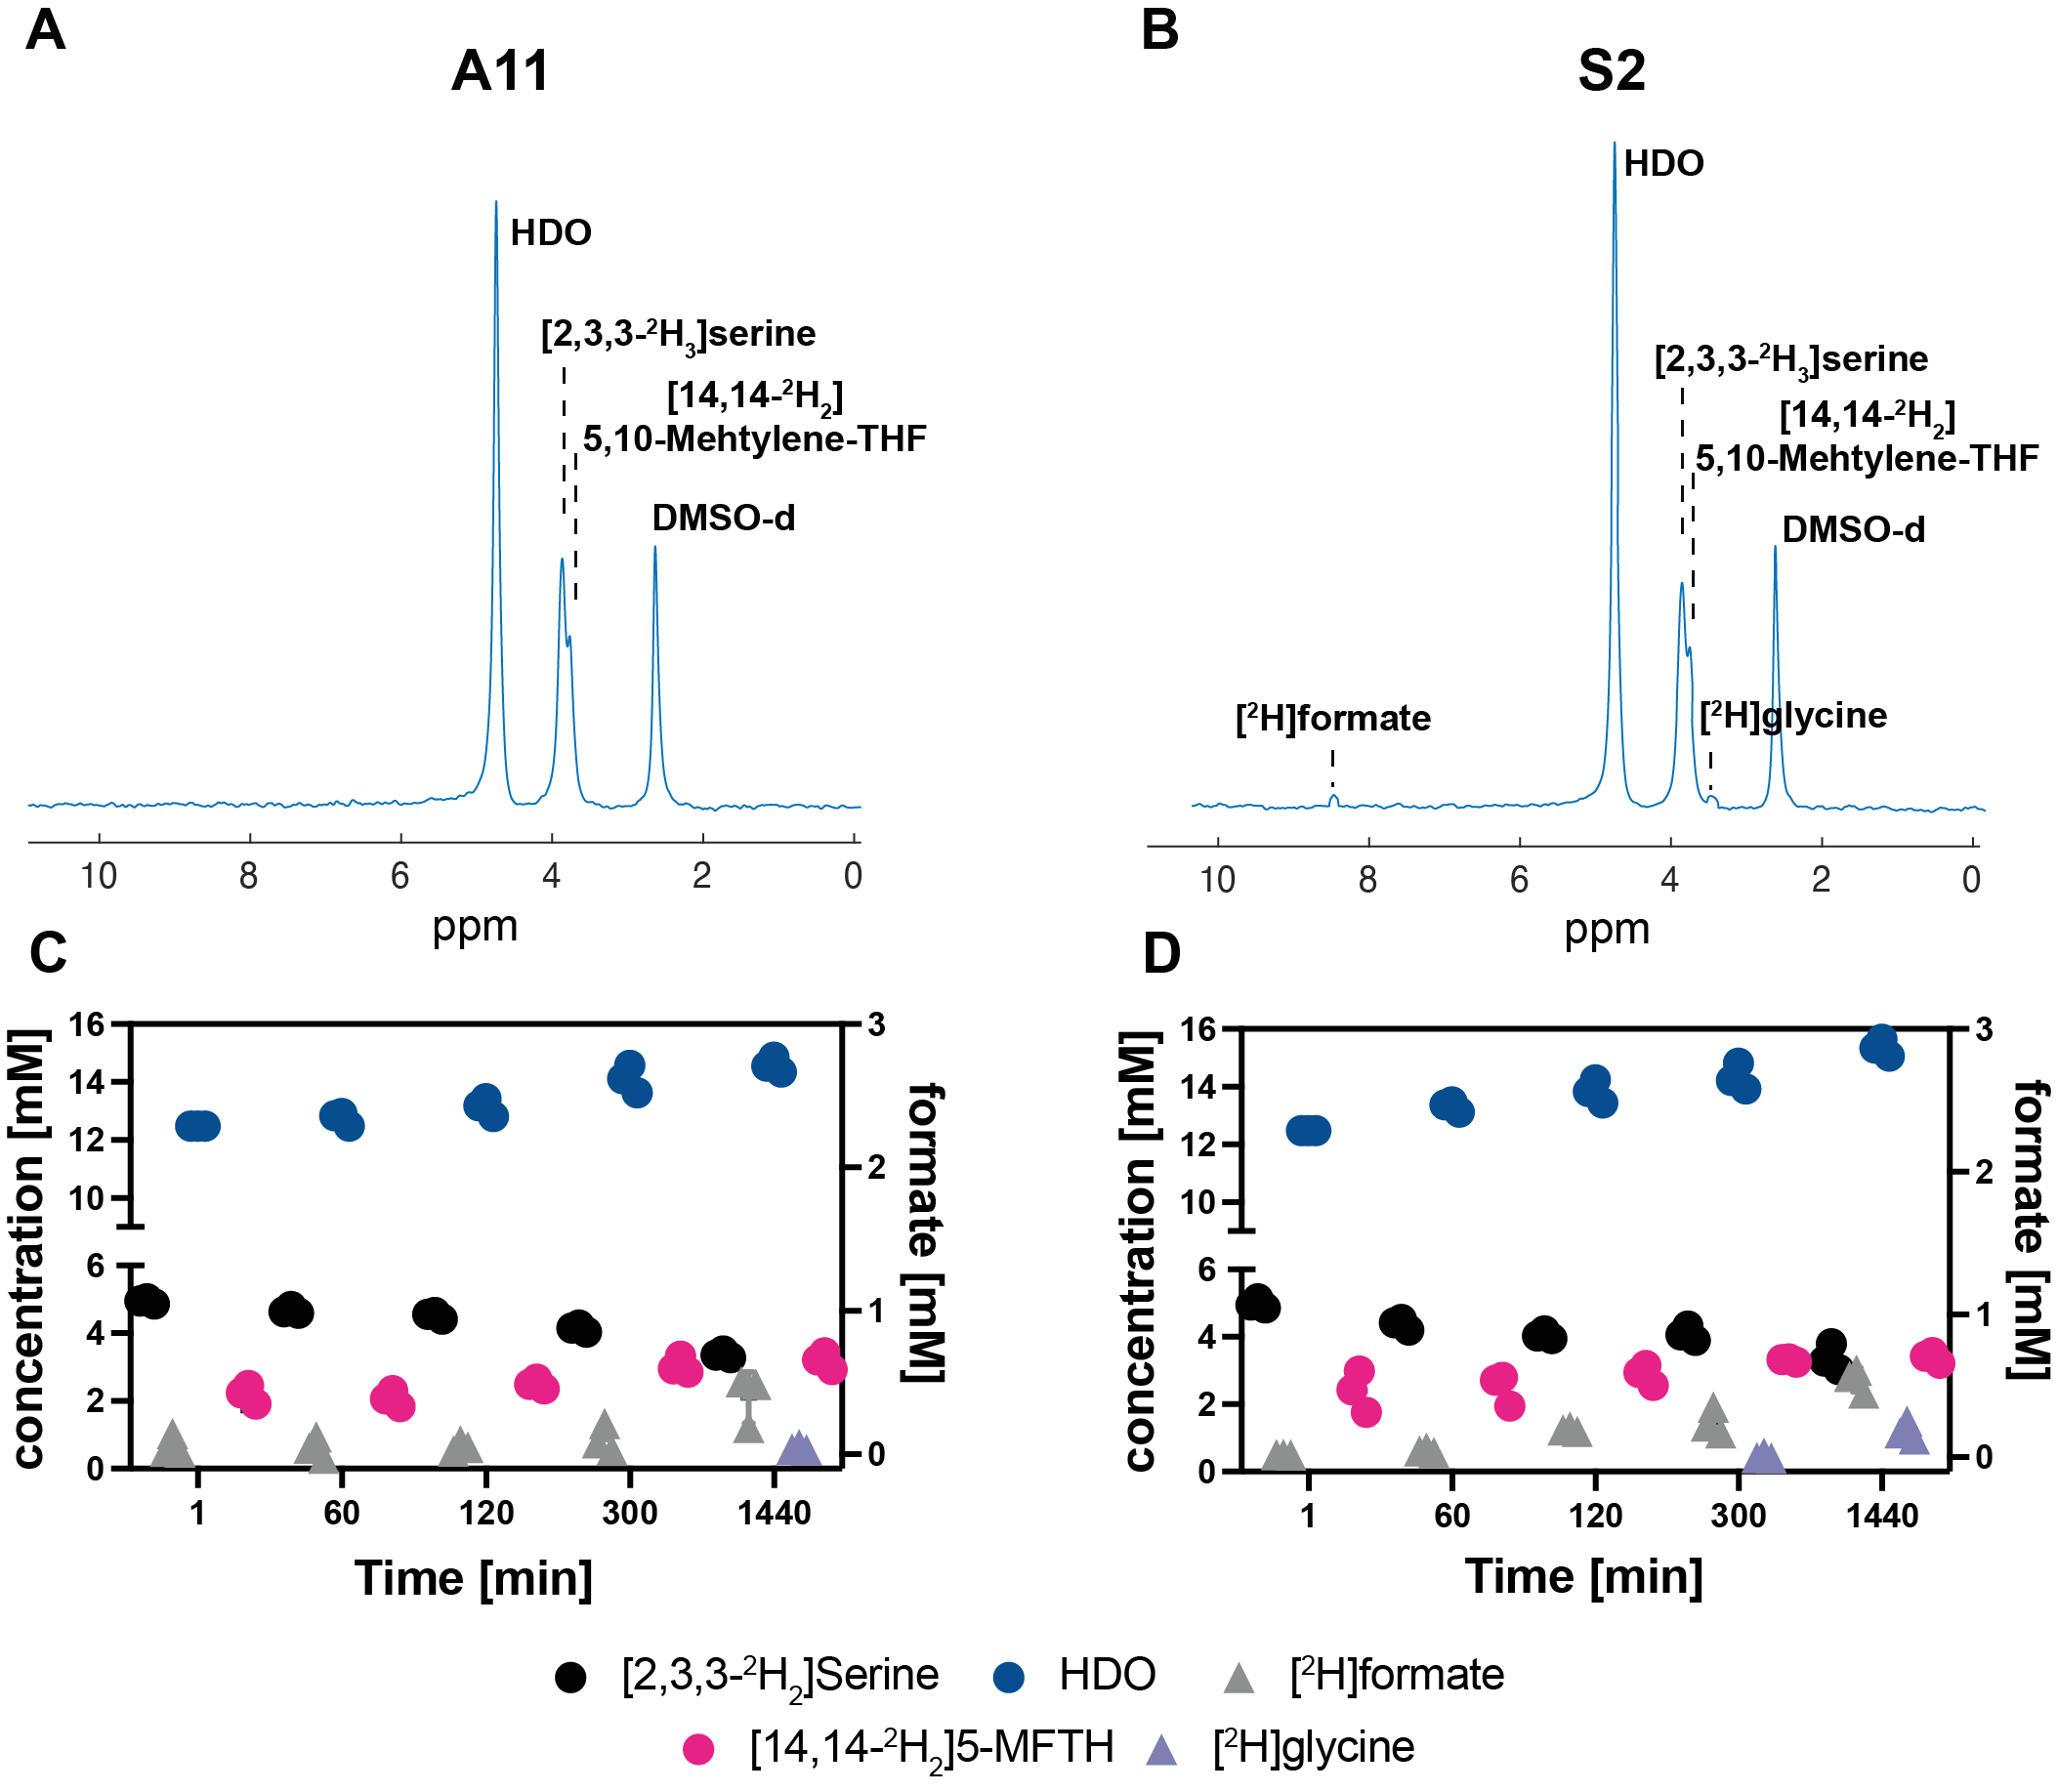
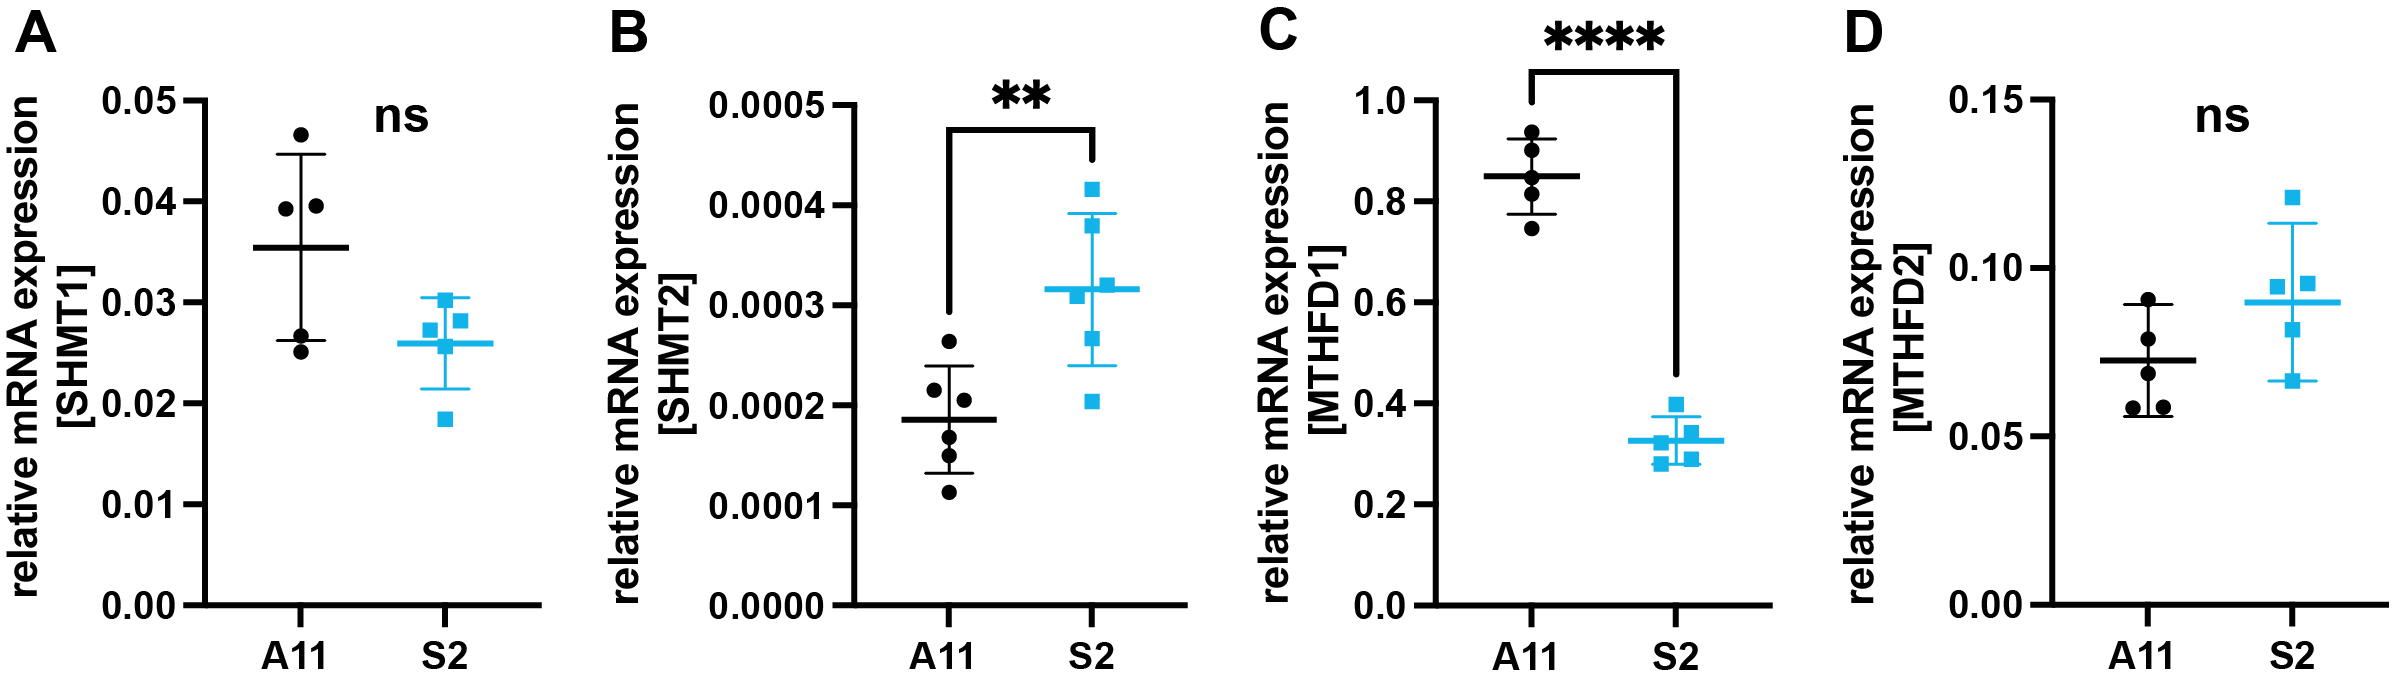
Figure 2: SHMT1,2 and MTHFD1/2 expression in A11 and S2 tumor extracts were assessed by quantitative real-time PCR. For normalisation, Ct values of beta-actin were subtracted from Ct values of SHMT1,2 and MTHFD1/2. Experiments were done in triplicate, data are presented as means ± SD, **P < 0.01, ****P < 0.0001.
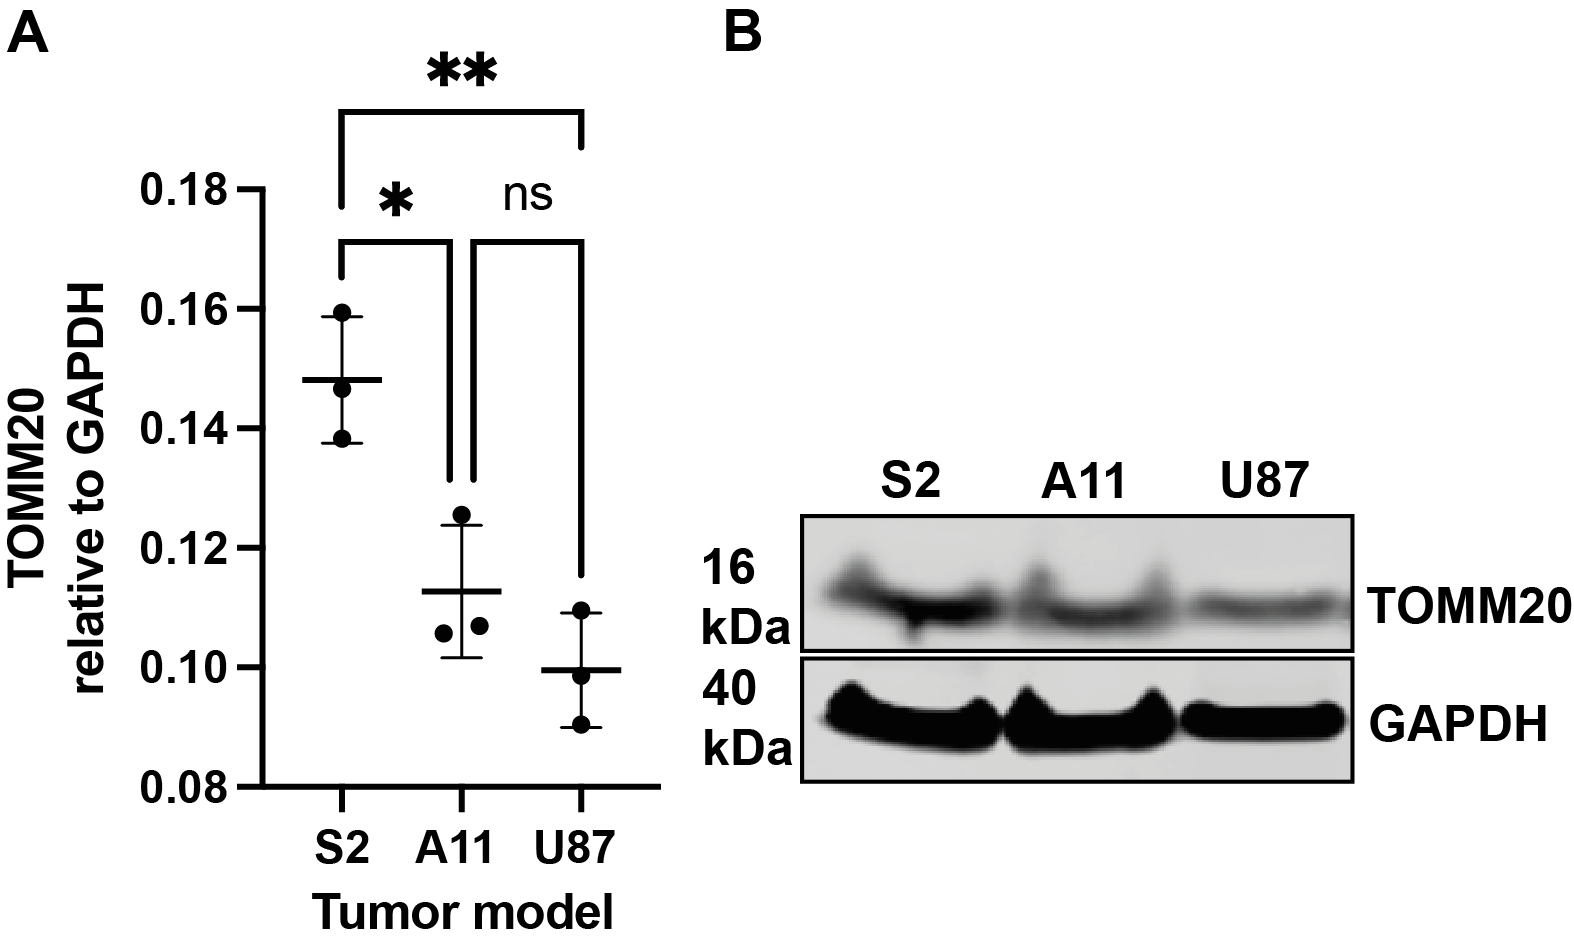
Figure 3: The expression levels of TOMM20 were evaluated in untreated S2, A11 and U87 (A,B) tumors. Mean ± SD, n = 3, *P <0.05, **P <0.005.
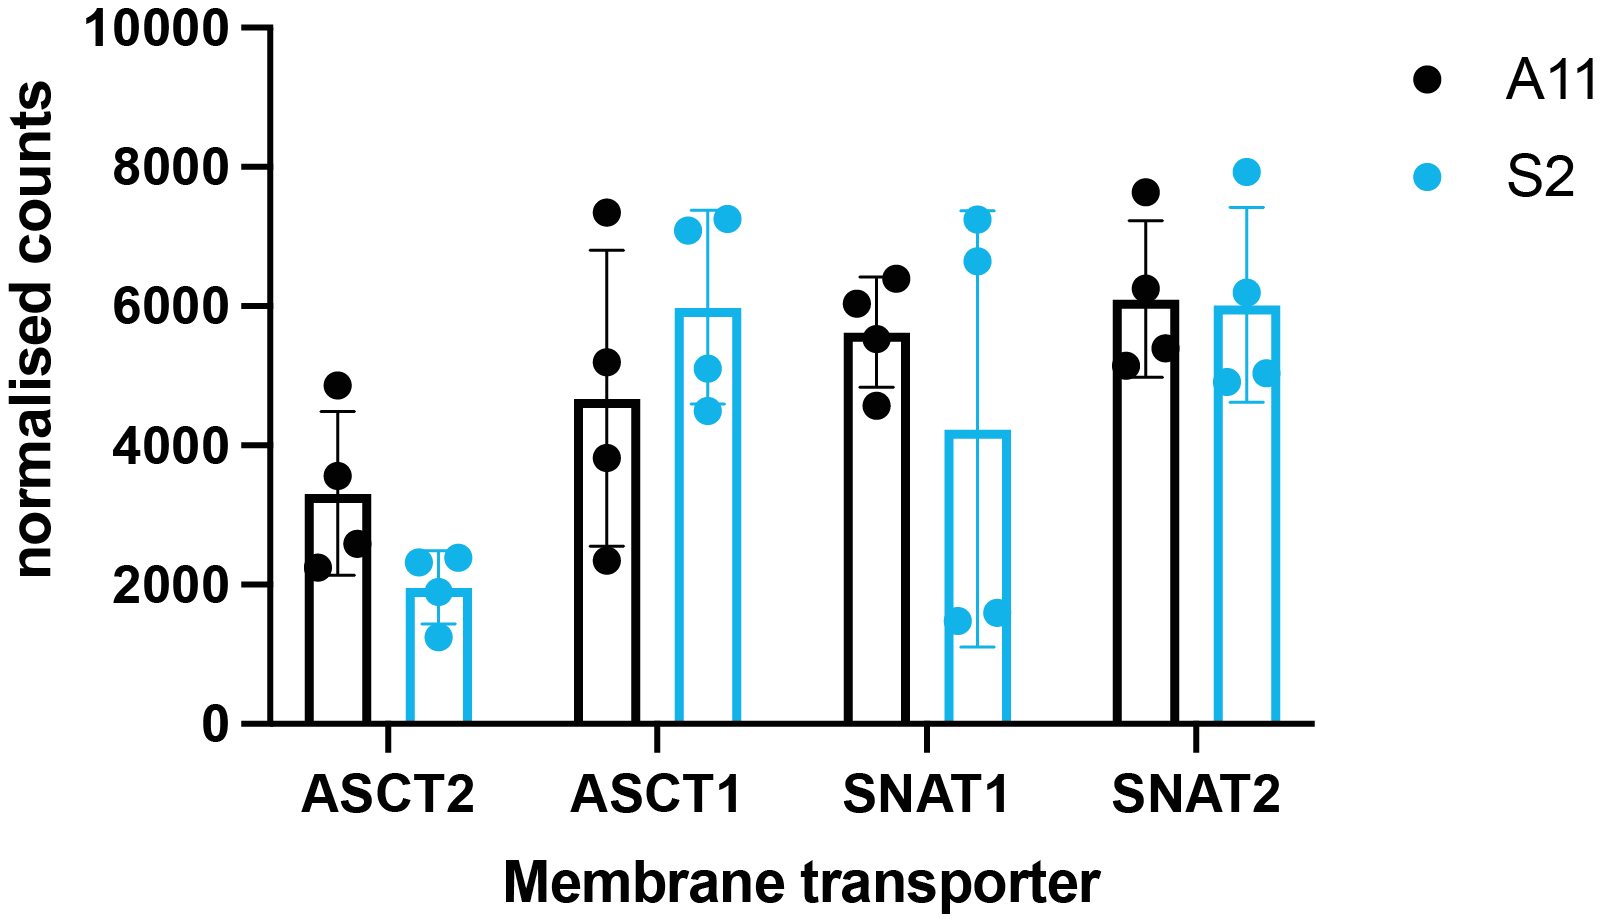
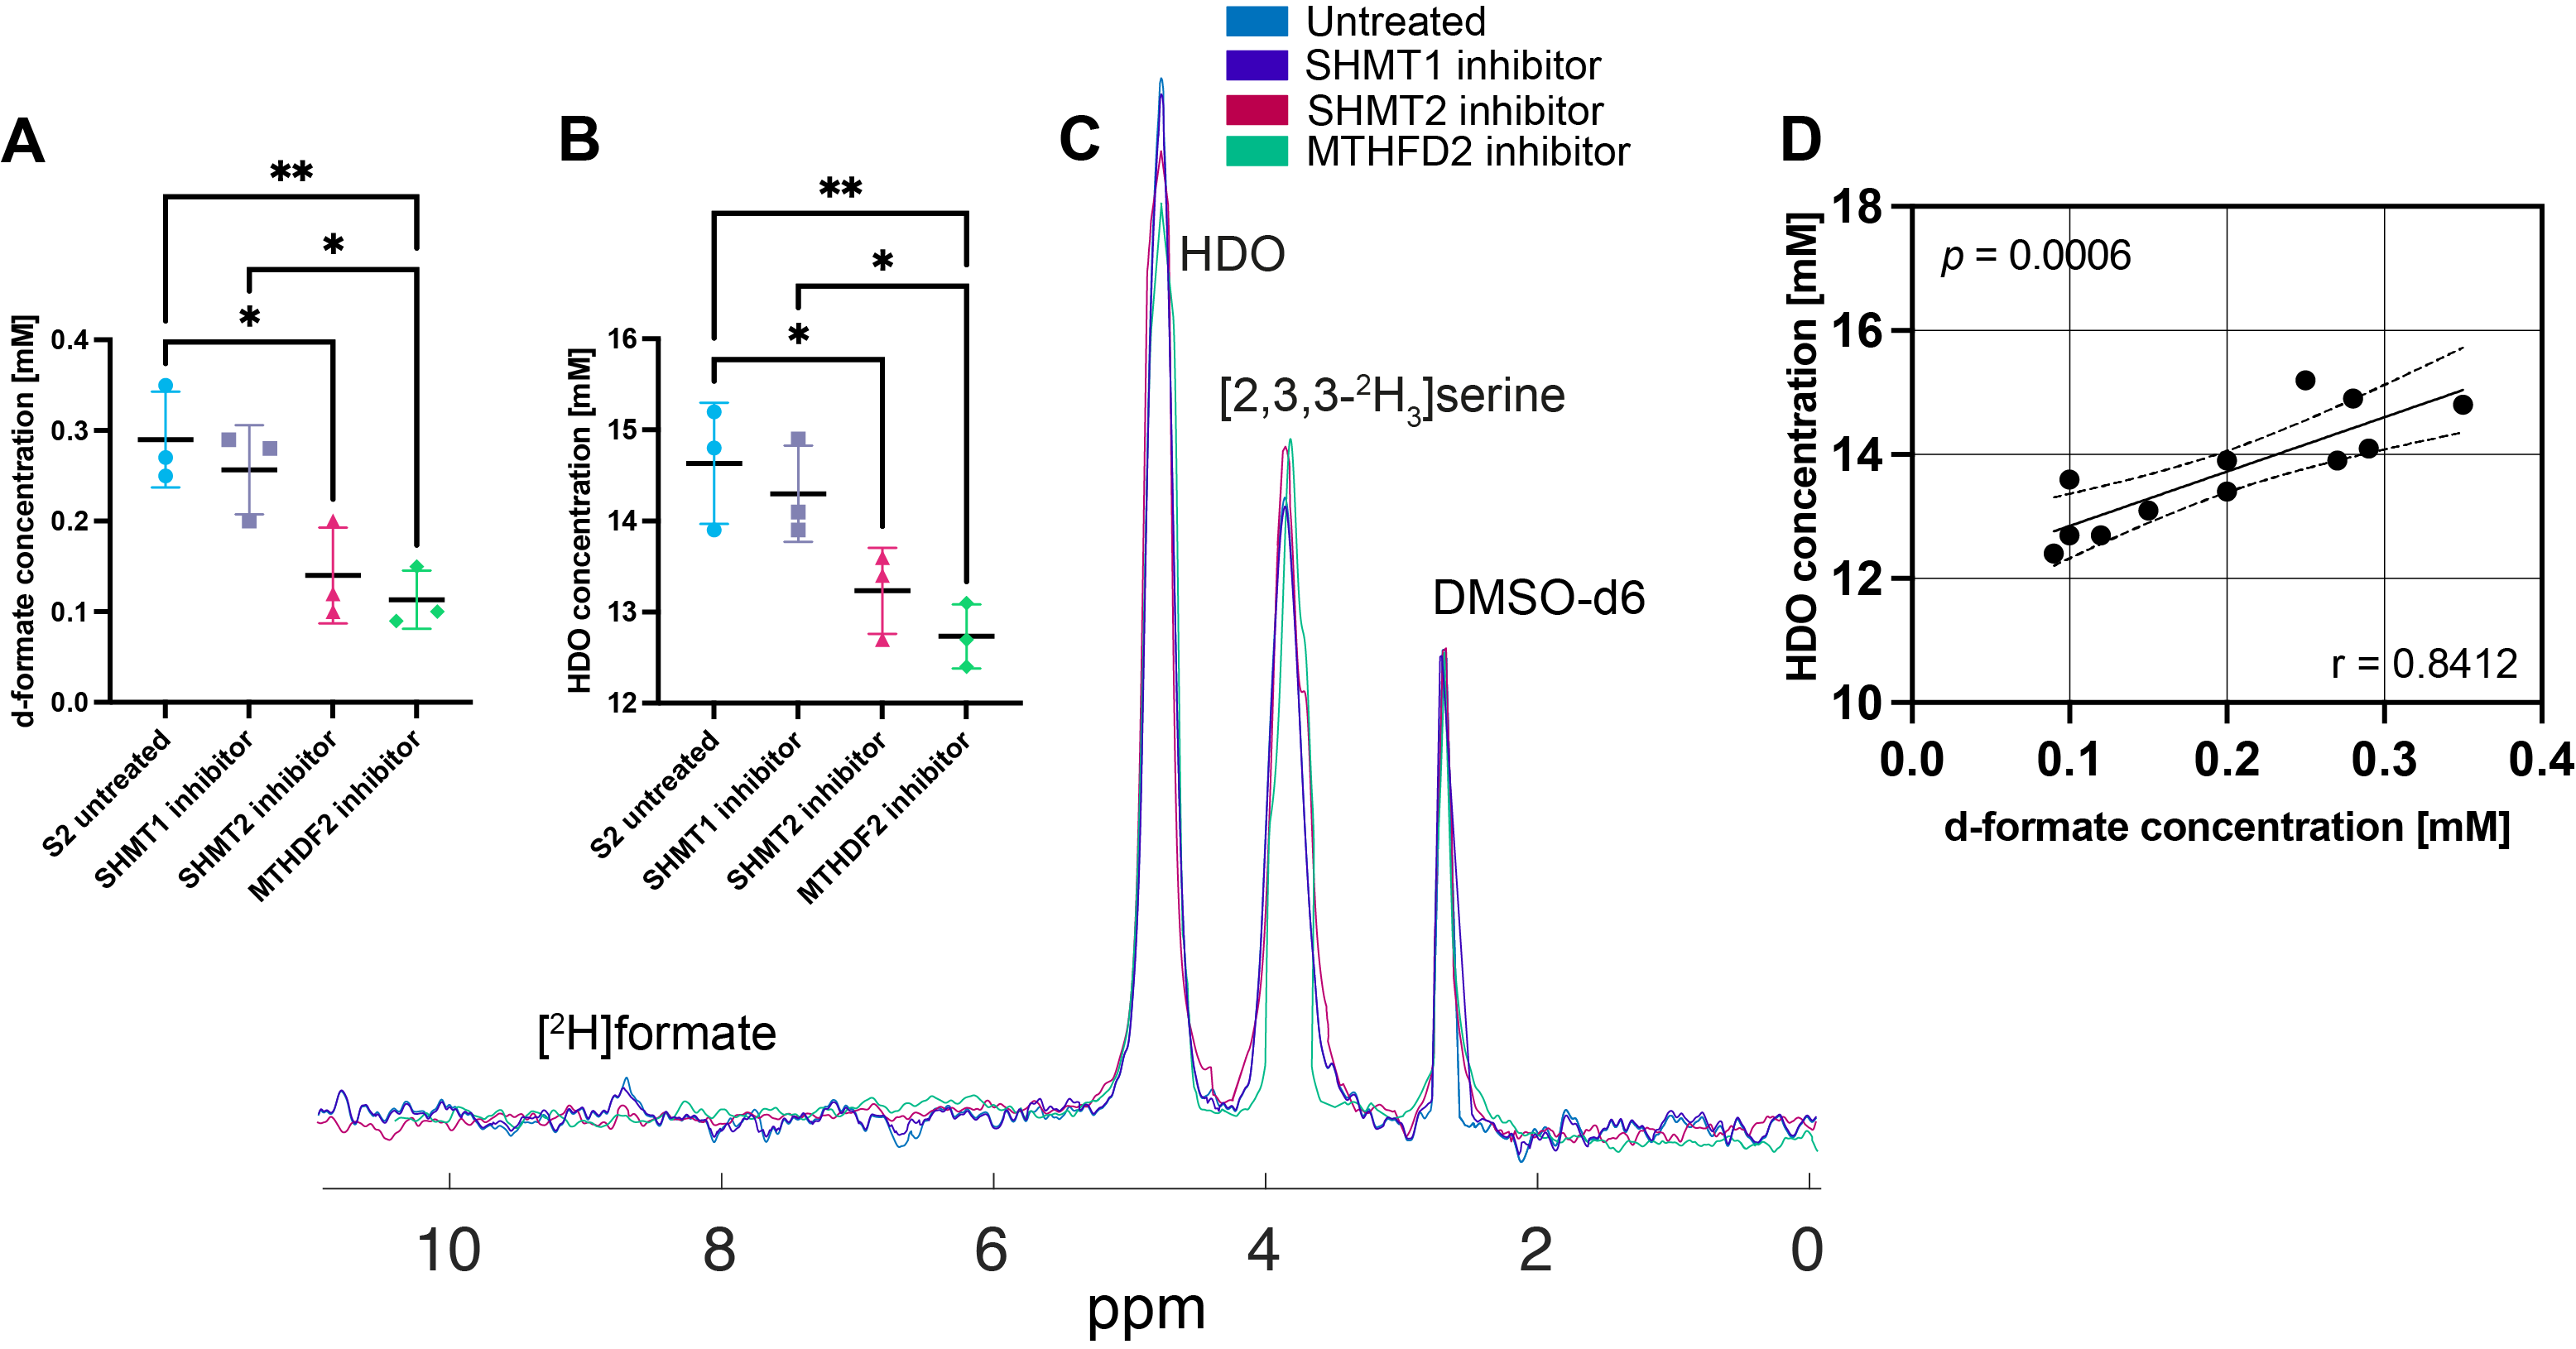
Figure 5: 2H-formate (A) and HDO (B) concentrations derived from 2H NMR spectra (C) of untreated S2 cell culture medium and after inhibition of SHMT1, SHMT2 and MTHDF2, 5 h after the addition of 5 mM [2,3,3-2H2]serine. DMSO-d6 was used as a reference. Pearson correlation analysis of HDO and formate concentrations (D). Two-tailed, Pearson p and r values are shown.
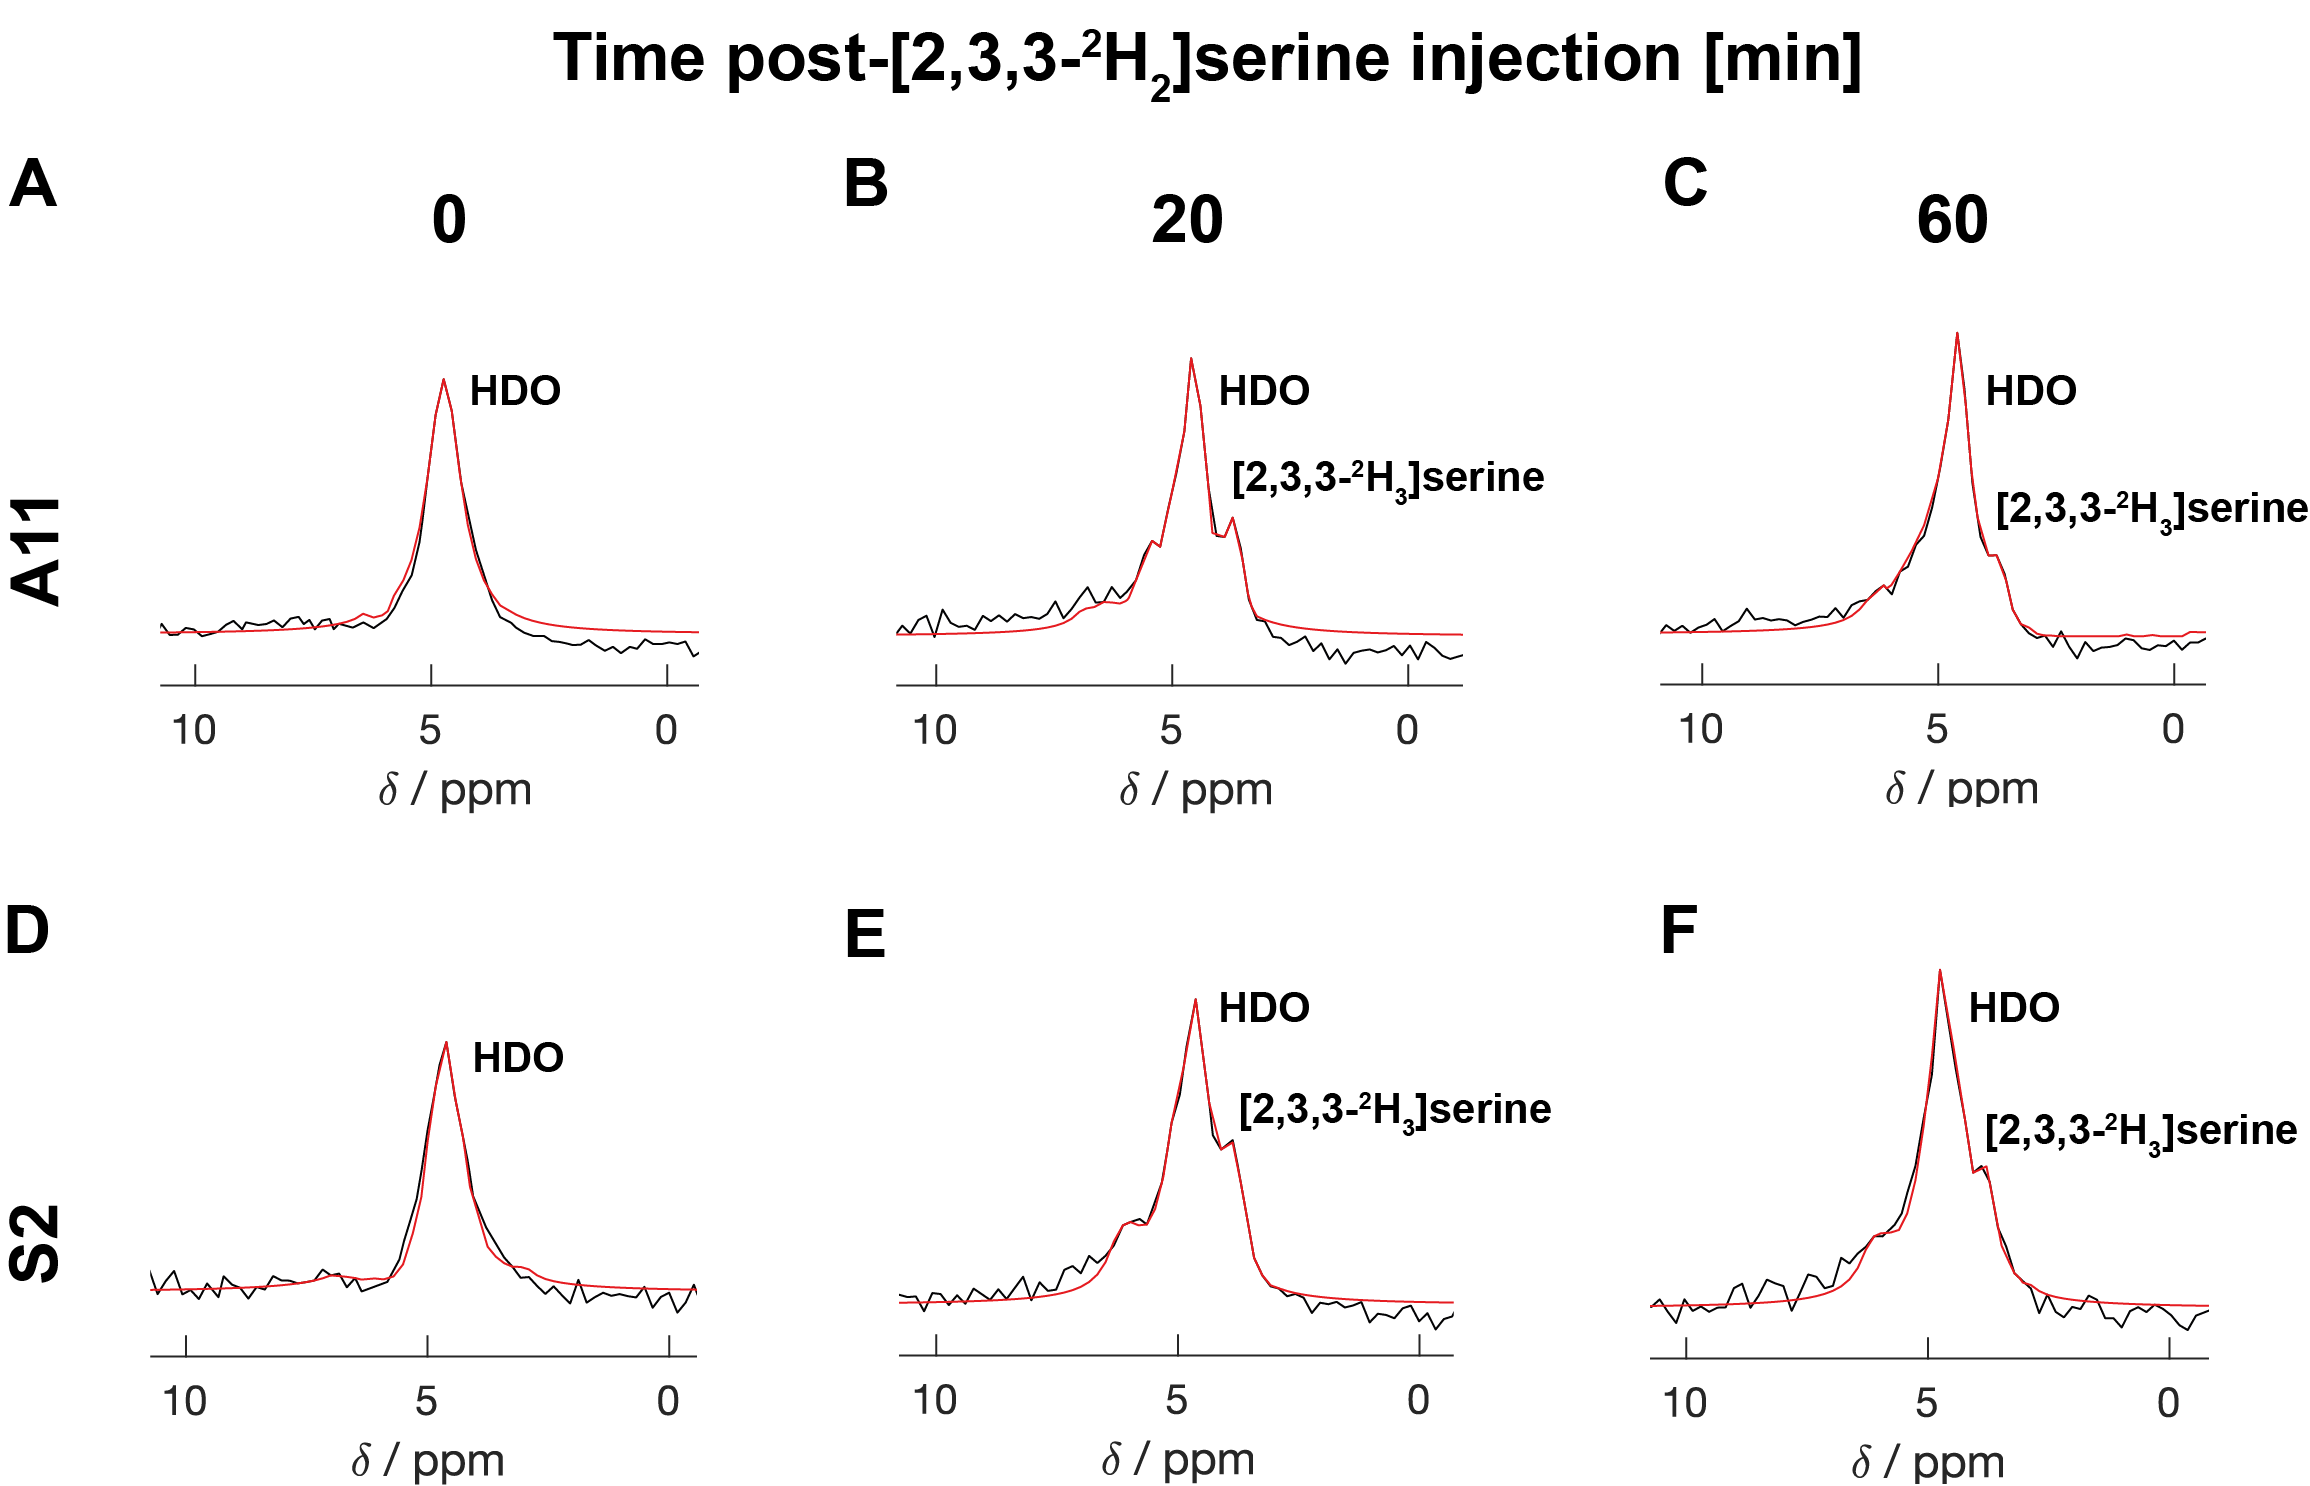
Figure 6: 2H MR spectroscopic measurements of labelled serine and water concentrations in A11 (A, B, C) and S2 (D,E,F) tumours before, 20- and 60 min post- [2,3,3-2H2]serine injection. The [2,3,3-2H2] serine injection (1 g/kg) started 5 min after the start of acquisition of the first spectrum. The peaks were fitted individually using prior knowledge.
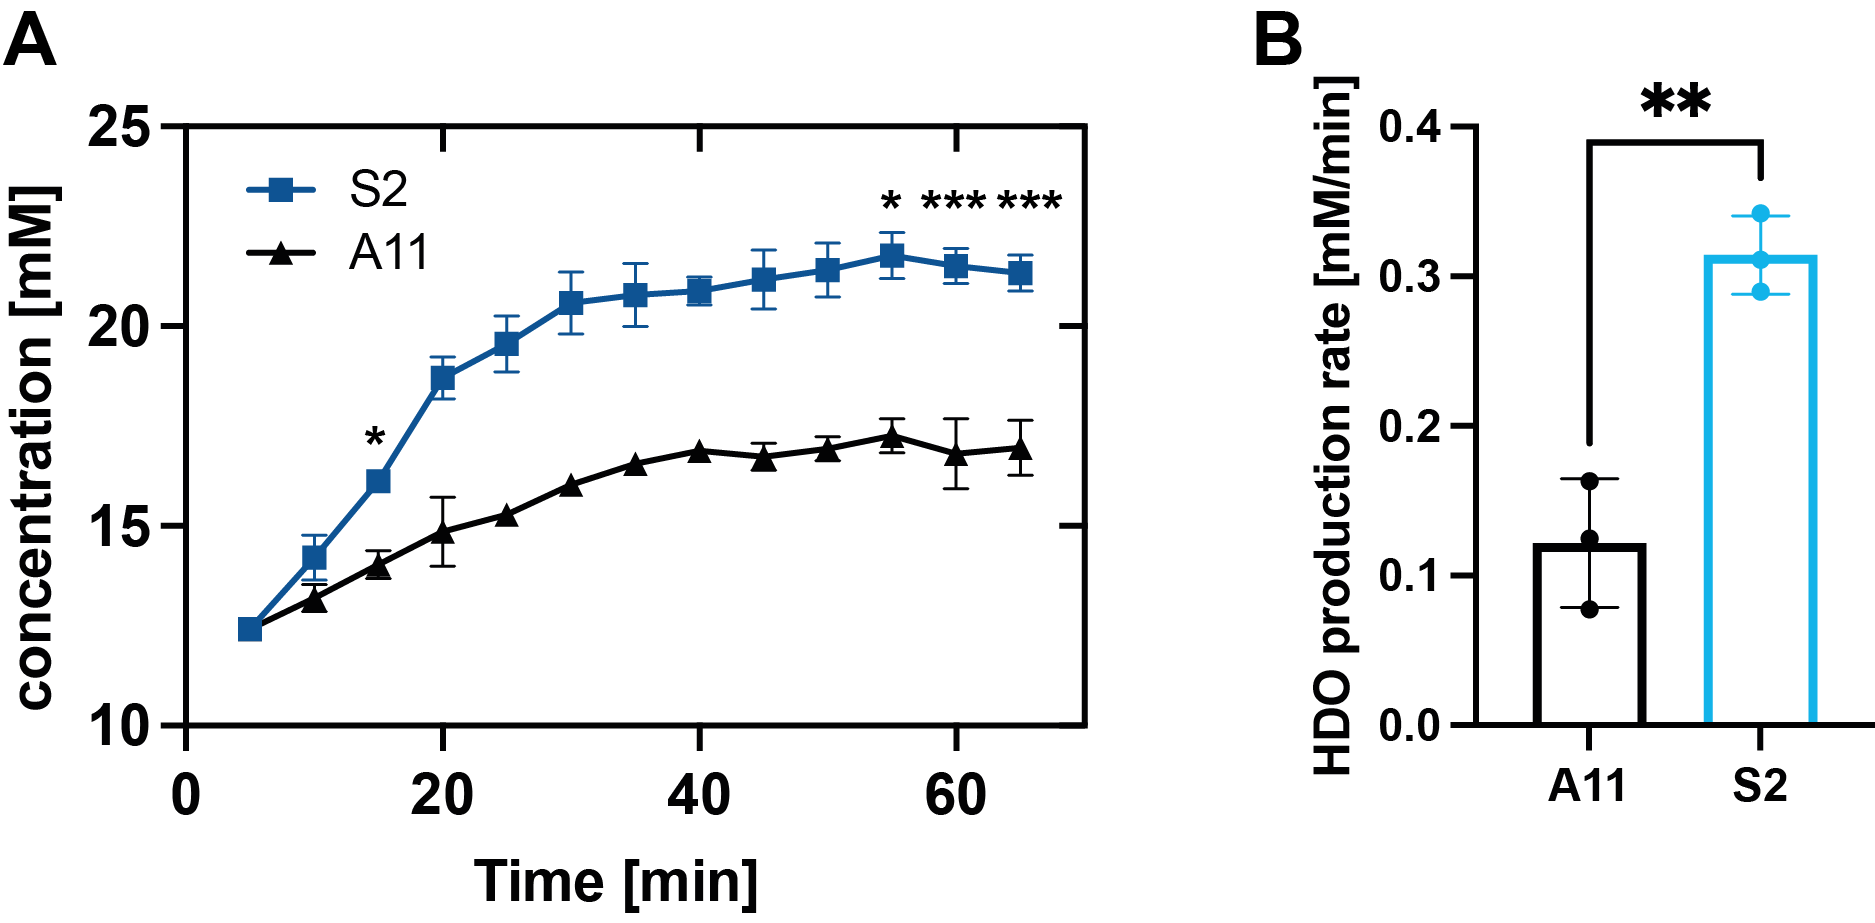
Figure 7: HDO concentrations in A11 and S2 tumors following [2,3,3-2H2]serine injection (1 g/kg) (A). (n=3, *P<0.05, **P< 0.01, ***P < 0.001). Rate of water production in A11 and S2 tumors in vivo (B) (**P = 0.0016) (±SD, n = 3).
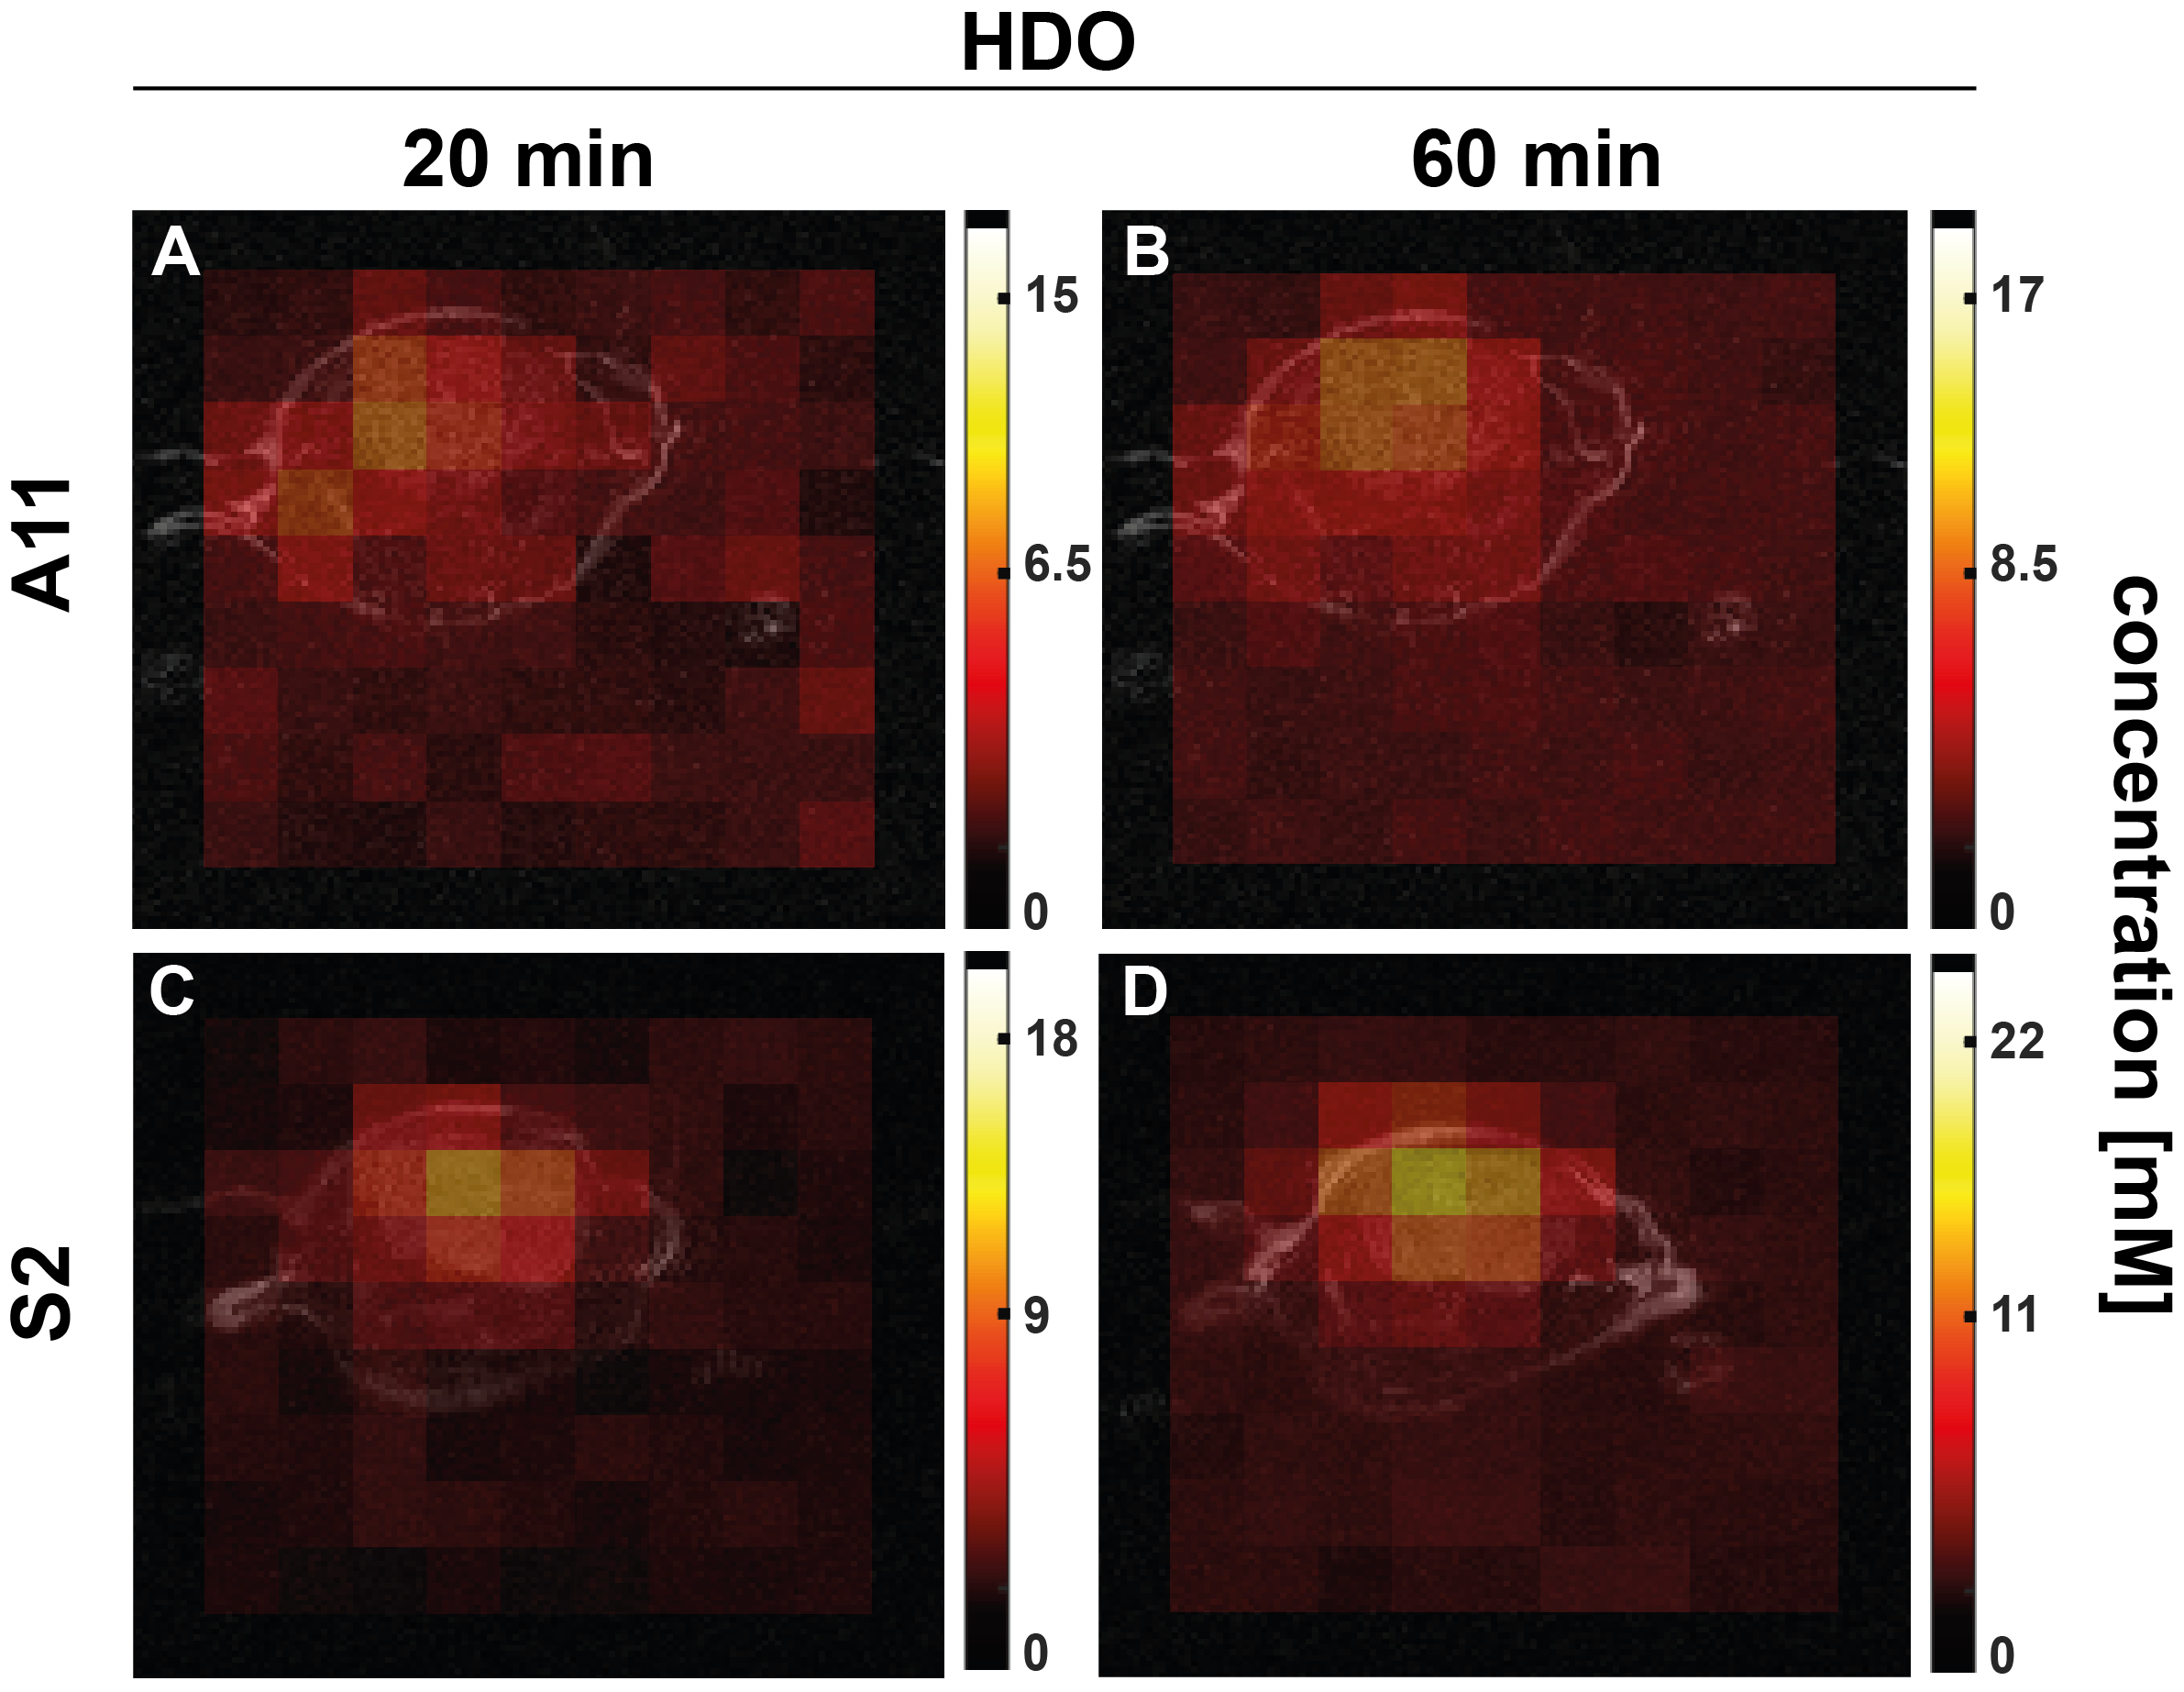
Figure 8: T2-weighted 2H images and HDO concentration maps in the central slice derived from dynamic 3D CSI images following [2,3,3-2H2]serine injection into orthotopically implanted patient-derived, A11 (A,B) and S2 (C,D) tumor-bearing mice. The color code represents approximate concentration maps of HDO (in mM) 20 min and 60 min post-[2,3,3-2H2]serine injection.