0222
Mapping oxidative and non-oxidative glucose metabolic rates of entire human brain using quantitative dynamic deuterium MRS imaging at 7T1Center for Magnetic Resonance Research, University of Minnesota, Minneapolis, MN, United States
Synopsis
Keywords: Deuterium, Deuterium, Glucose Metabolic Rates
Motivation: Cerebral glucose metabolism via non-oxidative and oxidative pathways is critical for brain function, however, methods capable of quantitatively imaging metabolic rates are lacking.
Goal(s): To develop a quantitative dynamic deuterium (2H) MRSI (DMRSI) method capable of mapping human brain glucose metabolic rates.
Approach: Combining novel hardware and advanced post-processing method with kinetic models, we established a high-resolution, high-quality dynamic DMRSI capable of quantifying and imaging three metabolic rates of glucose consumption (CMRGlc), lactate generation (CMRLac) and TCA cycle (VTCA) in human brain at 7T.
Results: We demonstrate consistent whole-brain maps of CMRGlc, CMRLac, VTCA in health subjects.
Impact: We developed a novel DMRSI platform on an FDA-approved clinical 7T scanner that enables simultaneous high-resolution imaging of CMRGlc, CMRLac and VTCA of entire human brain for the first time. This novel technology has potential for brain research and translation.
Introduction
Glucose is the main energy fuel of human brain, consuming ~20% of the body’s total energy budget. Glucose metabolic imaging thus plays a crucial role in the diagnosis of neurological diseases and brain injuries. 18F-FDG PET cannot provide both oxidative and non-oxidative glucose metabolic rates, 13C-based MRSI methods lack adequate sensitivity for high-resolution imaging and require complex hardware setups. Recent progress in steady-state deuterium MRSI (DMRSI) technology has demonstrated excellent results in healthy human brain and brain tumor patients 1-3. However, dynamic DMRSI has not been fully established to quantitatively determine major glucose metabolic rates associated with non-oxidative and oxidative pathways.In this work, we performed high-resolution dynamic whole-brain DMRSI on an FDA-approved 7T clinical scanner and introduced a novel kinetic model to quantify three cerebral metabolic rates of glucose consumption (CMRGlc), lactate generation (CMRLac) and TCA cycle (VTCA), using blood input functions derived from IV blood sampling.
Methods
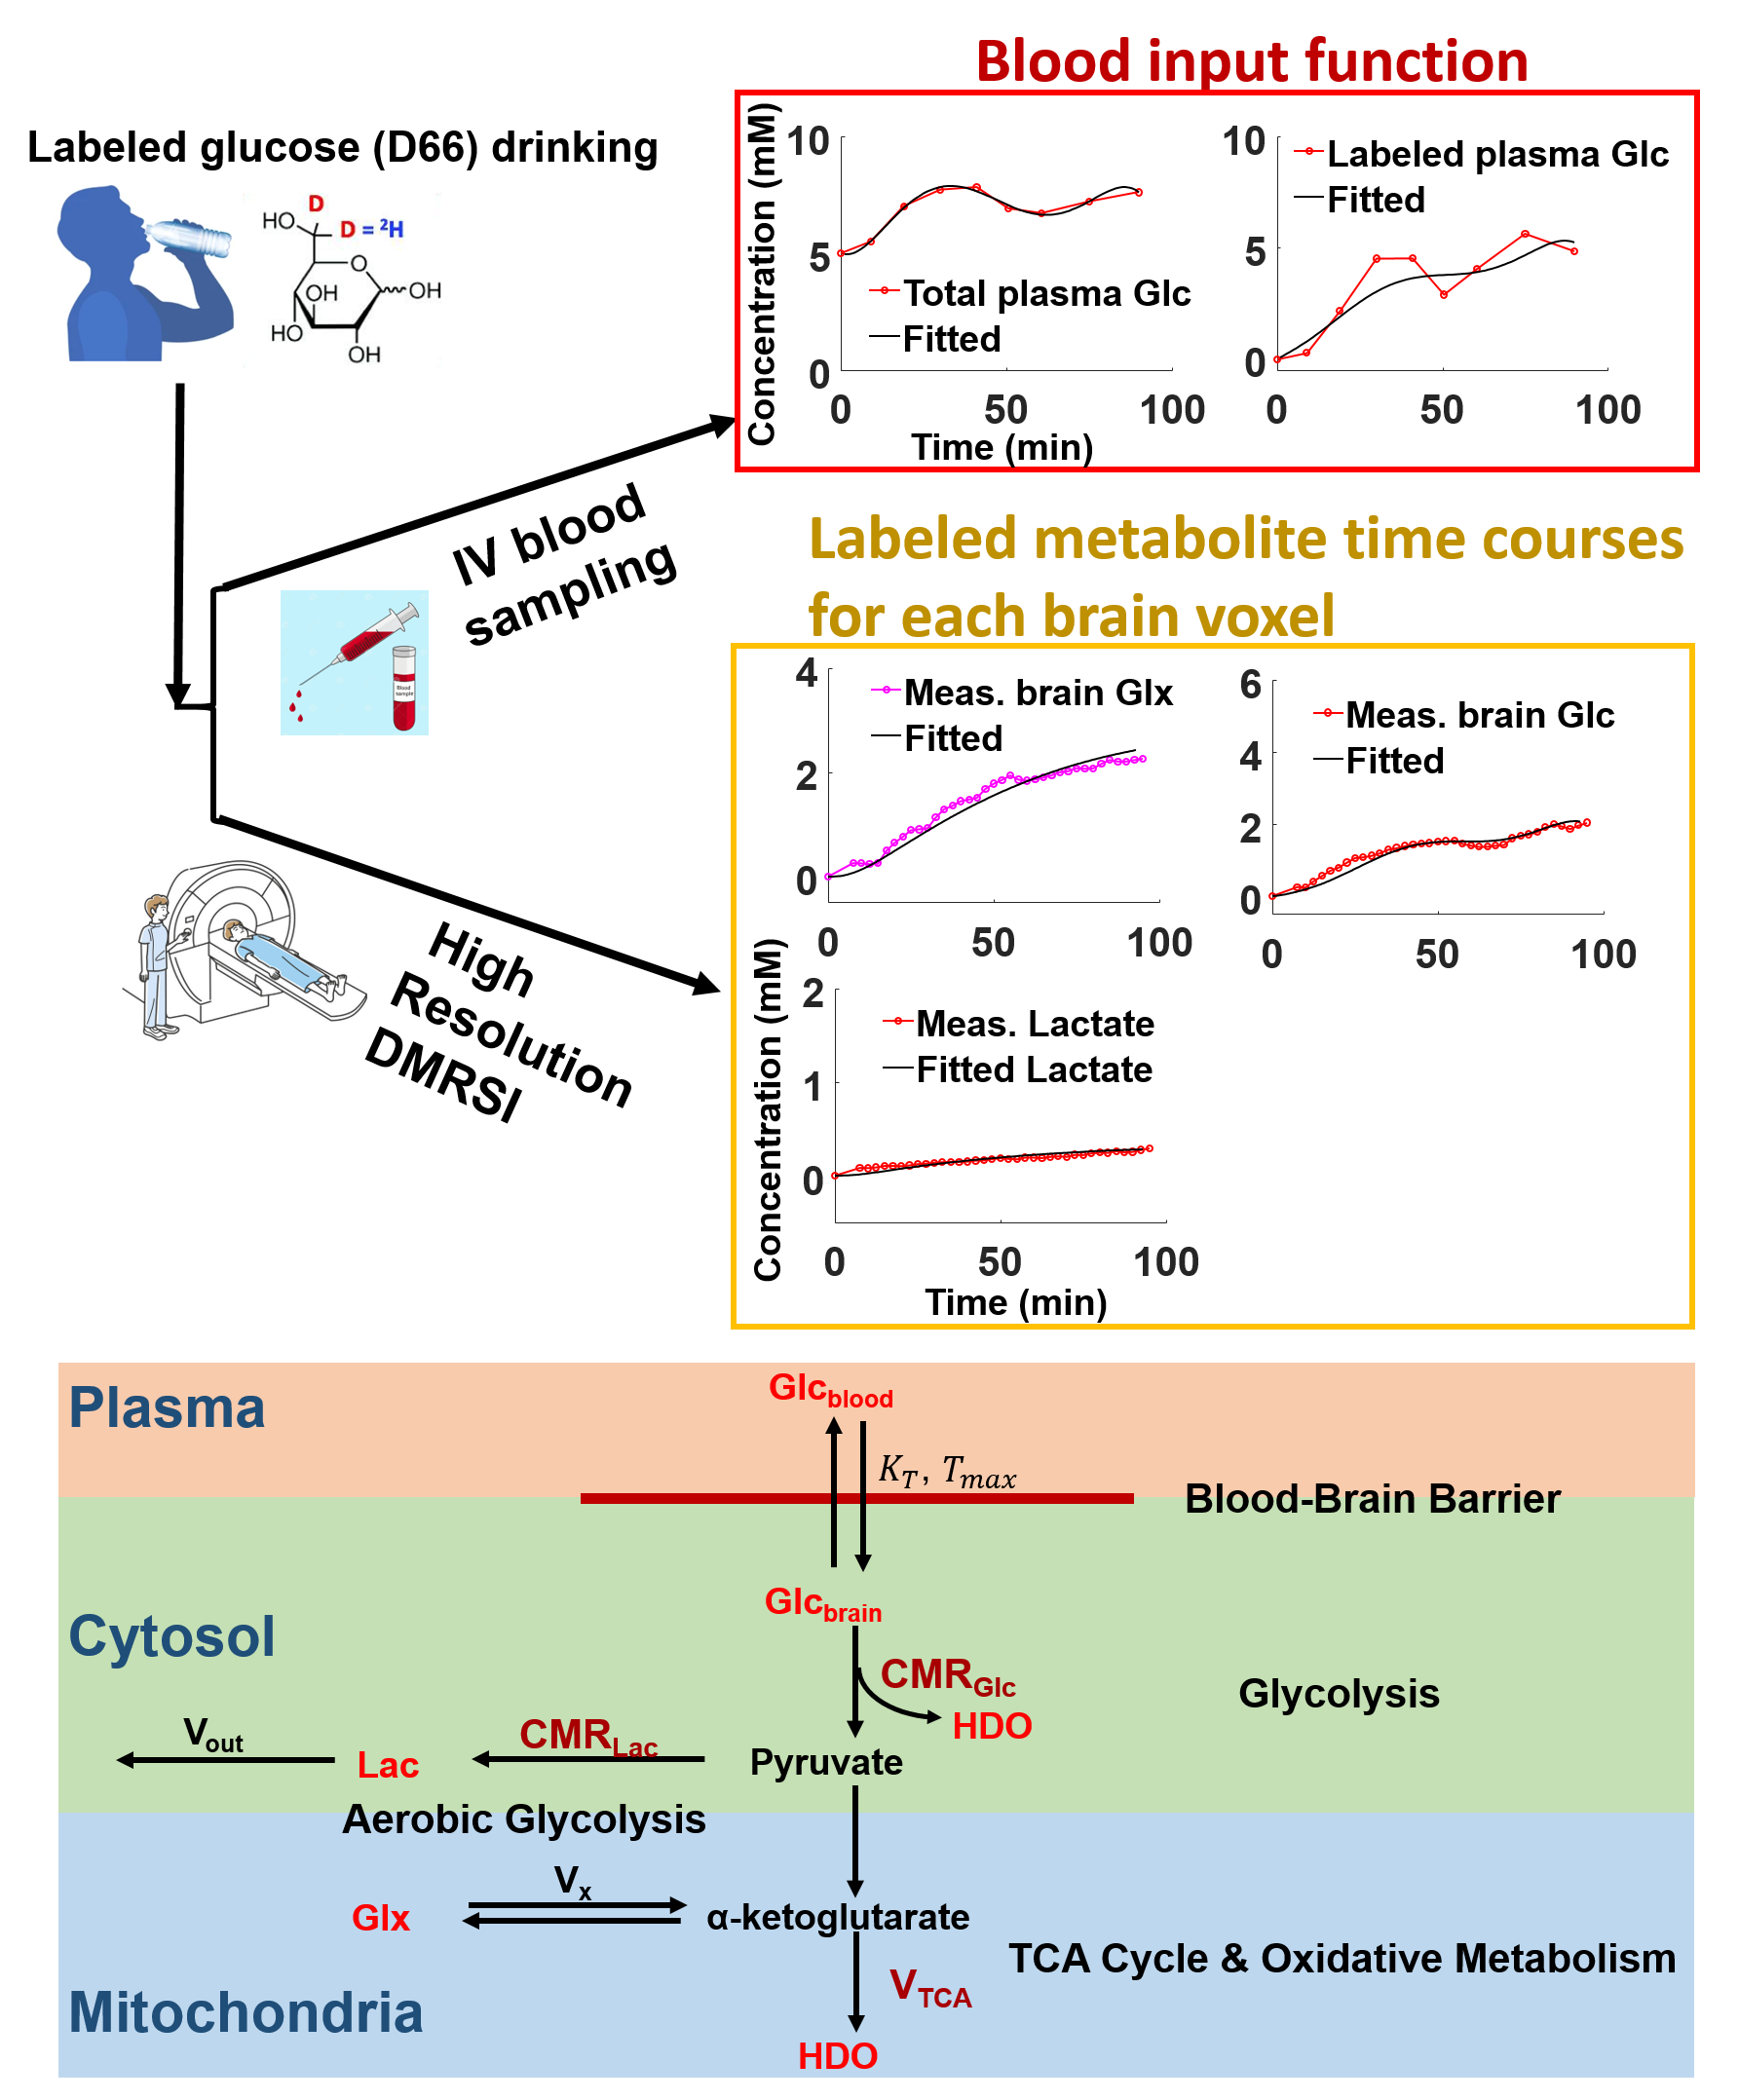
High resolution dynamic DMRSI studies were performed on a 7T-Terra scanner with a novel 2H/1H array head coil 4. The workflow for the DMRSI measurement and IV blood sampling is illustrated in Fig. 1. At the beginning of each study, we collected brain structural images and baseline DMRSI. Next, the participants were administered deuterium-labeled (D66) glucose orally, followed by acquisition of multiple volumes of DMRSI and intravenous sampling to obtain total plasma glucose and labeled plasma glucose time courses (blood input functions). Experimental procedures were approved by the UMN IRB.Advanced post processing pipelines based on previous work 5-6 were used to quantify metabolites concentrations including deuterated water (HDO), glucose (Glc), glutamate/ glutamine (Glx) and Lactate (Lac) for each spatial and time points of the DMRSI. The values of CMRGlc, CMRLac and VTCA were quantified using measured metabolites time courses and blood input functions and the kinetic model shown in Fig. 1. The kinetic model is based on a modified animal kinetic model 7, and the parameters of pool size and rates: [Glc]brain=1.2 mM, [Pyruvate]brain=0.17 mM, [Lactate]brain=0.6, [α-ketoglutarate]brain=0.12 mM, [Glx]brain=15 mM, Vout=0.1 mM/min, KT=15 mM/min, Vx=30 mM/min were used in the model fitting.
Results
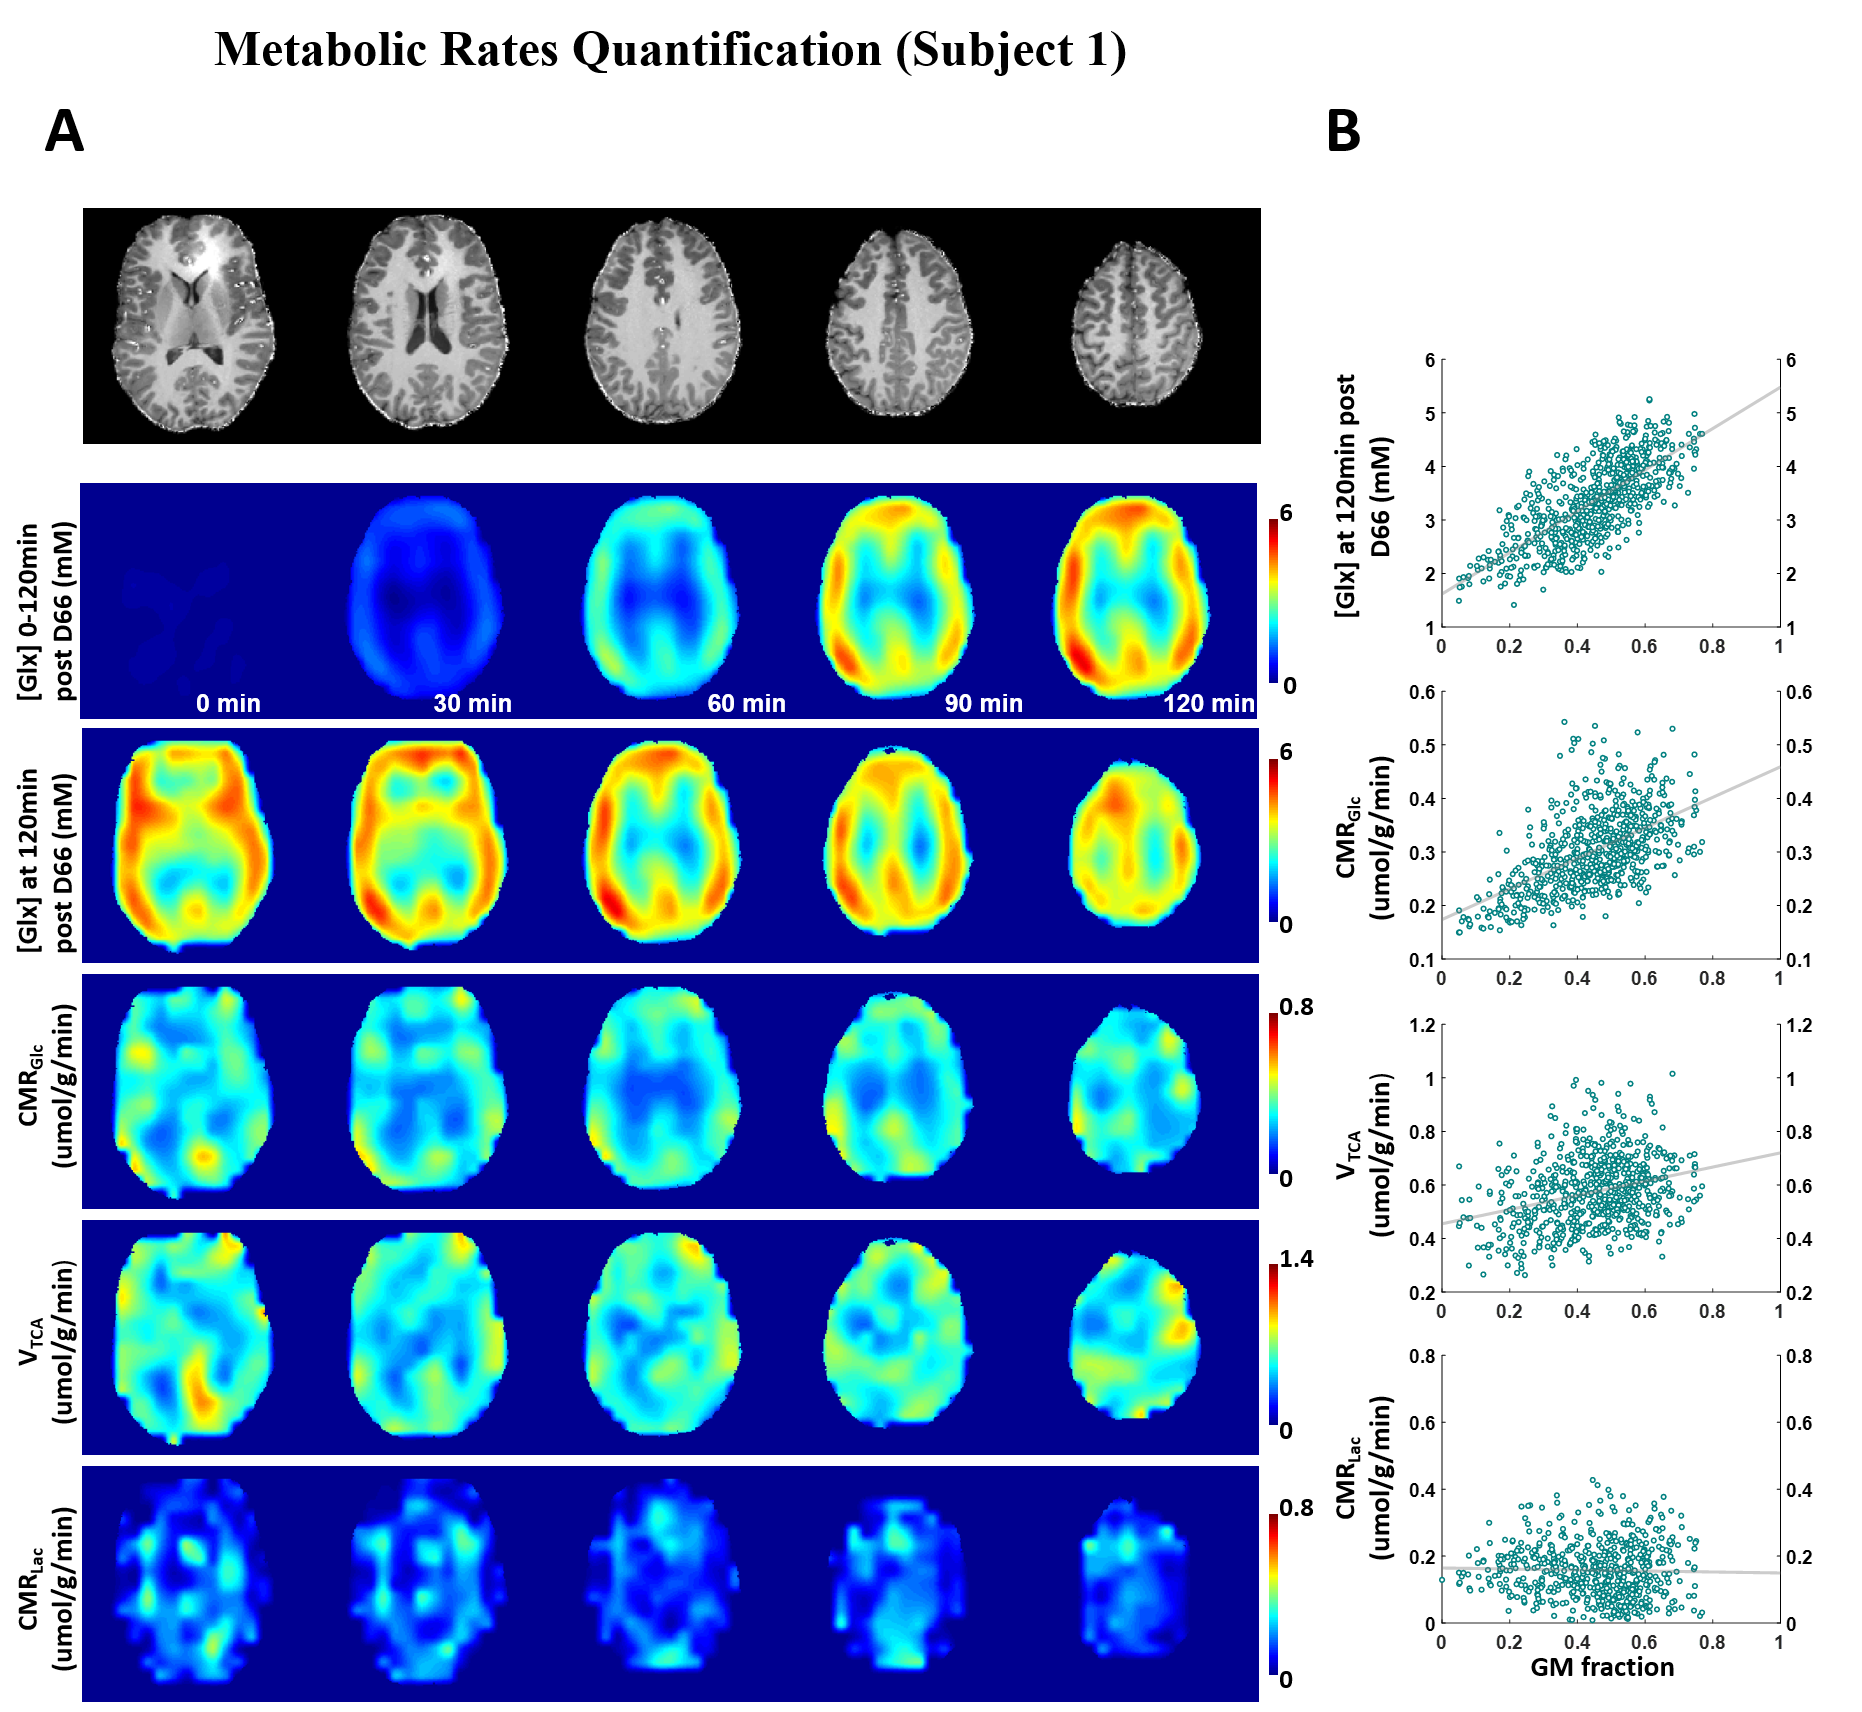
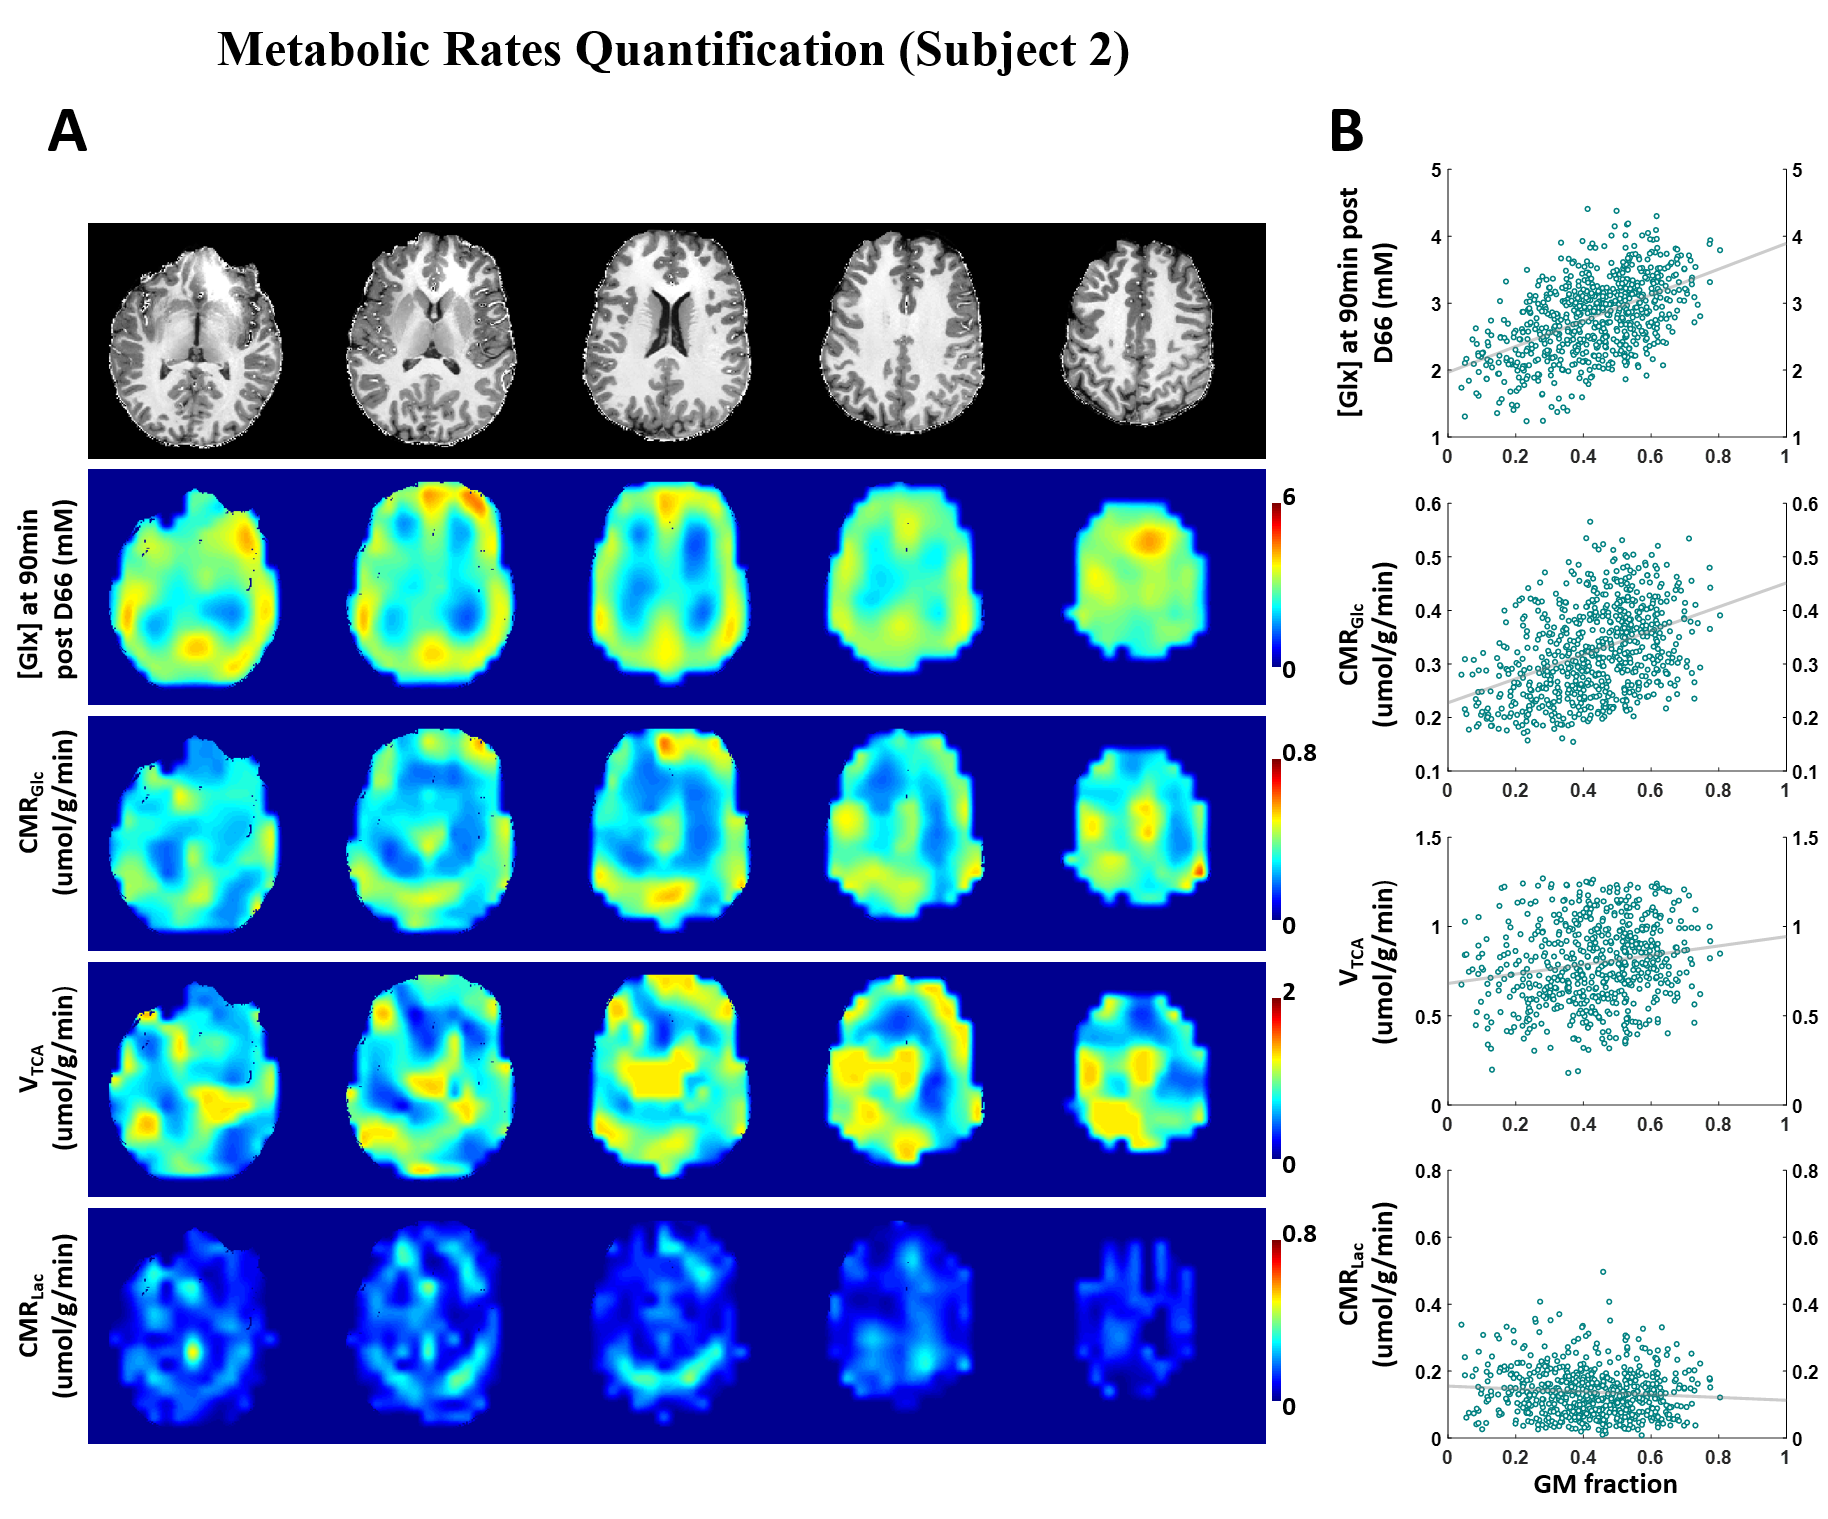
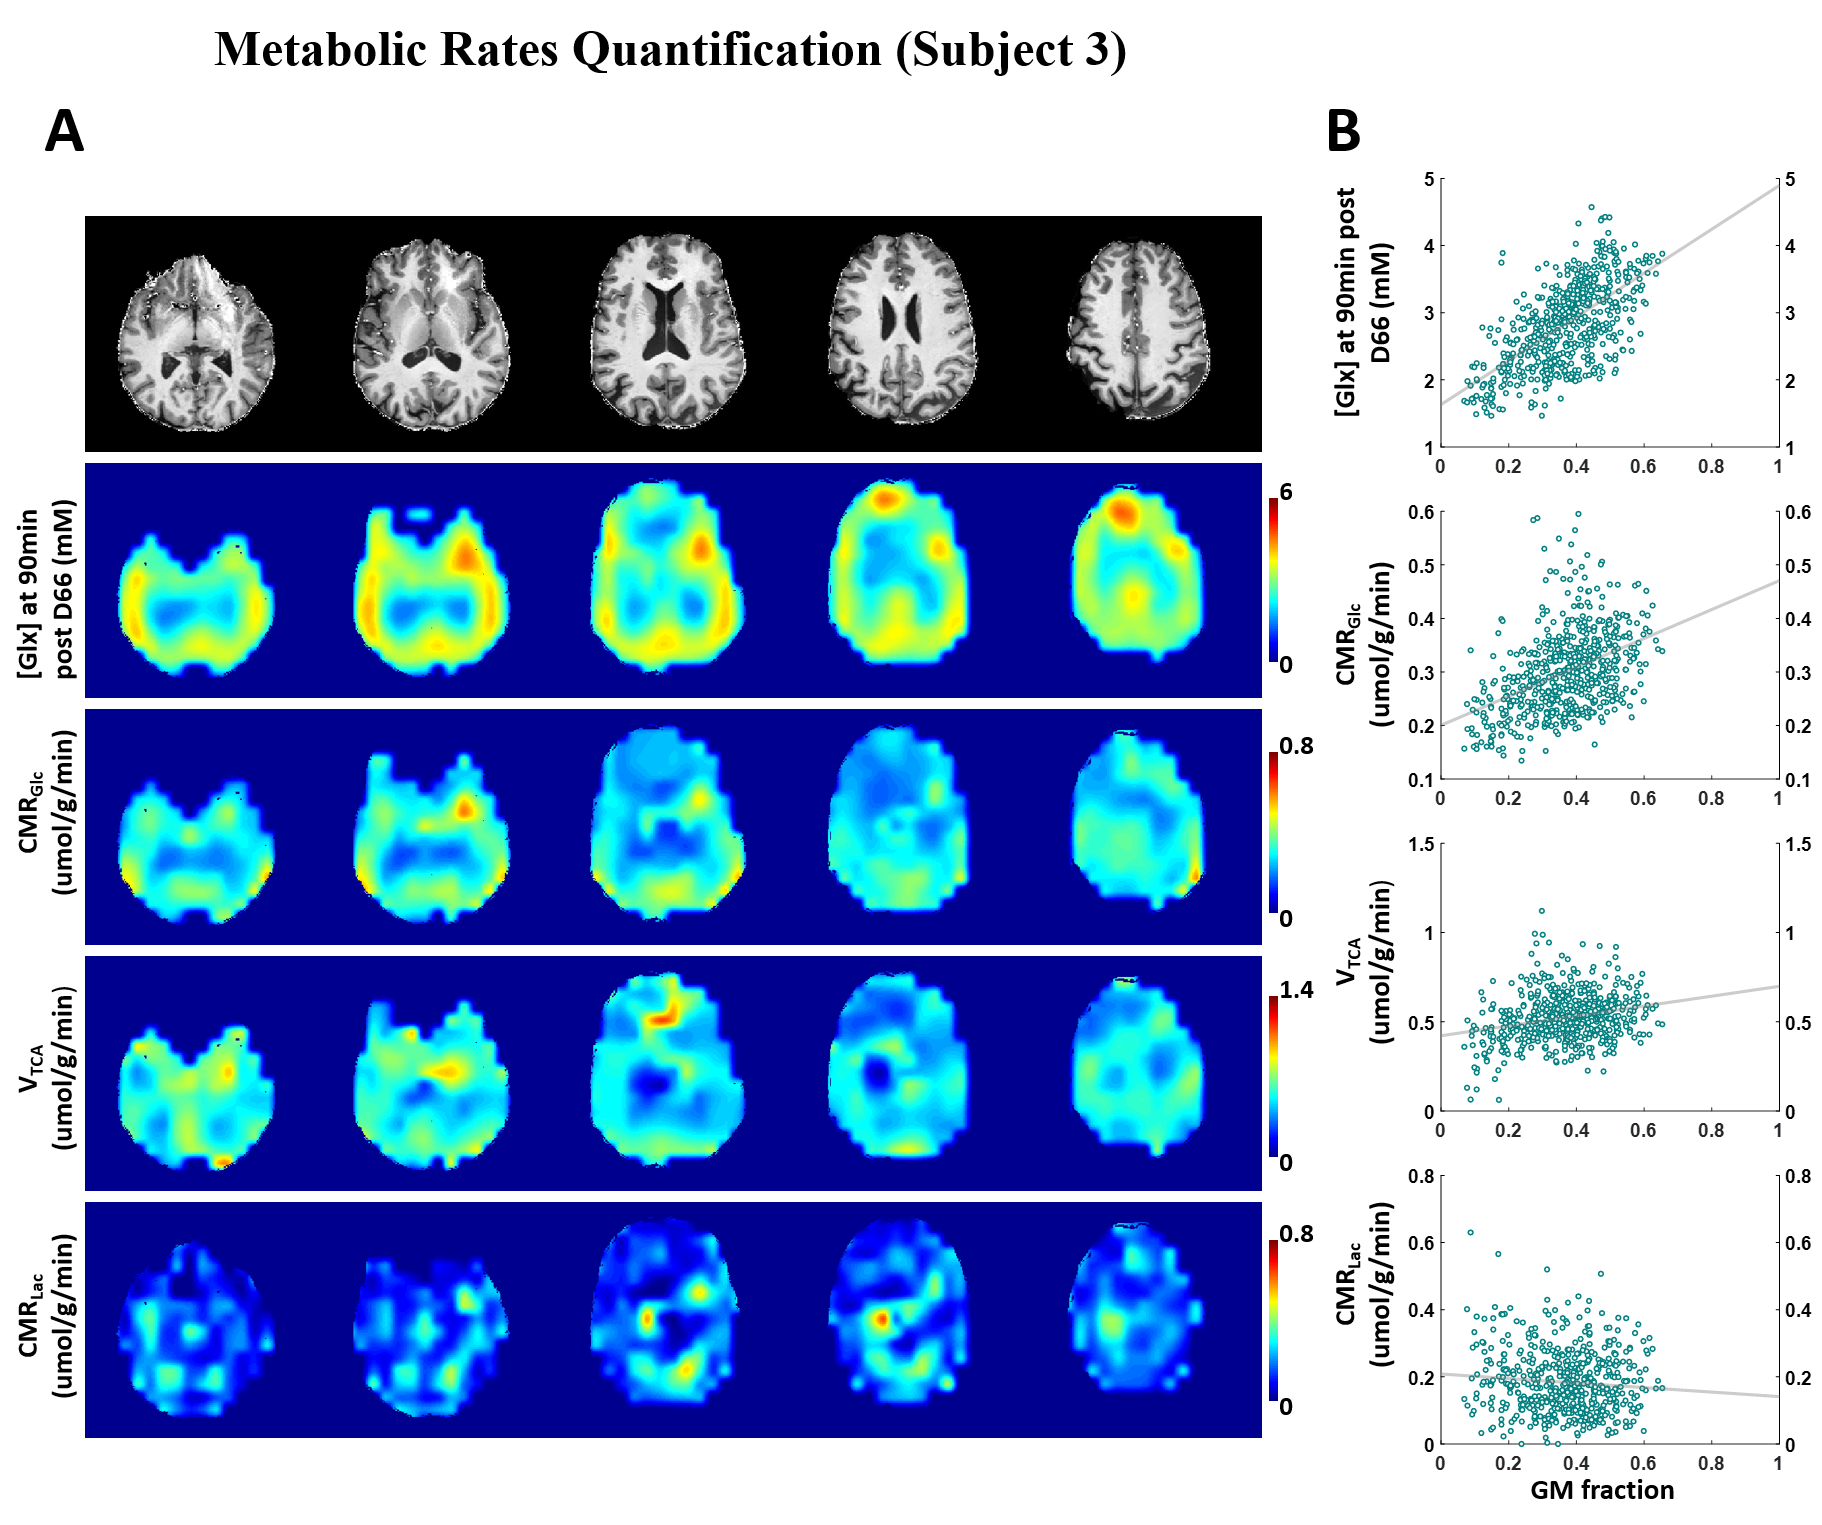
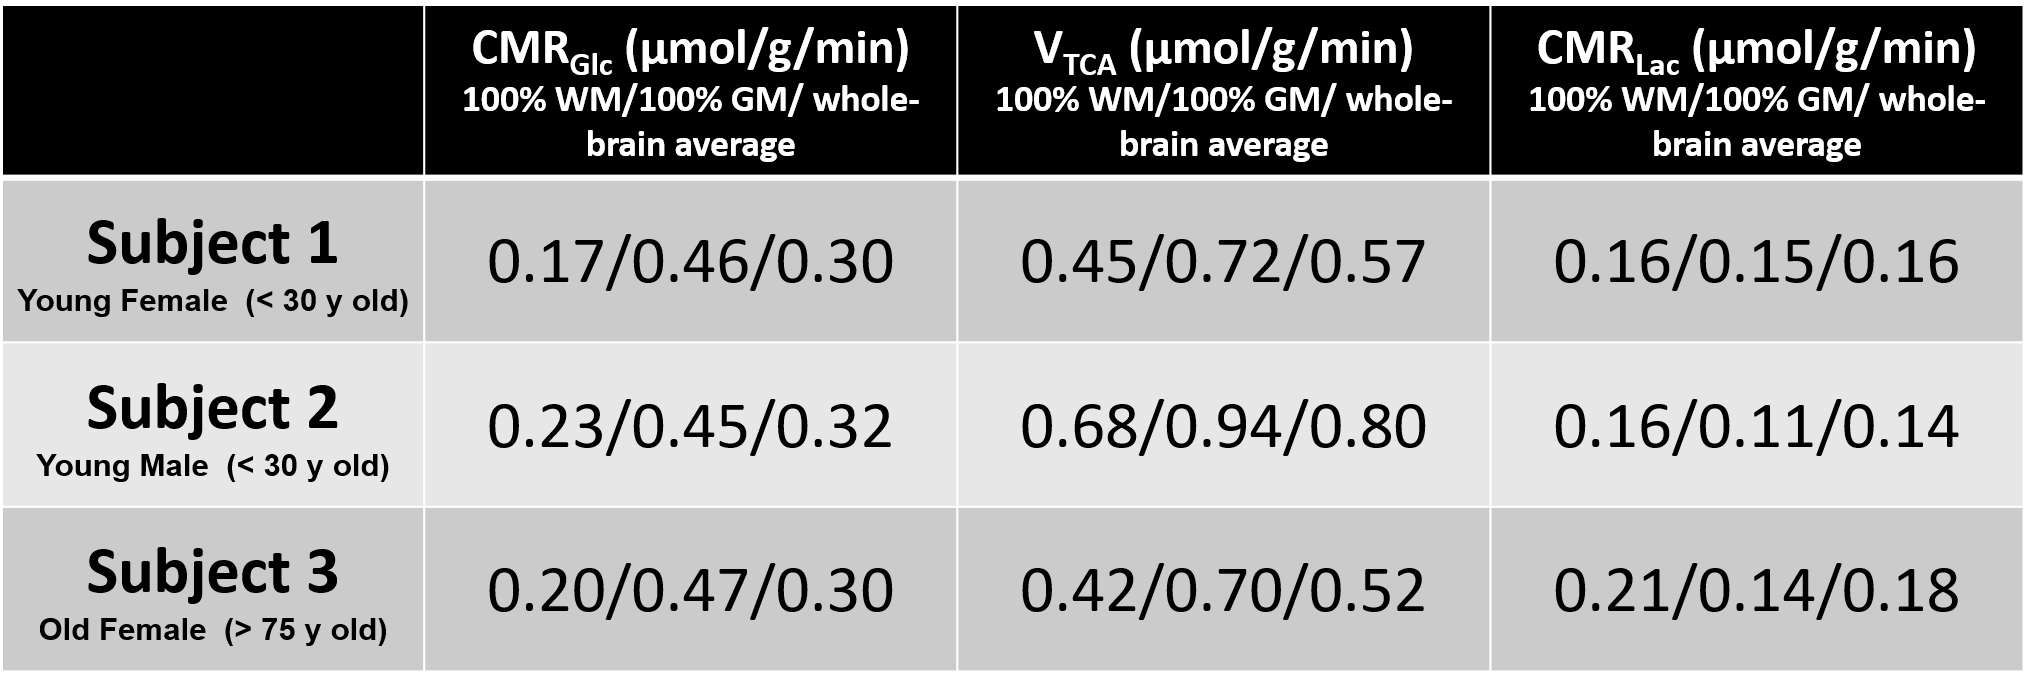
The whole-brain metabolic maps of CMRGlc, VTCA and CMRLac were obtained in three health volunteers (Subject 1-3) and are shown in Figs. 2-4, respectively. The accuracy of the model fitting for multiple metabolite time courses in a representative voxel is illustrated in Fig. 1.For each subject, we performed linear regression of [Glx] (in the last DMRSI volume), CMRGlc, CMRLac, and VTCA on gray matter (GM) tissue fraction using the data from all DMRSI voxels within the brain. The intercepts of the regression indicate the values of [Glx], CMRGlc, CMRLac, and VTCA in pure GM and white matter (WM), respectively. Table 1 summarizes the values of CMRGlc, CMRLac and VTCA in pure GM, WM and whole-brain-average in all three subjects. The resulted mean values of CMRGlc in GM, WM and whole-brain agree with the literature reports of PET and 1H MRS measurements in human brain 8, 9. Additionally, the ratio between VTCA and CMRGlc is close to 2-fold, and percentage of glucose used in aerobic glycolysis at rest (i.e., CMRLac/(2CMRGlc) ) is close to 20% on an overall basis for all three subjects, again consistent with literature values 10.
Discussion
We demonstrate for the first time the feasibility of quantitatively imaging both oxidative and non-oxidative glucose metabolic rates of CMRGlc, CMRLac, and VTCA over the entire human brain from a single dynamic DMRSI scan, and show consistent results across all subjects studied. Human GM exhibits 2-3 times higher labeled [Glx], 2-2.7 times higher CMRGlc and 1.4-1.7 times higher VTCA than WM, indicating that GM requires a higher energy budget and consumes energy mainly for signaling such as synaptic transmission 11. Strikingly, we found that CMRLac is relatively higher in WM; one possibility is that WM is composed of more glia and long-range axons, and glia-derived lactate is used as an energy source to support axon function 12, 13.Conclusion
We successfully established a comprehensive dynamic DMRSI method at 7T, including imaging acquisition and post-processing pipeline and a kinetic model, for quantitative whole-brain mapping of CMRGlc , CMRLac and VTCA rates; and demonstrated consistent results in multiple healthy human volunteers. This new metabolic neuroimaging technique should have high impact for quantitative studies of brain glucose metabolism and metabolic reprograming in health and disease states.Acknowledgements
This work was supported, in part, by NIH grants: R01CA240953, U01 EB026978, R01NS133006, S10 OD025256 and P41EB027061. Technical support from Drs. Guangle Zhang, Yudu Li and Zhi-Pei Liang.References
1. De Feyter, H.M., et al., Deuterium metabolic imaging (DMI) for MRI-based 3D mapping of metabolism in vivo. Science Advances, 2018. 4(8): p. eaat7314.
2. Ruhm, L., et al., Deuterium metabolic imaging in the human brain at 9.4 Tesla with high spatial and temporal resolution. Neuroimage, 2021. 244: p. 118639.
3. Roig, E.S., et al., Deuterium metabolic imaging of the human brain in vivo at 7 T. Magnetic Resonance in Medicine, 2022.
4. Li, X., et al. A multinuclear 4-channel 2H loop and 4-channel 1H microstrip array coil for human head MRS/MRI at 7T. in Proceedings of the 31st Annual Meeting of ISMRM. 2022. London, UK.
5. Li, X., et al. High spatiotemporal resolution whole-brain 2H MRS imaging (DMRSI) to differentiate grey and white matter metabolic dynamics in human brain at 7T. in 023 ISMRM & ISMRT Annual Meeting & Exhibition. 2023. Toronto, Canada.
6. Li, Y., et al., Machine Learning-Enabled High-Resolution Dynamic Deuterium MR Spectroscopic Imaging. IEEE Trans Med Imaging, 2021. Pp.
7. Lu, M., et al., Quantitative assessment of brain glucose metabolic rates using in vivo deuterium magnetic resonance spectroscopy. J Cereb Blood Flow Metab, 2017. 37(11): p. 3518-3530.
8. de Graaf, R.A., et al., Differentiation of glucose transport in human brain gray and white matter. J Cereb Blood Flow Metab, 2001. 21(5): p. 483-92.
9. Hyder, F., et al., Uniform distributions of glucose oxidation and oxygen extraction in gray matter of normal human brain: No evidence of regional differences of aerobic glycolysis. J Cereb Blood Flow Metab, 2016. 36(5): p. 903-16.
10. Zhu, X.-H. and W. Chen, In vivo X-Nuclear MRS Imaging Methods for Quantitative Assessment of Neuroenergetic Biomarkers in Studying Brain Function and Aging. Frontiers in Aging Neuroscience, 2018. 10.
11. Yu, Y., et al., Evaluating the gray and white matter energy budgets of human brain function. J Cereb Blood Flow Metab, 2018. 38(8): p. 1339-1353.
12. Baltan, S., Can lactate serve as an energy substrate for axons in good times and in bad, in sickness and in health? Metab Brain Dis, 2015. 30(1): p. 25-30.
13. Pellerin, L., et al., Role of neuron-glia interaction in the regulation of brain glucose utilization. Diabetes Nutr Metab, 2002. 15(5): p. 268-73; discussion 273.
Figures