0221
First-in-Human Whole-Abdomen Metabolic Imaging with Hyperpolarized [1-13C]Pyruvate in D2O and Initial Application in Human Pancreatic Cancer1Department of Radiology, Memorial Sloan Kettering Cancer Center, New York, NY, United States, 2Radiochemistry and Molecular Imaging Probes (RMIP) Core, Memorial Sloan Kettering Cancer Center, New York, NY, United States, 3Department of Medical Biophysics, University of Toronto, Toronto, ON, Canada, 4Sunnybrook Research Institute, Toronto, ON, Canada, 5GE HealthCare, New York, NY, United States, 6Department of Neurology, Memorial Sloan Kettering Cancer Center, New York, NY, United States, 7Department of Radiology & Molecular Pharmacology Program, Memorial Sloan Kettering Cancer Center, New York, NY, United States
Synopsis
Keywords: Hyperpolarized MR (Non-Gas), Hyperpolarized MR (Non-Gas), whole-abdomen imaging, hyperpolarized [1-13C]pyruvate, deuterium oxide (D2O), pancreatic ductal adenocarcinoma (PDAC)
Motivation: Whole-abdomen imaging with hyperpolarized [1-13C]pyruvate holds promise to diagnose metabolic diseases. D2O solvation could extend the 13C T1 lifetime, resulting in enhanced image SNR.
Goal(s): Establish the safety and feasibility of utilizing D2O to administer hyperpolarized [1-13C]pyruvate in whole-abdomen imaging, and present the first application of whole-abdomen hyperpolarized [1-13C]pyruvate MRI in a PDAC patient.
Approach: We quantified the metabolic characteristics of organs in healthy and diseased subjects.
Results: The use of D2O is safe and feasible. It has no significant impact on organ metabolism and delivery of the pyruvate bolus. This technique demonstrates potential for application in cancer patients.
Impact: The safety and feasibility of employing D2O for hyperpolarized 13C whole-abdomen MRI sets the stage for translational studies. The first application of hyperpolarized whole-abdomen [1-13C]pyruvate MRI to a PDAC patient provides essential support for its future exploration in oncology.
Introduction
Abdominal magnetic resonance imaging (MRI) plays an essential role in the diagnosis of cancer.1 Recently, this technique has been successfully developed in conjunction with dissolution dynamic nuclear polarization to image metabolism in healthy volunteers by administering hyperpolarized [1-13C]pyruvate.2 Additionally, D2O solvation has been reported to extend the 13C T1 lifetime,3,4 which is essential in clinical imaging studies for preserving pyruvate magnetization upon injection and ultimately enhancing in vivo SNR. Here, we show the safety and feasibility of utilizing D2O to administer hyperpolarized [1-13C]pyruvate in whole-abdomen imaging, and furthermore present the first application of hyperpolarized 13C whole-abdomen imaging to a pancreatic ductal adenocarcinoma (PDAC) patient.Methods
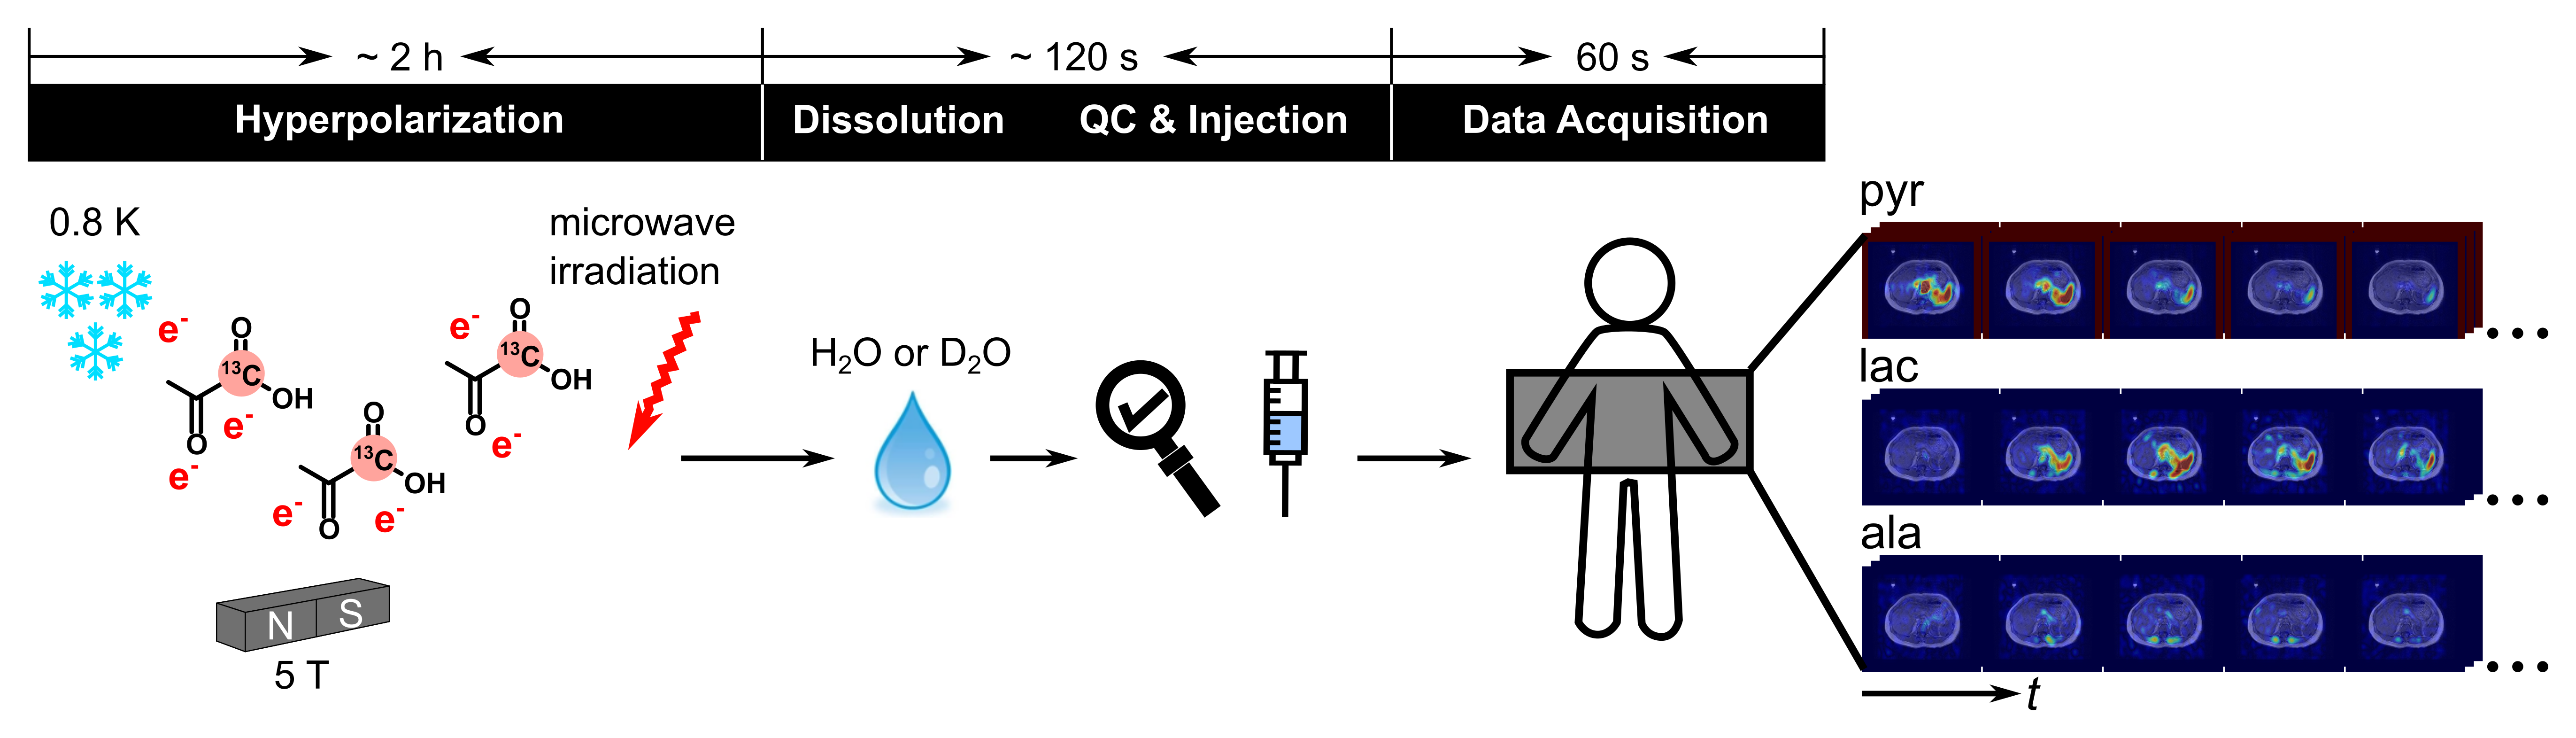
Subject Details. This study included 5 healthy volunteers (3 males and 2 females) with a mean age of 30 ± 4 years, ranging from 25-34 years. Additionally, a PDAC patient (male, age 81 years) participated in the study.Dose Preparation. The pyruvate preparation consisted of 1.54 grams of [1-13C]pyruvate and 15 mM of free radical. The prep was hyperpolarized on 13C using a SPINlab hyperpolarizer (GE HealthCare) (Fig. 1). Following hyperpolarization, the prep was rapidly dissolved in preheated, sterile H2O (for the PDAC patient) or D2O (for the healthy volunteers) and neutralized with a neutralization medium. The prep then underwent automated filtration, neutralization, and a quality control assessment before injection. The subjects were injected intravenously with 0.43 mL/kg (total body weight) of ~ 200 mM [1-13C]pyruvate followed by a 20 mL saline flush with 5 mL/s injection rate.
13C MRI. All MR scans were conducted in a wide-bore 3T scanner (MR750w, GE HealthCare). The hyperpolarized 13C images were acquired with a dual-echo 3D echo planar imaging sequence5 (25.6 × 25.6 × 48 cm3 field of view, 1.6 × 1.6 × 2 cm3 spatial resolution, 5 s temporal resolution, 12 time points). The acquisition order of the metabolites was lactate, bicarbonate, alanine, and pyruvate, with flip angles of 11o for pyruvate and 80o for the others.
For the PDAC patient (who was imaged before approval of studies with D2O), the standard H2O approach was used with an earlier version of the above-described sequence that did not detect alanine.
Results
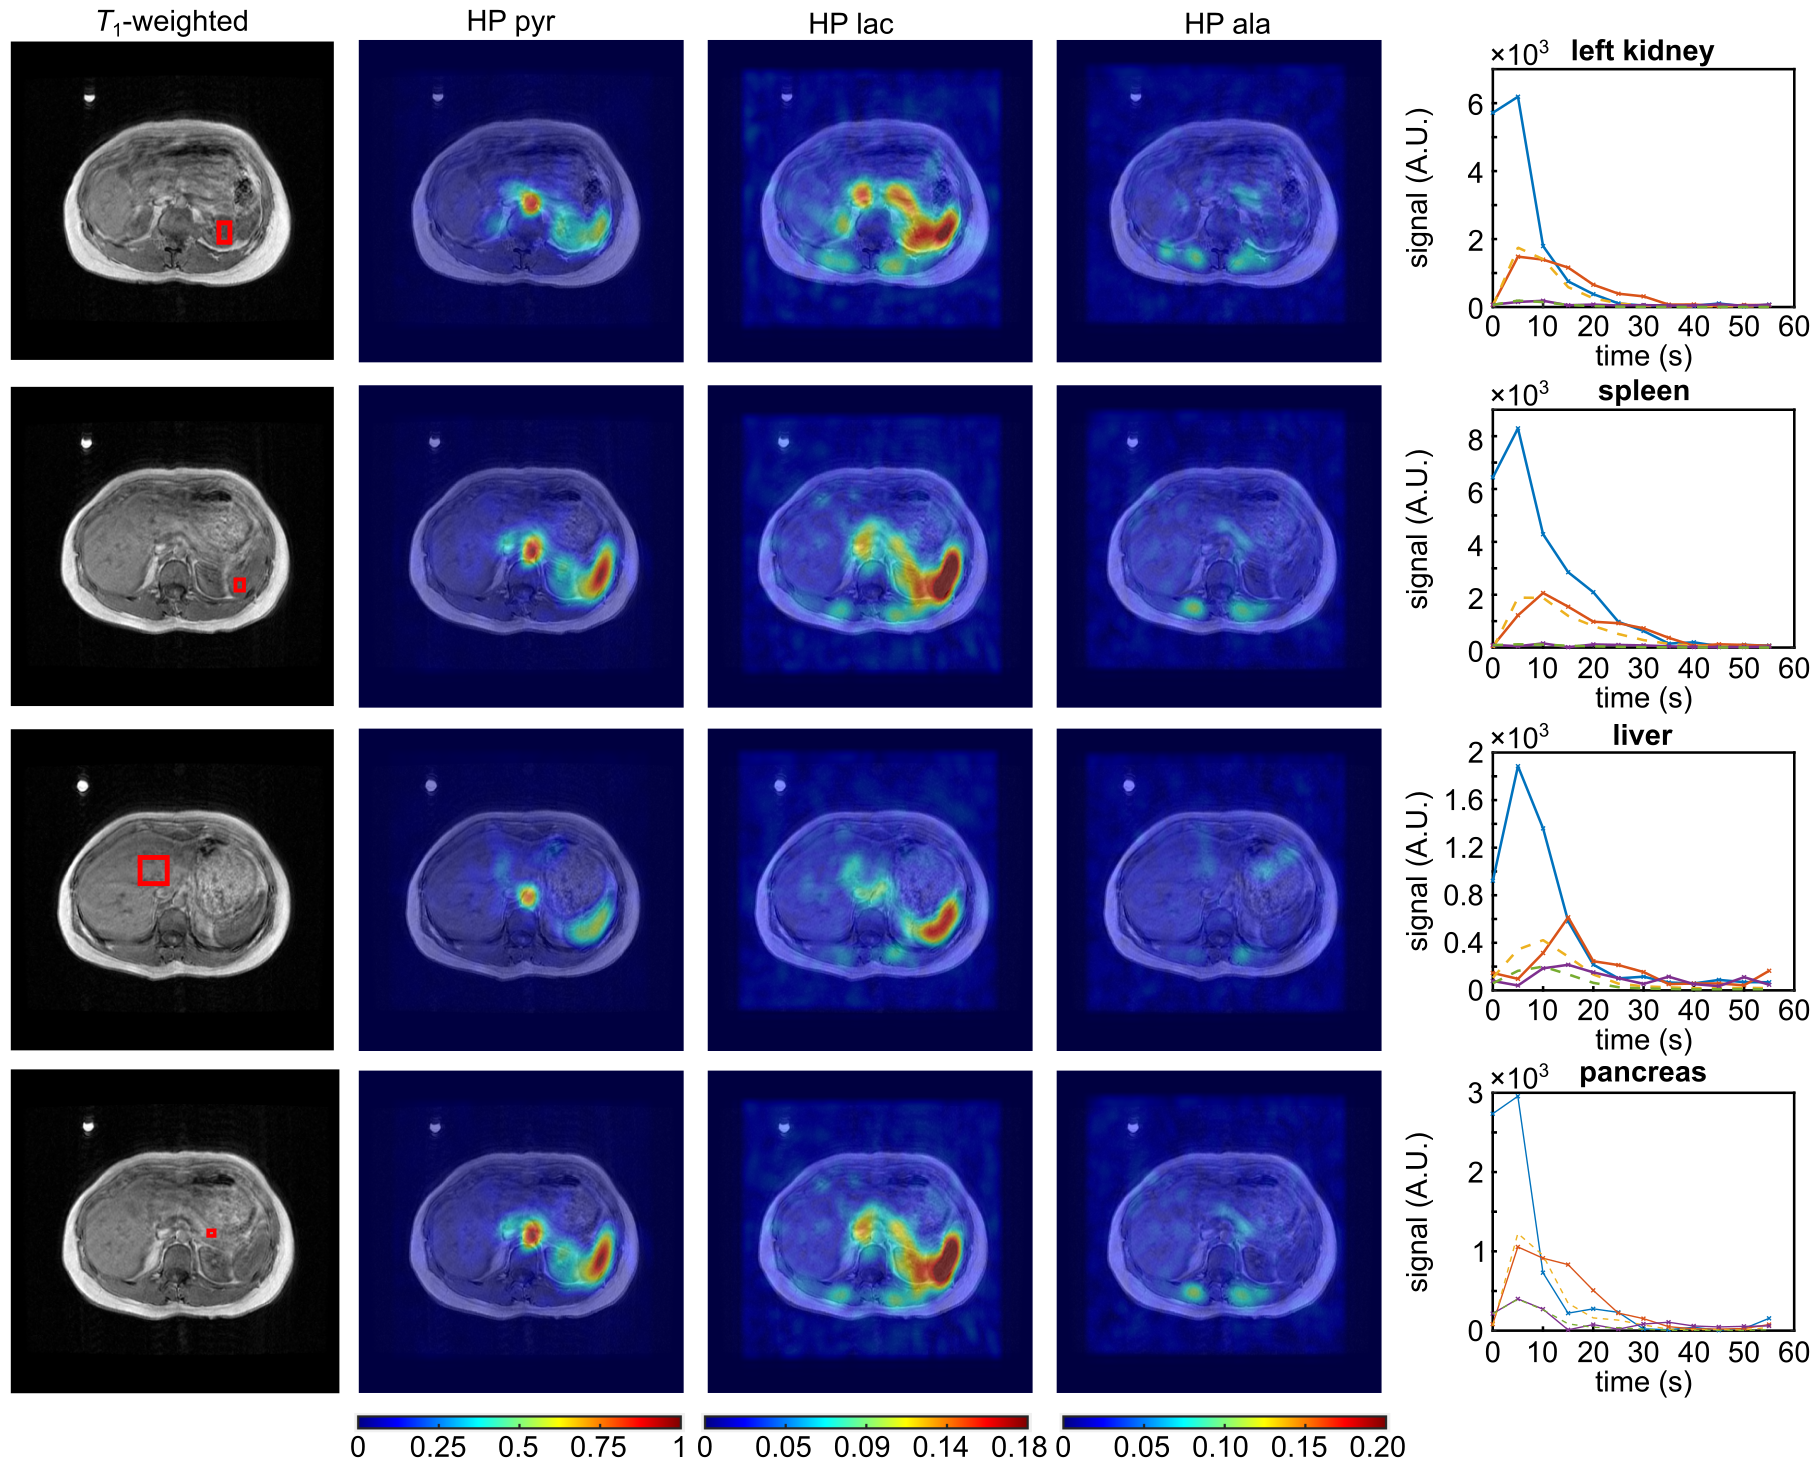
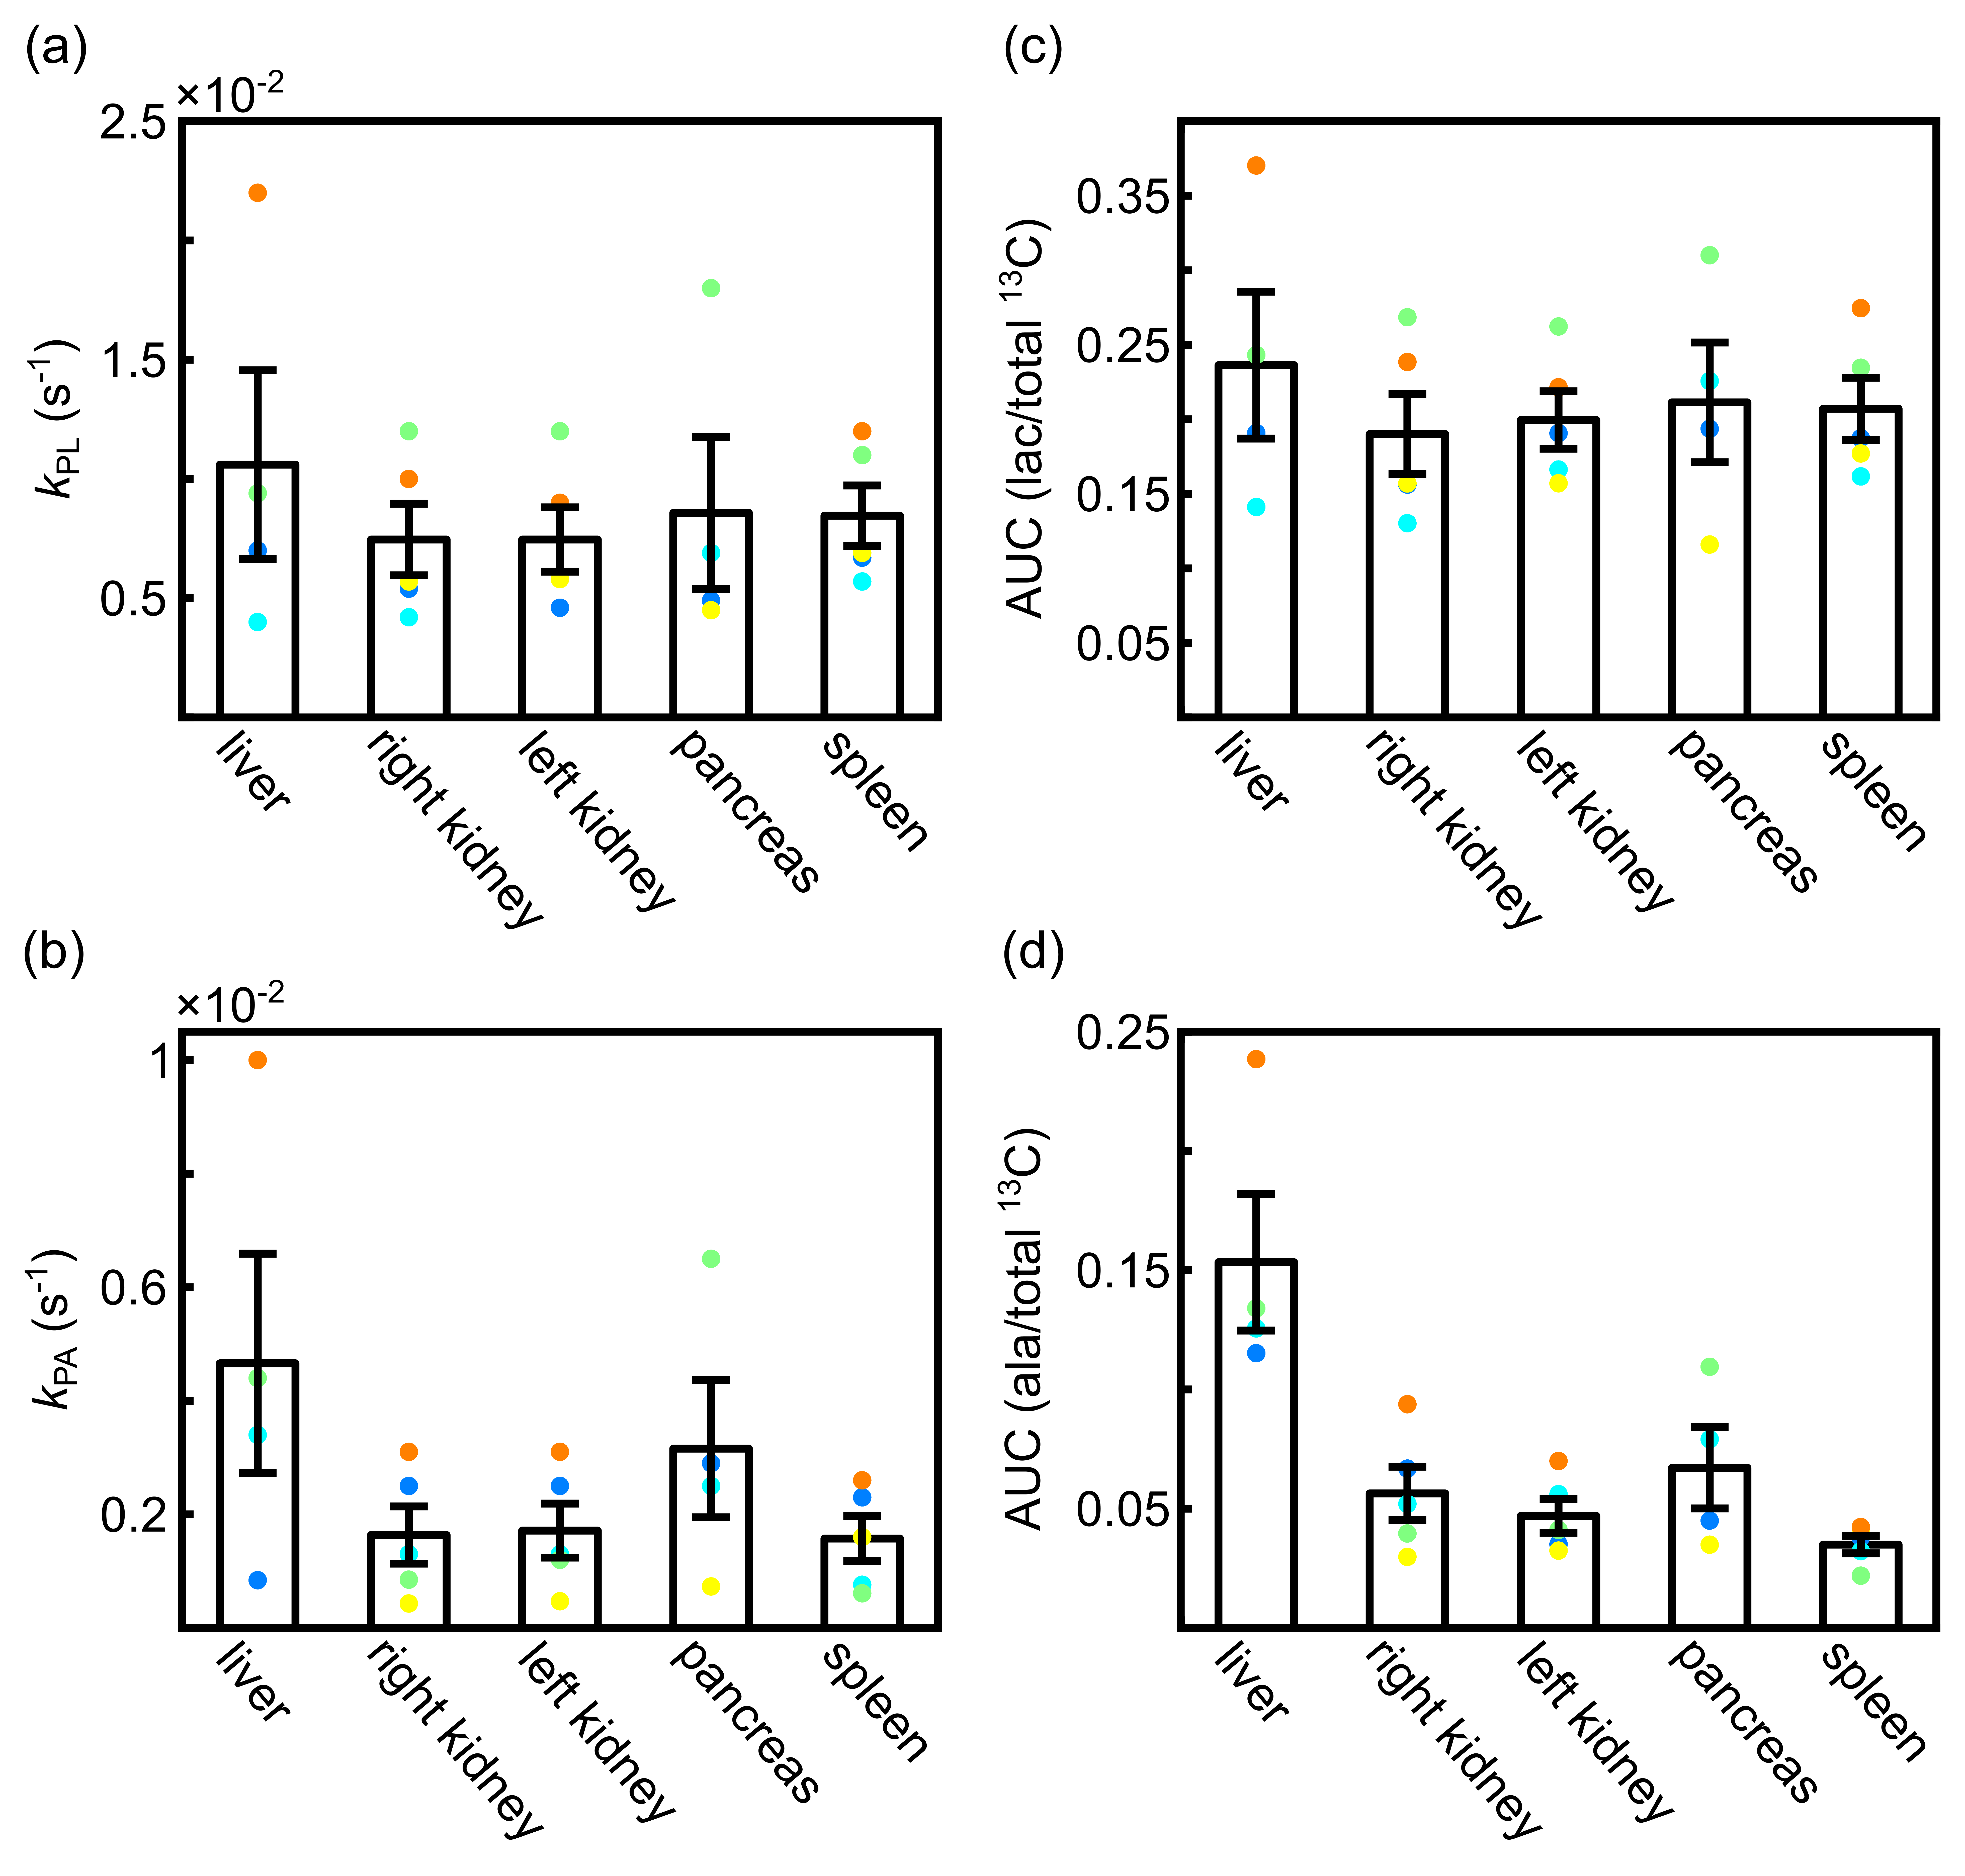
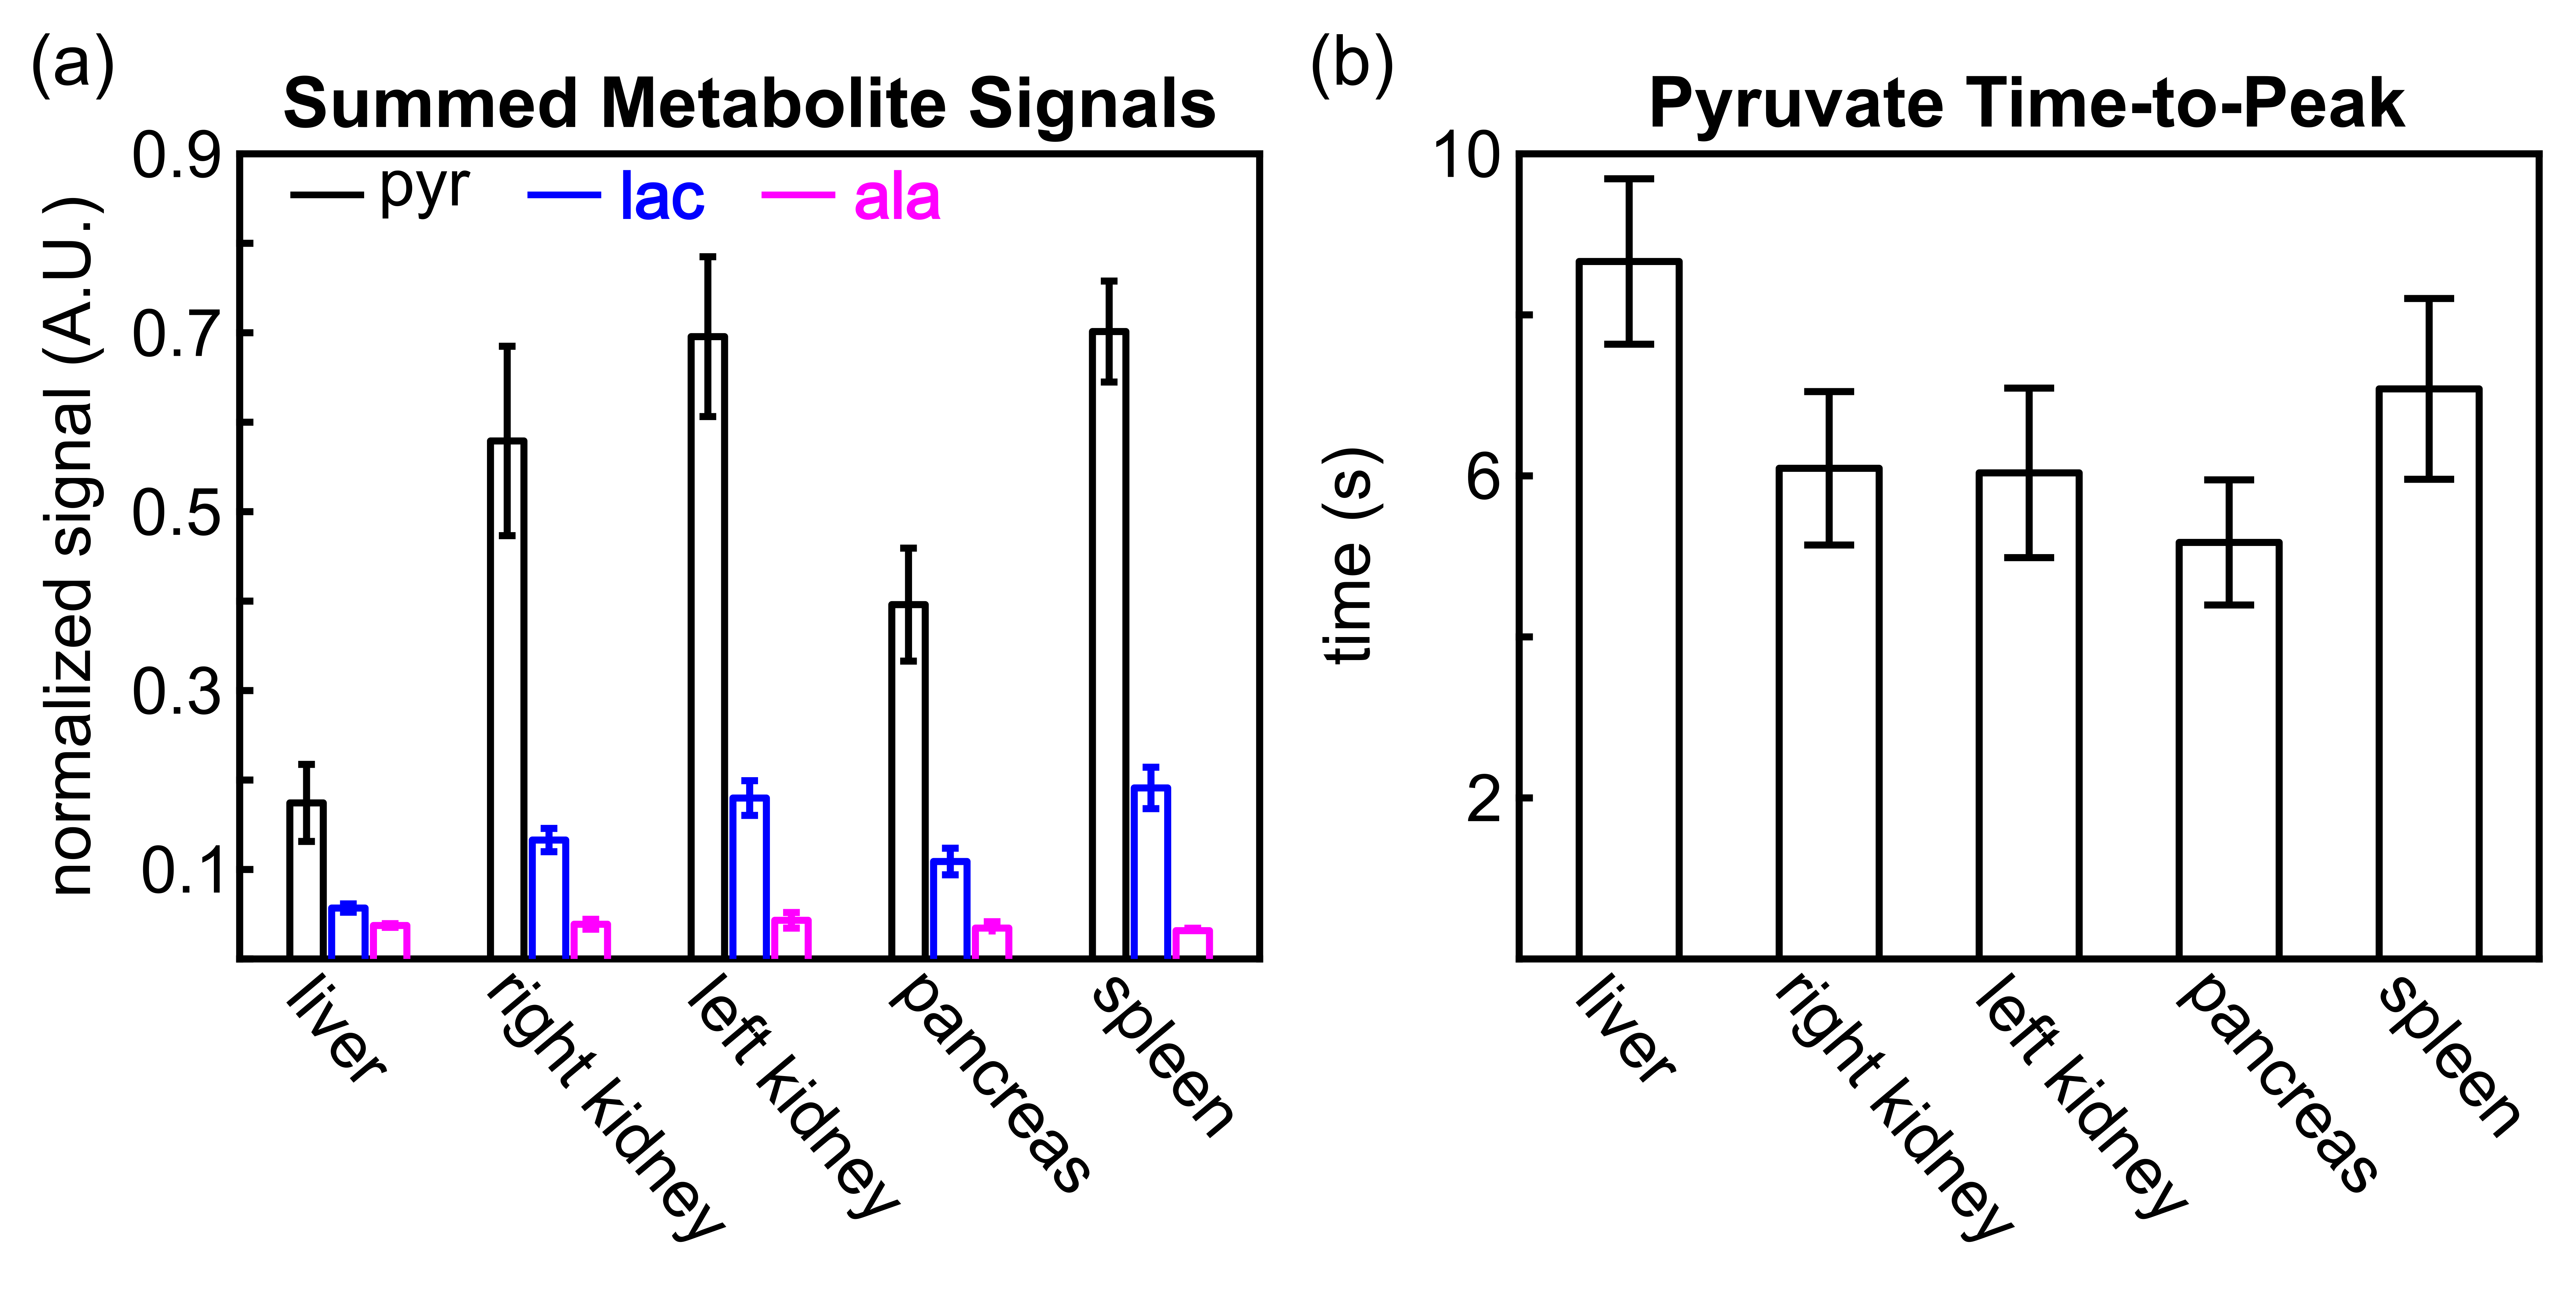
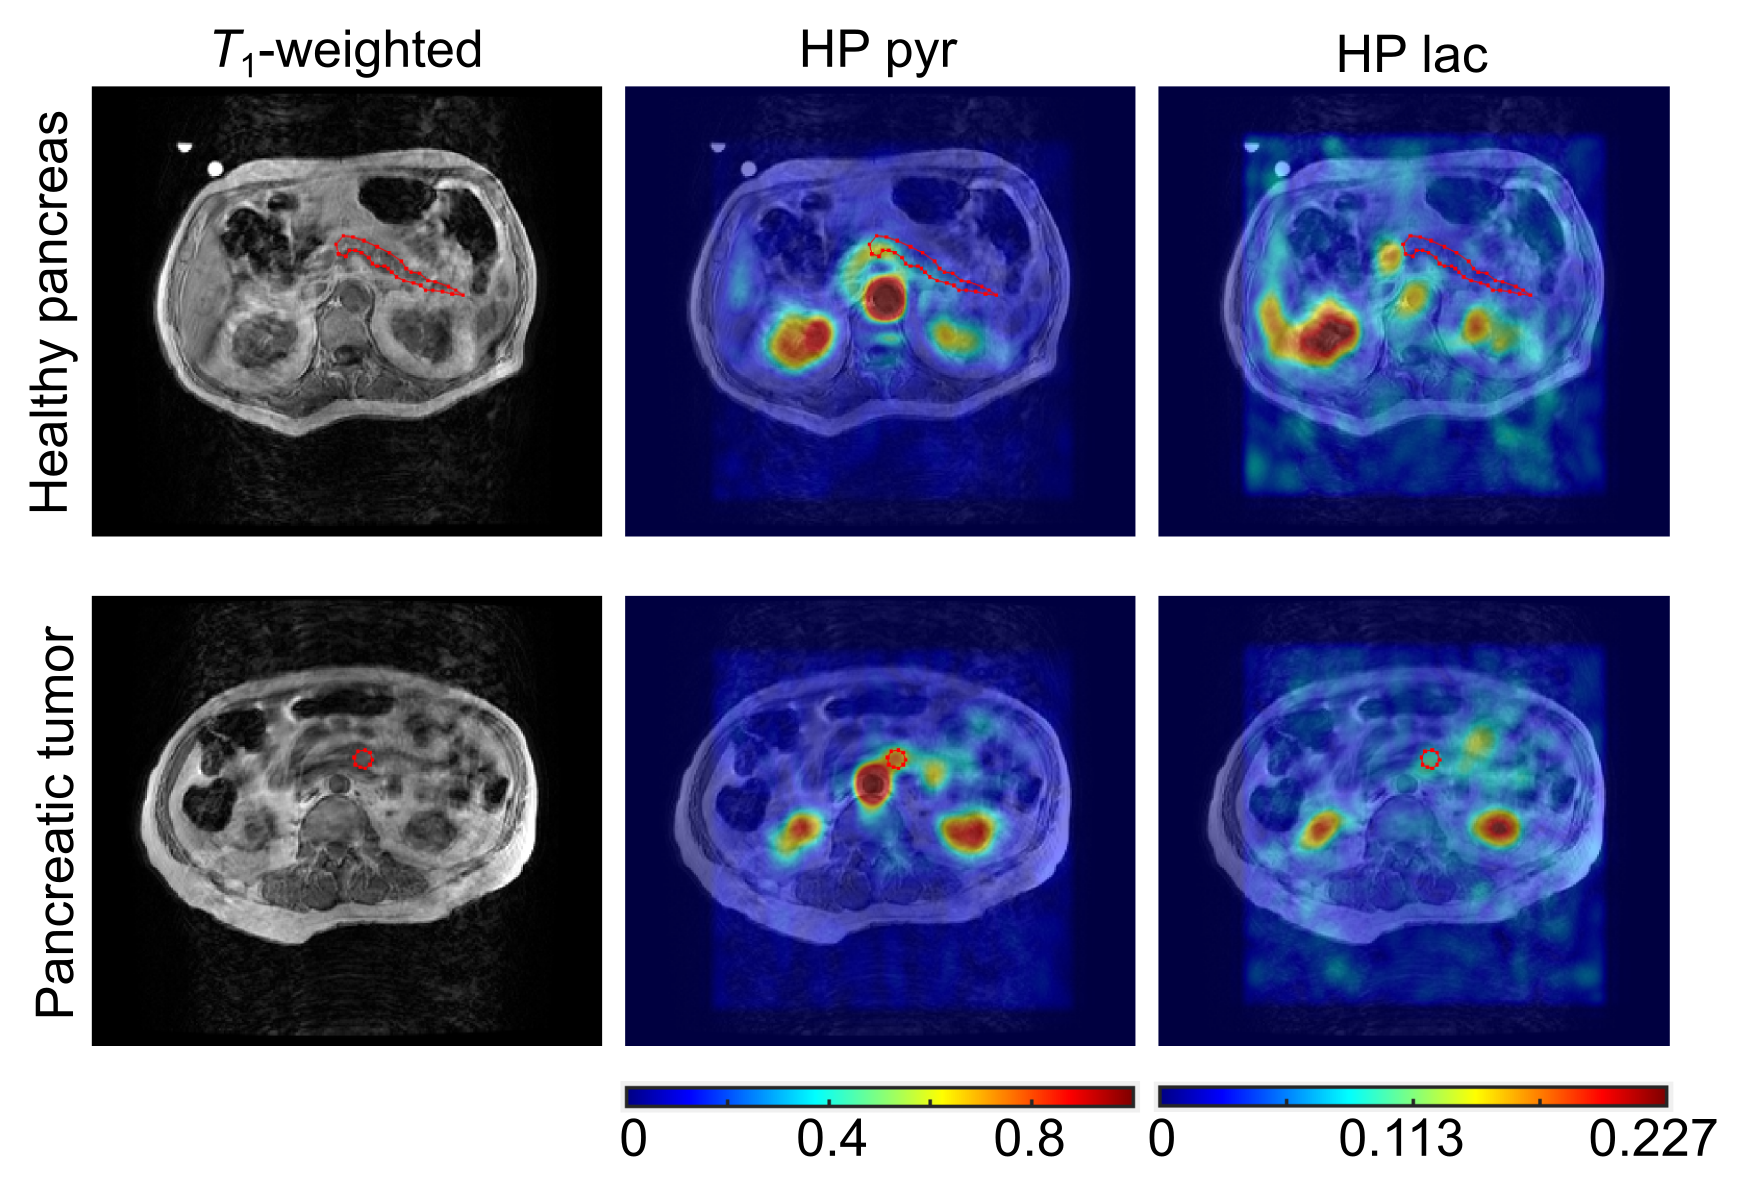
For the healthy volunteers, the hyperpolarized 13C metabolic maps for each metabolite were summed over the entire time course and overlaid on the 1H anatomical images (Fig. 2). Liver exhibited the highest mean conversion rate of pyruvate to lactate (kPL, n=5) and pyruvate to alanine (kPA, n=5). The spleen and kidneys displayed low kPA, while the pancreas demonstrated a tendency for increased alanine production. The mean AUC((lac or ala)/total 13C) exhibited a proportional correlation with the mean kPL and kPA values (Fig. 3). The kidneys and spleen displayed the highest pyruvate and lactate signals. In contrast, the liver showed the lowest pyruvate and lactate signals (Fig. 4a). The mean pyruvate time-to-peak (TTP, n=5) was shortest in the pancreas and longest in the liver, while the kidneys exhibited intermediate levels (Fig. 4b).For the PDAC patient, the hyperpolarized 13C metabolic maps for pyruvate and lactate, containing slices of the PDAC tumor and the healthy pancreas, were summed over the entire period and superimposed on the 1H anatomical images (Fig. 5). The AUC(lac/total 13C) was found to be 24% higher in the PDAC tumor than in the healthy pancreas.
Discussion
We present the first pilot study on the safety and feasibility of using [1-13C]pyruvate in D2O solution for hyperpolarized 13C whole-abdomen MRI in healthy volunteers. No adverse events were reported in any of the volunteers, demonstrating the safety of the method for use in humans. The mean kPL and kPA values and pyruvate TTP from the healthy volunteers were comparable to those reported in previous work on hyperpolarized MRI of the abdomen using H2O. This suggests that the use of D2O does not significantly affect the metabolism of the organs and the delivery of pyruvate bolus.With the goal of enhancing the applicability of hyperpolarized [1-13C]pyruvate whole-abdomen imaging, we also reported the first-in-human acquisition of such imaging in a PDAC patient. The higher AUC(lac/total 13C) in the tumor indicated an increased kPL. This increase correlated with the excessive production of lactate in cancer cells, which is a hallmark of cancer associated with increased aggressiveness, supporting the potential of this method for cancer diagnosis in a clinical setting.
Conclusion
In summary, this study demonstrated the safety and feasibility of utilizing D2O for administering hyperpolarized [1-13C]pyruvate in whole-abdomen imaging. Furthermore, hyperpolarized [1-13C]pyruvate whole-abdomen imaging was successfully acquired in a PDAC patient, indicating the potential of the method for cancer diagnosis.Acknowledgements
This work was supported by grants from the National Institutes of Health (NIH R01CA237466, R01CA252037, R01CA248364, R01CA249294 and S10OD016422; NIH/NCI Cancer Center Support grant P30 CA008748), the Center for Molecular Imaging and Bioengineering (CMIB) at Memorial Sloan Kettering Cancer Center, the Thompson Family Foundation, and the Sir Peter Michael Foundation.
Conflict of Interest Disclosure: K.R.K. is co-founder of Atish Technologies and serves on the Scientific Advisory Boards of NVision Imaging Technologies and Imaginostics. He holds patents related to imaging and leveraging cellular metabolism.
References
1. Morone M, Bali M A, Tunariu N, et al. Whole-Body MRI: Current Applications in Oncology. Am. J. Roentgenol. 2017; 209(6): W336–W349.
2. Lee P M, Chen H, Gordon J W, et al. Whole‐Abdomen Metabolic Imaging of Healthy Volunteers Using Hyperpolarized [1‐13C]Pyruvate MRI. J. Magn. Reson. Imaging 2022; 56(6): 1792–1806.
3. Cho A, Eskandari R, Miloushev V Z, et al. A Non-Synthetic Approach to Extending the Lifetime of Hyperpolarized Molecules Using D2O Solvation. J. Magn. Reson. 2018; 295: 57–62.
4. Lees H, Millan M, Ahamed F, et al. Multi-Sample Measurement of Hyperpolarized Pyruvate-to-Lactate Flux in Melanoma Cells. NMR Biomed. 2021; 34(3): e4447.
5. Geraghty B J, Lau J Y C, Chen A P, et al. Dual-Echo EPI Sequence for Integrated Distortion Correction in 3D Time-Resolved Hyperpolarized 13C MRI. Magn. Reson. Med. 2018; 79(2): 643–653.
Figures