0216
Imaging the metabolic profile of the normal appearing brain in patients with brain metastases using hyperpolarized [1-13C]-pyruvate MRI1Department of Medical Biophysics, University of Toronto, Toronto, ON, Canada, 2Physical Sciences, Sunnybrook Research Institute, Toronto, ON, Canada, 3Department of Radiation Oncology, Sunnybrook Health Sciences Centre, Toronto, ON, Canada, 4GE Healthcare, Toronto, ON, Canada, 5Pharmacy, Sunnybrook Health Sciences Centre, Toronto, ON, Canada, 6Department of Medical Imaging, Sunnybrook Health Sciences Centre, Toronto, ON, Canada
Synopsis
Keywords: Hyperpolarized MR (Non-Gas), Metabolism, Cancer, Brain
Motivation: The metabolic profile of normal appearing brain tissue in patients with brain metastases may be related to the course of disease.
Goal(s): To test whether patients with brain metastases exhibit differential metabolism in normal appearing brain parenchyma compared to healthy control participants.
Approach: Hyperpolarized [1-13C]-pyruvate and T1w MRI were used to compare the metabolism and volumes of normal appearing brain regions in patients and healthy control participants.
Results: The lactate-to-bicarbonate (p=0.0004) and lactate-to-pyruvate (p=0.04) ratios were significantly increased in the normal appearing brain parenchyma of patients compared to controls.
Impact: The metabolic profile of normal appearing brain parenchyma in patients with brain metastases exhibits significantly increased glycolytic metabolism compared to healthy control brains when imaged using hyperpolarized [1-13C]-pyruvate MRI and may be related to the course of disease.
Introduction
Hyperpolarized [1-13C]-pyruvate (HP 13C-pyruvate) MRI1 has been used to profile the metabolic state of the human brain in healthy participants2–4 and cancer5,6. However, the metabolic profile of normal appearing brain parenchyma in cancer patients with systemic and/or local disease has not been characterized and may be related to the course of disease. It is hypothesized that the metabolic state of the brain parenchyma may be affected by the immune response or cell signaling mechanisms. For example, immune cells such as microglia increase glycolytic metabolism when responding to a foreign object7. Inflammatory responses are also induced via treatments such as chemotherapy8. Aside from an immune response, tumors themselves may have local and distant metabolic effects in the brain. In an isotopic study evaluating melanoma in zebrafish, Naser et al showed that tumors had a distant metabolic effect on the liver9. Cancer-associated cachexia is another example of this crosstalk resulting in distant metabolic alterations10. It is also possible that the metabolic state of the brain may be altered by other mechanisms such as psychiatric comorbidities11. As such, this work investigates whether patients with brain metastases exhibit differential metabolism in normal appearing brain parenchyma using HP 13C-pyruvate MRI.Methods
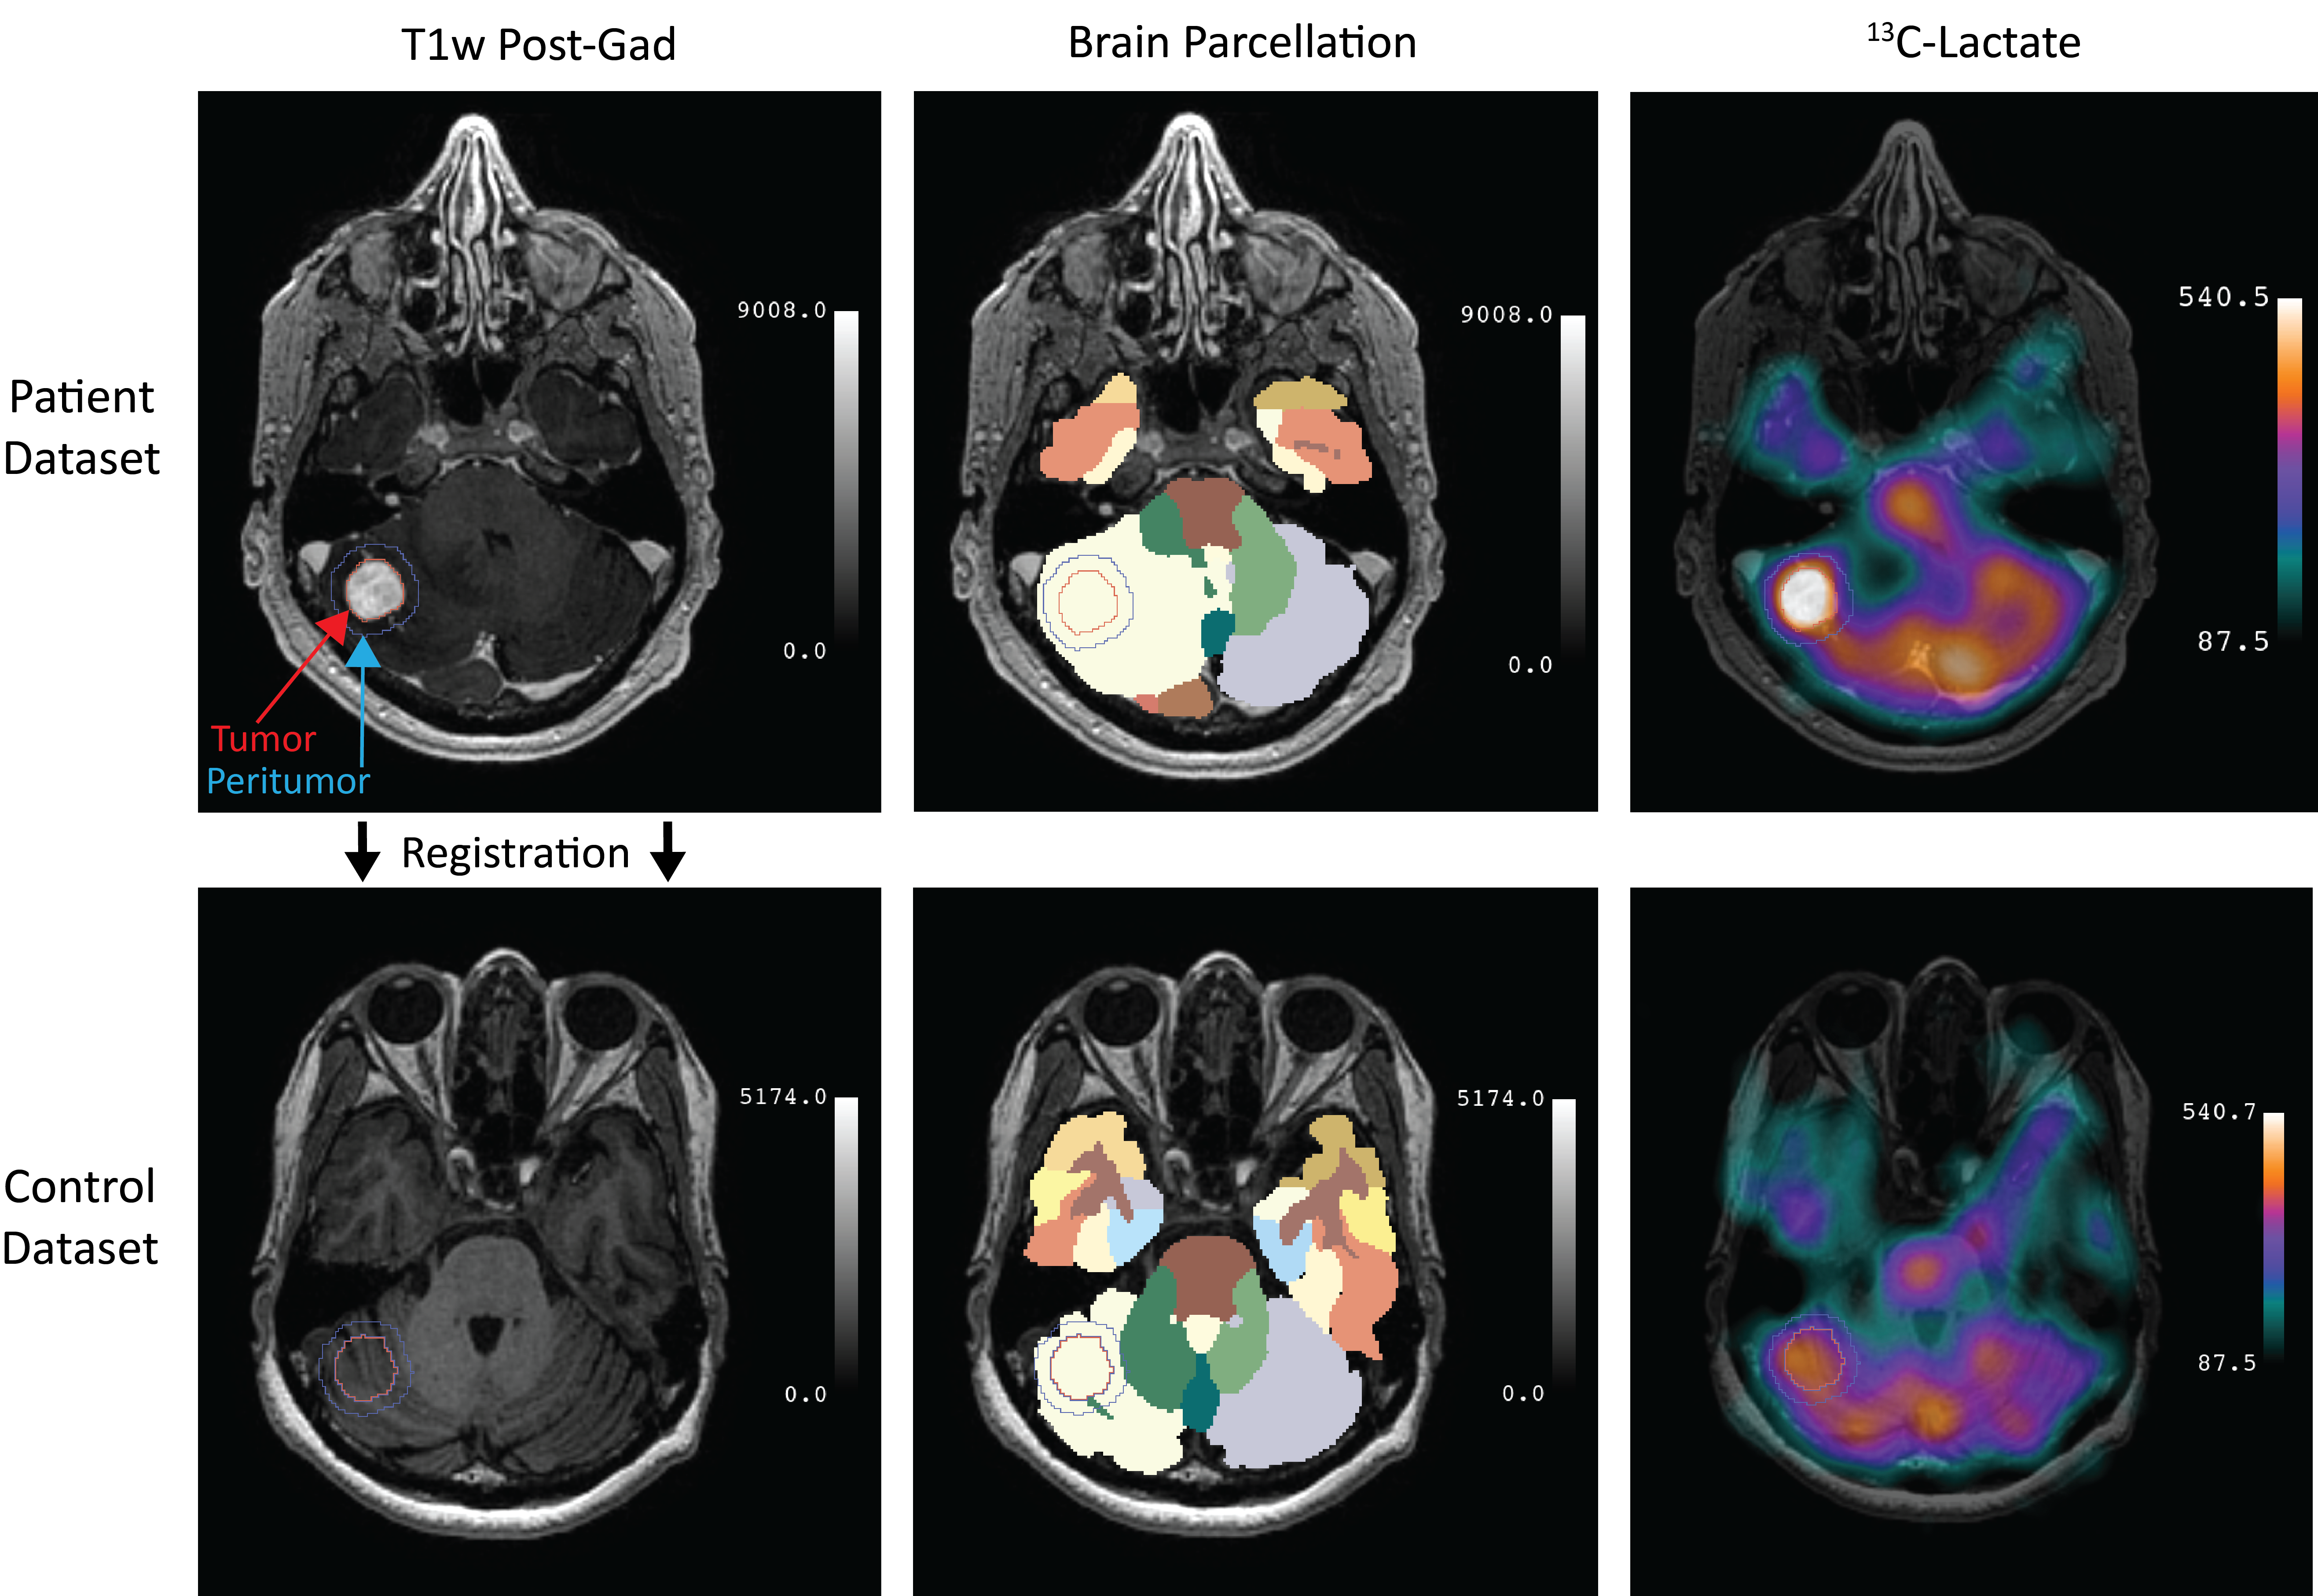
Written informed consent was obtained from N=5 patients with brain metastases and M=5 age- and gender-matched healthy control subjects12 under a protocol approved by the Sunnybrook Research Institute Research Ethics Board and Health Canada. Patients had only one tumor. A 0.43 mL/kg dose of 250 mM [1-13C]-pyruvate was hyperpolarized in a GE SPINLab polarizer and intravenously injected at 4mL/s, followed by a saline flush. Participants were scanned using a GE MR750 3.0T MRI scanner (GE Healthcare, WI) and a custom 13C birdcage coil. A 3D dual-echo echo-planar imaging sequence acquired time-resolved volumetric images of 13C-pyruvate, 13C-lactate and 13C-bicarbonate (5s temporal resolution; 1.5cm isotropic spatial resolution; 24×24×36cm3 field of view)13,14. An 8-channel 1H neurovascular array (Invivo Inc.) was used to acquire 1H T1w (with gadolinium for patients) and T2-FLAIR images.13C image reconstruction was done in MATLAB and the area under the curve for 13C-pyruvate (pyr), 13C-lactate (lac) and 13C-bicarbonate (bic) was calculated (Figure 1). Tumors were contoured by a radiation oncologist and expanded by 5mm to generate peritumoral volumes (i.e. excluding the tumor). Brain images were parcellated into 132 regions using SLANT15. T1w images for each patient-control pair were rigidly registered using FSL-FLIRT16–18. The mean metabolite signal and volume was quantified for each region excluding those involved with tumor. Lac/bic, lac/pyr, bic/pyr ratios were used for analysis.
A mixed effects linear regression with interaction tested whether patient and control brains exhibited differential metabolic profiles. The interaction term tested whether specific brain regions affected metabolite ratios. A Mann-Whitney U test with false discovery rate (FDR) correction was used to identify brain regions with significantly different metabolism. Finally, a comparison between the metabolism in the peritumoral volume of patients compared to the same regions in controls was used to measure any effect of the tumor on the surrounding environments.
Results and Discussion
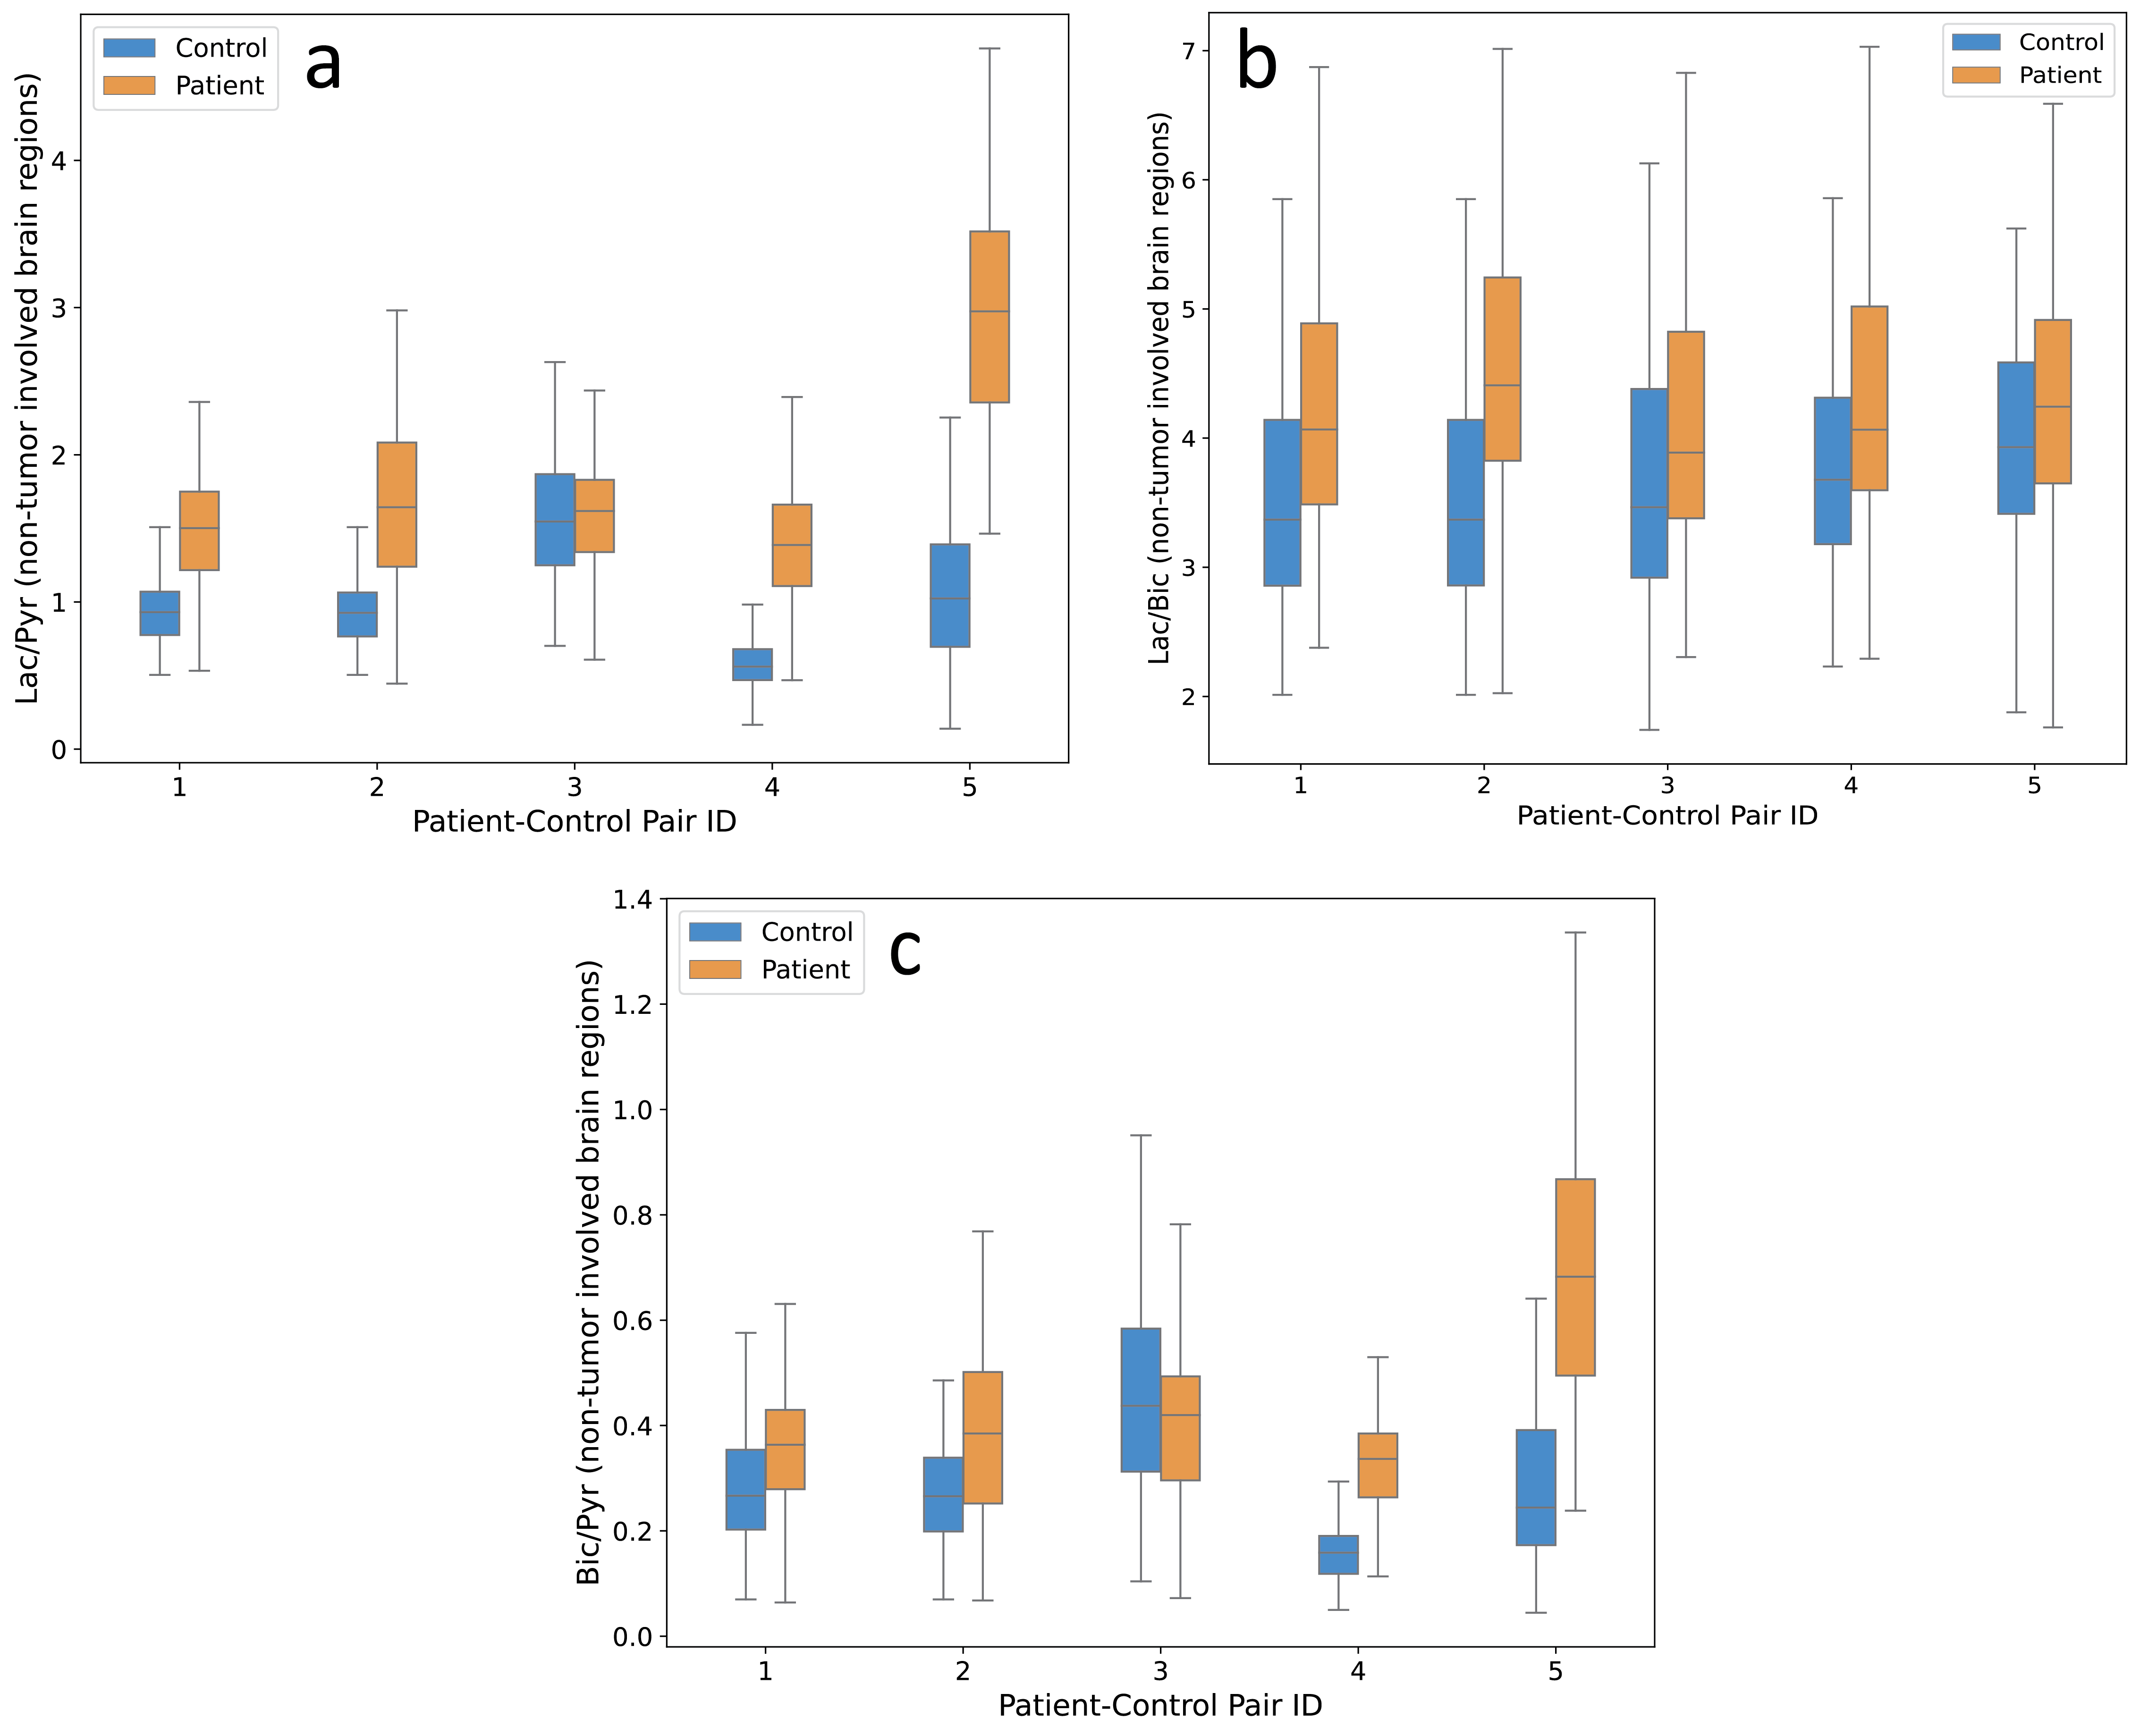
Of the 132 different brain regions, 3-6 regions were removed from the analysis depending on the patients’ tumor location, leaving 126-129 non-tumor involved brain regions for analysis depending on the patient-control pair.Figure 2 demonstrates significant increases in lac/bic, lac/pyr and bic/pyr in patients for the majority of patient-control pairs. Accordingly, the mixed effects model (MEM) found that the lac/bic (p=0.0004) and lac/pyr (p=0.04) were increased in patients. The interaction term in the MEM suggested that the majority of brain regions experienced a similar increase in the metabolite ratios and the effect did not depend on individual regions. However, a Mann-Whitney U Test identified 49 regions (after FDR correction) with greater lac/pyr in patients compared to controls (p<0.05). Lac/bic and bic/pyr was not significantly different in individual regions. The same MEM did not identify any differences in brain region volume between patients and controls.
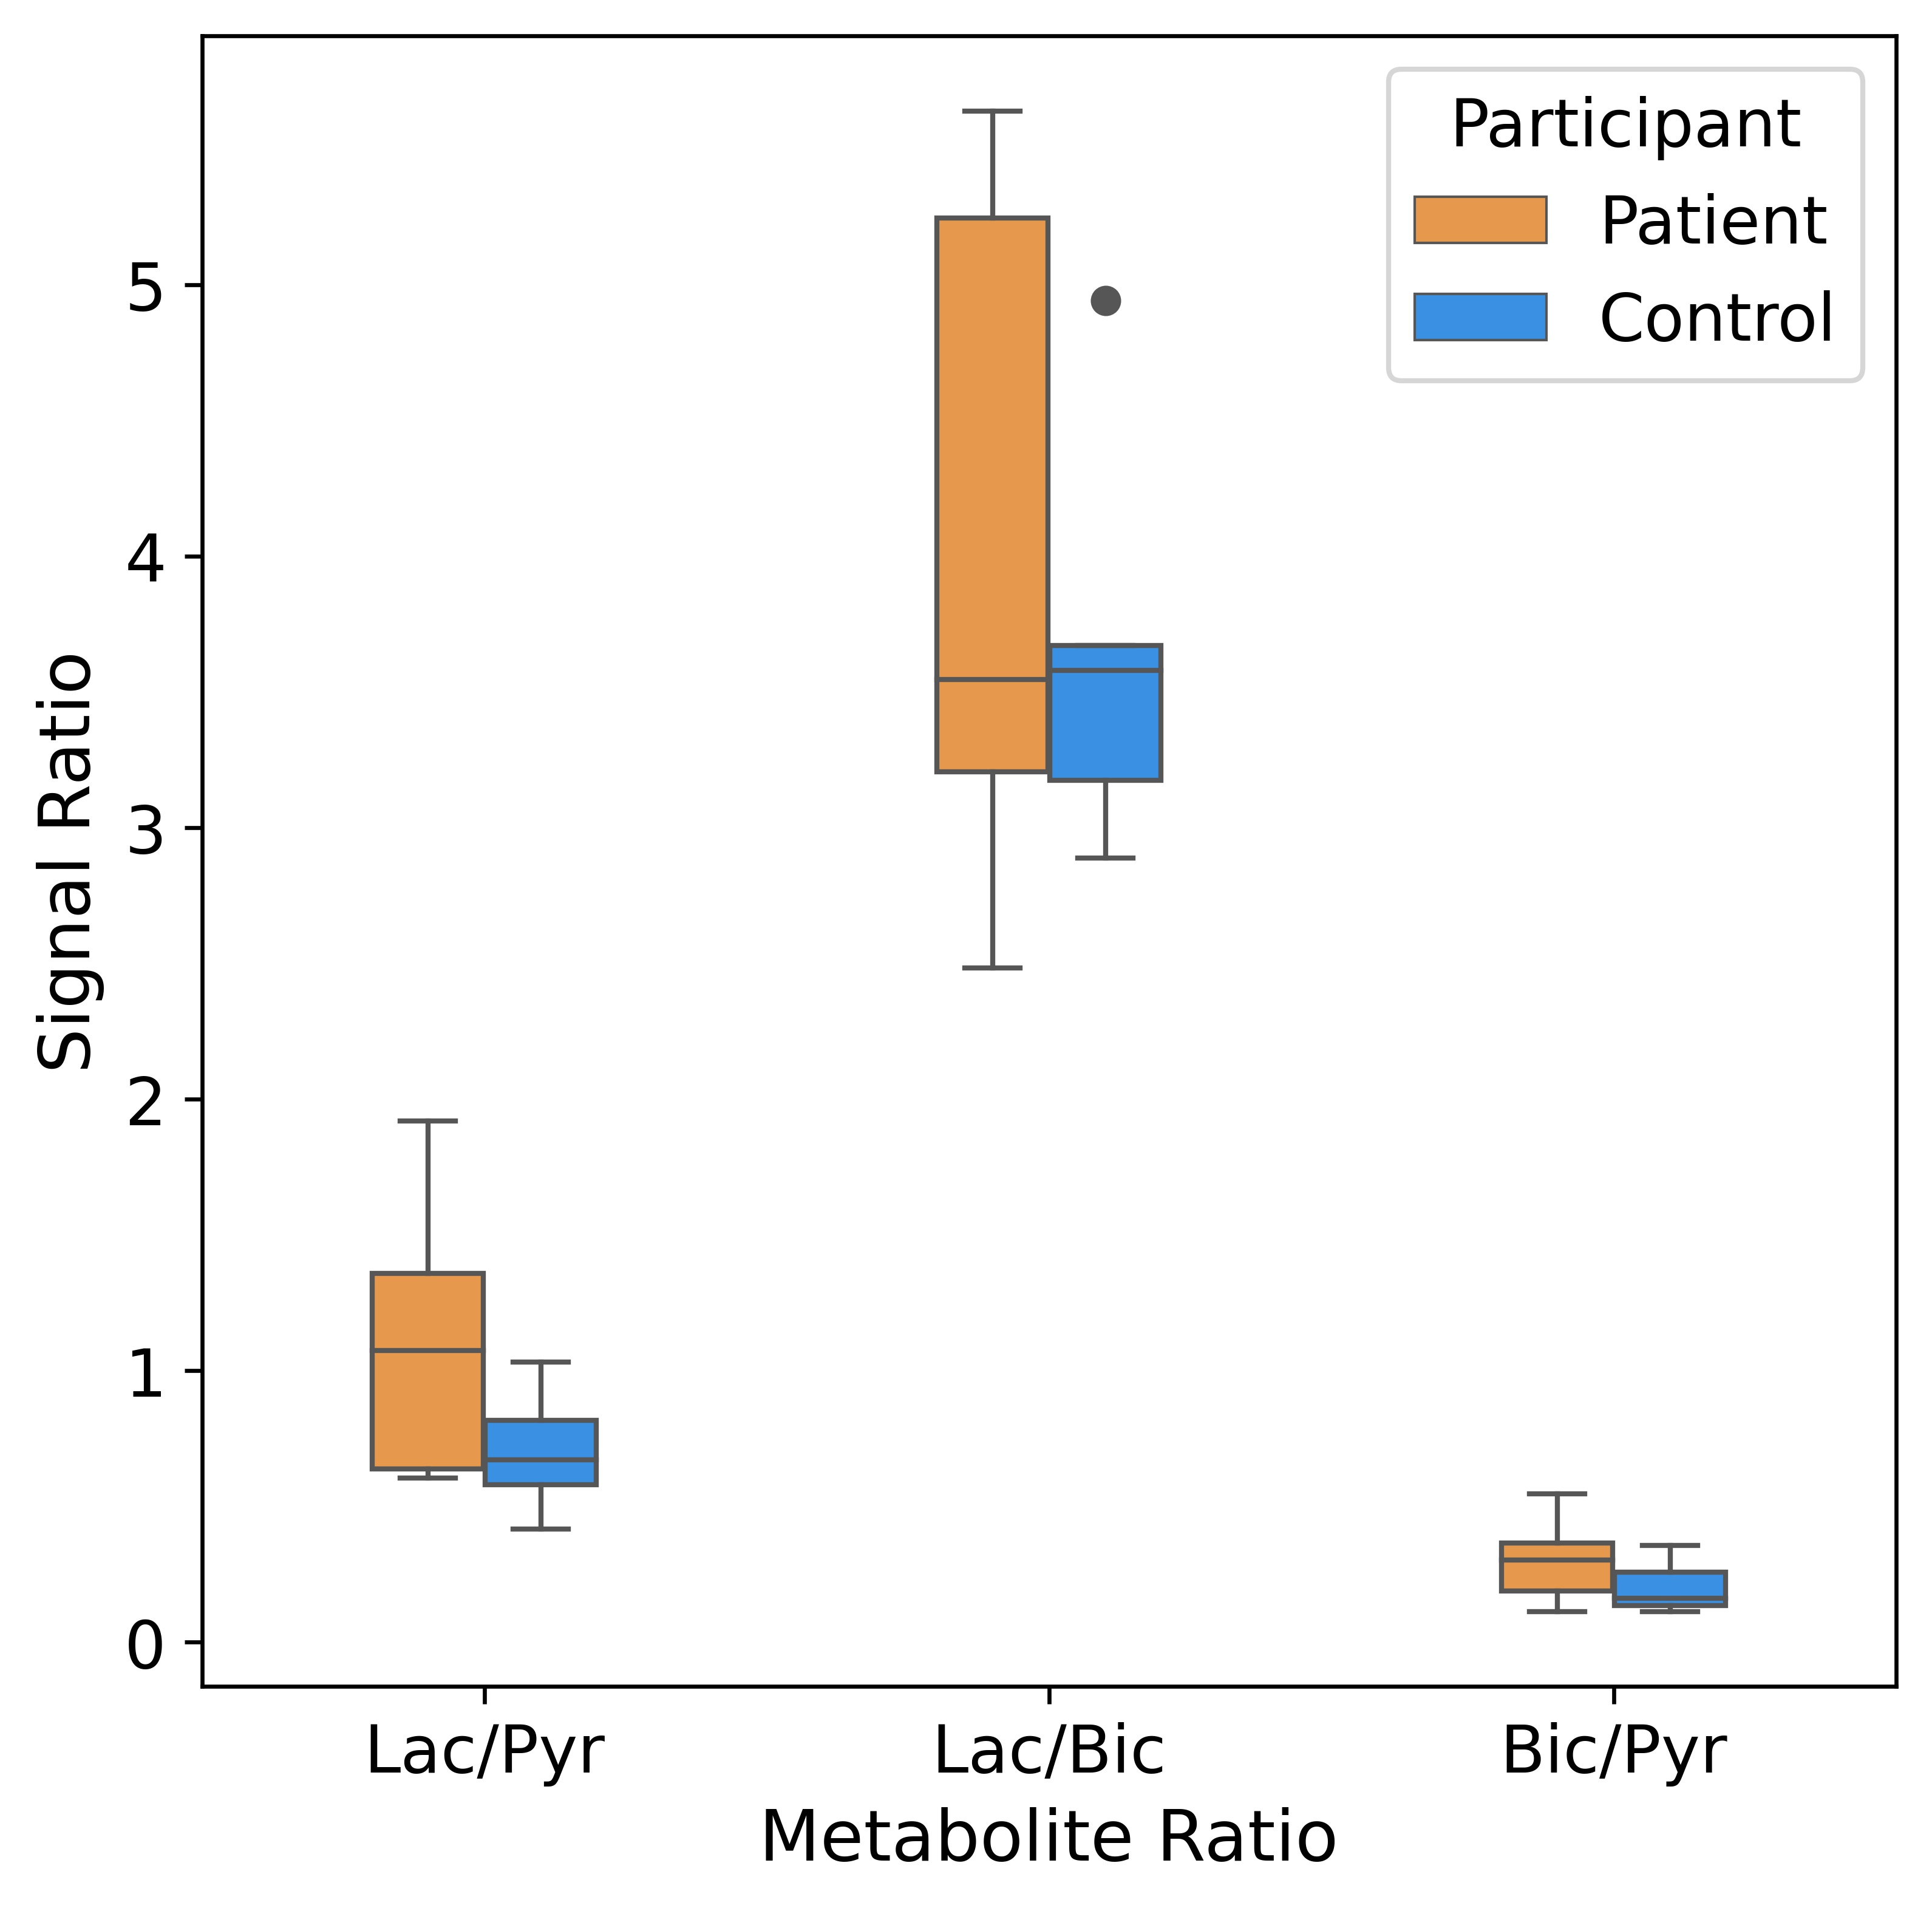
This study also explored peritumoral volumes to assess the tumors’ local effects on normal appearing tissue likely involved with microscopic disease. Figure 3 demonstrates the difference in the metabolite ratios in patients and control. The three metabolite ratios exhibit an increasing trend in patients; however, significance was not reached. Efforts to increase sample size and include patients with more than one metastasis are ongoing.
Conclusion
This work evaluated the metabolic profiles of normal appearing brain parenchyma in patients with brain metastases using HP 13C-pyruvate MRI. Significant increases in the lac/bic (p=0.0004) and lac/pyr (p=0.04) ratios were observed in normal appearing brains of patients with brain metastases compared to age and gender matched healthy control brains.Acknowledgements
We would like to acknowledge the following sources of funding: The Canadian Cancer Society Research Institute, NSERC: RGPIN-2016-05566, and CIHR: CIHR PJT152928.References
1. Kurhanewicz J, Vigneron DB, Ardenkjaer-Larsen JH, et al. Hyperpolarized 13C MRI: Path to Clinical Translation in Oncology. Neoplasia. 2019;21(1):1-16. doi:10.1016/j.neo.2018.09.006
2. Lee CY, Soliman H, Geraghty BJ, et al. Lactate topography of the human brain using hyperpolarized 13C-MRI. NeuroImage. 2020;204:116202. doi:10.1016/j.neuroimage.2019.116202
3. Lee CY, Lau JYC, Geraghty BJ, Chen AP, Gu YP, Cunningham CH. Correlation of hyperpolarized 13C-MRI data with tissue extract measurements. NMR Biomed. 2020;33(5):e4269. doi:https://doi.org/10.1002/nbm.4269
4. Chung BT, Chen HY, Gordon J, et al. First hyperpolarized [2-13C]pyruvate MR studies of human brain metabolism. J Magn Reson. 2019;309:106617. doi:10.1016/j.jmr.2019.106617
5. Lee CY, Soliman H, Bragagnolo ND, et al. Predicting response to radiotherapy of intracranial metastases with hyperpolarized 13C MRI. J Neurooncol. Published online March 19, 2021. doi:10.1007/s11060-021-03725-7
6. Miloushev VZ, Granlund KL, Boltyanskiy R, et al. Metabolic Imaging of the Human Brain with Hyperpolarized 13C Pyruvate Demonstrates 13C Lactate Production in Brain Tumor Patients. Cancer Res. 2018;78(14):3755-3760. doi:10.1158/0008-5472.CAN-18-0221
7. Manosalva C, Quiroga J, Hidalgo AI, et al. Role of Lactate in Inflammatory Processes: Friend or Foe. Front Immunol. 2022;12. doi: https://doi.org/10.3389/fimmu.2021.808799
8. Horky LL, Gerbaudo VH, Zaitsev A, et al. Systemic chemotherapy decreases brain glucose metabolism. Ann Clin Transl Neurol. 2014;1(10):788-798. doi:10.1002/acn3.121
9. Naser FJ, Jackstadt MM, Fowle-Grider R, et al. Isotope tracing in adult zebrafish reveals alanine cycling between melanoma and liver. Cell Metab. 2021;33(7):1493-1504.e5. doi:10.1016/j.cmet.2021.04.014
10. Petruzzelli M, Wagner EF. Mechanisms of metabolic dysfunction in cancer-associated cachexia. Genes Dev. 2016;30(5):489-501. doi:10.1101/gad.276733.115
11. Kumano H, Ida I, Oshima A, et al. Brain metabolic changes associated with predisposition to onset of major depressive disorder and adjustment disorder in cancer patients –A preliminary PET study. J Psychiatr Res. 2007;41(7):591-599. doi:10.1016/j.jpsychires.2006.03.006
12. Uthayakumar B, Soliman H, Bragagnolo ND, et al. Age-associated change in pyruvate metabolism investigated with hyperpolarized 13C-MRI of the human brain. Hum Brain Mapp. 2023;44(10):4052-4063. doi:10.1002/hbm.26329
13. Geraghty BJ, Lau JYC, Chen AP, Cunningham CH. Dual-Echo EPI sequence for integrated distortion correction in 3D time-resolved hyperpolarized 13C MRI. Magn Reson Med. 2018;79(2):643-653. doi:10.1002/mrm.26698
14. Cunningham CH, Chen AP, Lustig M, et al. Pulse sequence for dynamic volumetric imaging of hyperpolarized metabolic products. J Magn Reson. 2008;193(1):139-146. doi:10.1016/j.jmr.2008.03.012
15. Huo Y, Xu Z, Xiong Y, et al. 3D whole brain segmentation using spatially localized atlas network tiles. NeuroImage. 2019;194:105-119. doi:10.1016/j.neuroimage.2019.03.041
16. Jenkinson M, Smith S. A global optimisation method for robust affine registration of brain images. Med Image Anal. 2001;5(2):143-156. doi:10.1016/S1361-8415(01)00036-6
17. Jenkinson M, Bannister P, Brady M, Smith S. Improved Optimization for the Robust and Accurate Linear Registration and Motion Correction of Brain Images. NeuroImage. 2002;17(2):825-841. doi:10.1006/nimg.2002.1132
18. Greve DN, Fischl B. Accurate and robust brain image alignment using boundary-based registration. NeuroImage. 2009;48(1):63-72. doi:10.1016/j.neuroimage.2009.06.060
Figures