0215
Hyperpolarize imaging of fructolysis in fed vs fasted mice liver1Memorial Sloan Kettering Cancer Center, New York, NY, United States, 2Weill Cornell Medicine, New York, NY, United States
Synopsis
Keywords: Hyperpolarized MR (Non-Gas), Metabolism
Motivation: Fructose intake has increased 80-times over the past century, although the effect of this increase in the body remains unclear.
Goal(s): To assess the metabolic flux of fructose at different metabolic states (fed vs fasted) for future human studies.
Approach: Fed or fasted mice were injected with hyperpolarized fructose to observe metabolic flux.
Results: Fed mice showed the formation of glucose (gluconeogenesis) by F1P, while fasted mice metabolized the fructose to obtain energy.
Impact: The results pressented have significant implications for the understanding of fructoylsis and provides a translational metabolic imaging strategy for future human studies.
Introduction
Since the early 19th century, fructose intake has increased from less 0.5 g/day to more than 40 g/day.1 The differential effects this increased fructose load has on various organs in the body remains unclear. Fructose can form fructose-1-phosphate (F1P) or fructose-6-phosphate (F6P) depending on the enzymatic landscape of the cell, through ketohexokinase (KHK) or hexokinase (HK), respectively, resulting in differential metabolic utilization. Previously, it has been reported that the normal liver expresses high levels of KHK and that this is potentially lost with progression to liver cancer as a mediator of diverted metabolic flux. Here using in vitro isotope tracing and hyperpolarized magnetic resonance in combination with [2-13C,U-2H]fructose we probe the effect of fed state on liver metabolic flux in vivo.Methods
In vitro experiments: HepG2 cells with KHK overexpression (KHK-OV) or control overexpression (Ctrl-OV) were cultured in 10 mM 13C-fructose for 4 hours. The levels of metabolites in cell extracts were measured using a high-field NMR spectrometer (Ultrashield Plus 14.1T, Bruker), and targeted LC-MS analyses on a Q Exactive Orbitrap Mass Spectrometer (Thermo Fisher Scientific).In vivo experiments: Two groups of Balbc/J mice, fed and fasted (6 h, n=3) with free access to water, were studied for fructose metabolism using 1H/13C volume coil (RAPID MR International, OK)### under an approved animal protocol (IACUC 13-12-019). [2-13C,U-2H]fructose, deuterated as previously reported2, was prepared for HP using SpinLab (General Electric, NY) before dissolving to a final concentration of 50 mM. After dissolution, 350uL of solution was injected into the mice via tail vein catheter for 10 sec. A 5-mm slice selective pulse-and-acquire sequence with an excitation flip angle of 30°, spectral width of 2,564 Hz, and 2048 points was used to acquire 13C spectra from the liver every 1 s over a 2 min period starting at the same time as dissolution. Data were reconstructed offline using MATLAB (MathWorks) and further analyzed with MestReNova.
Results and Discussion
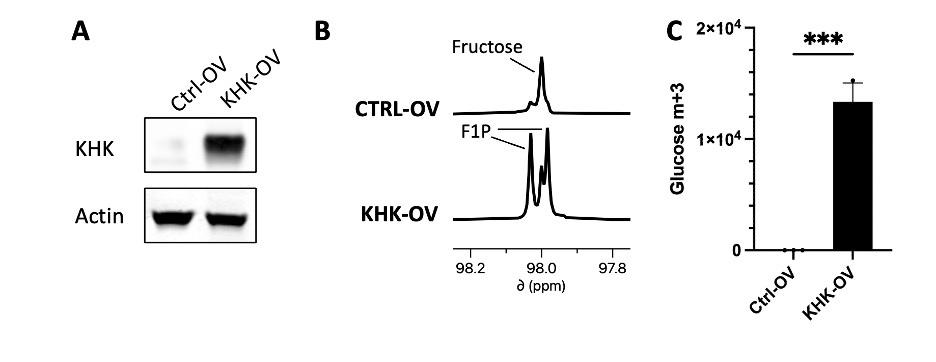
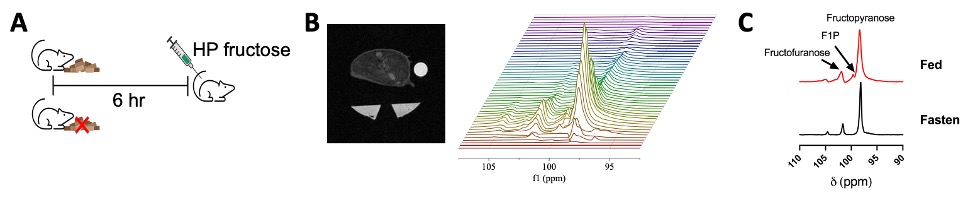
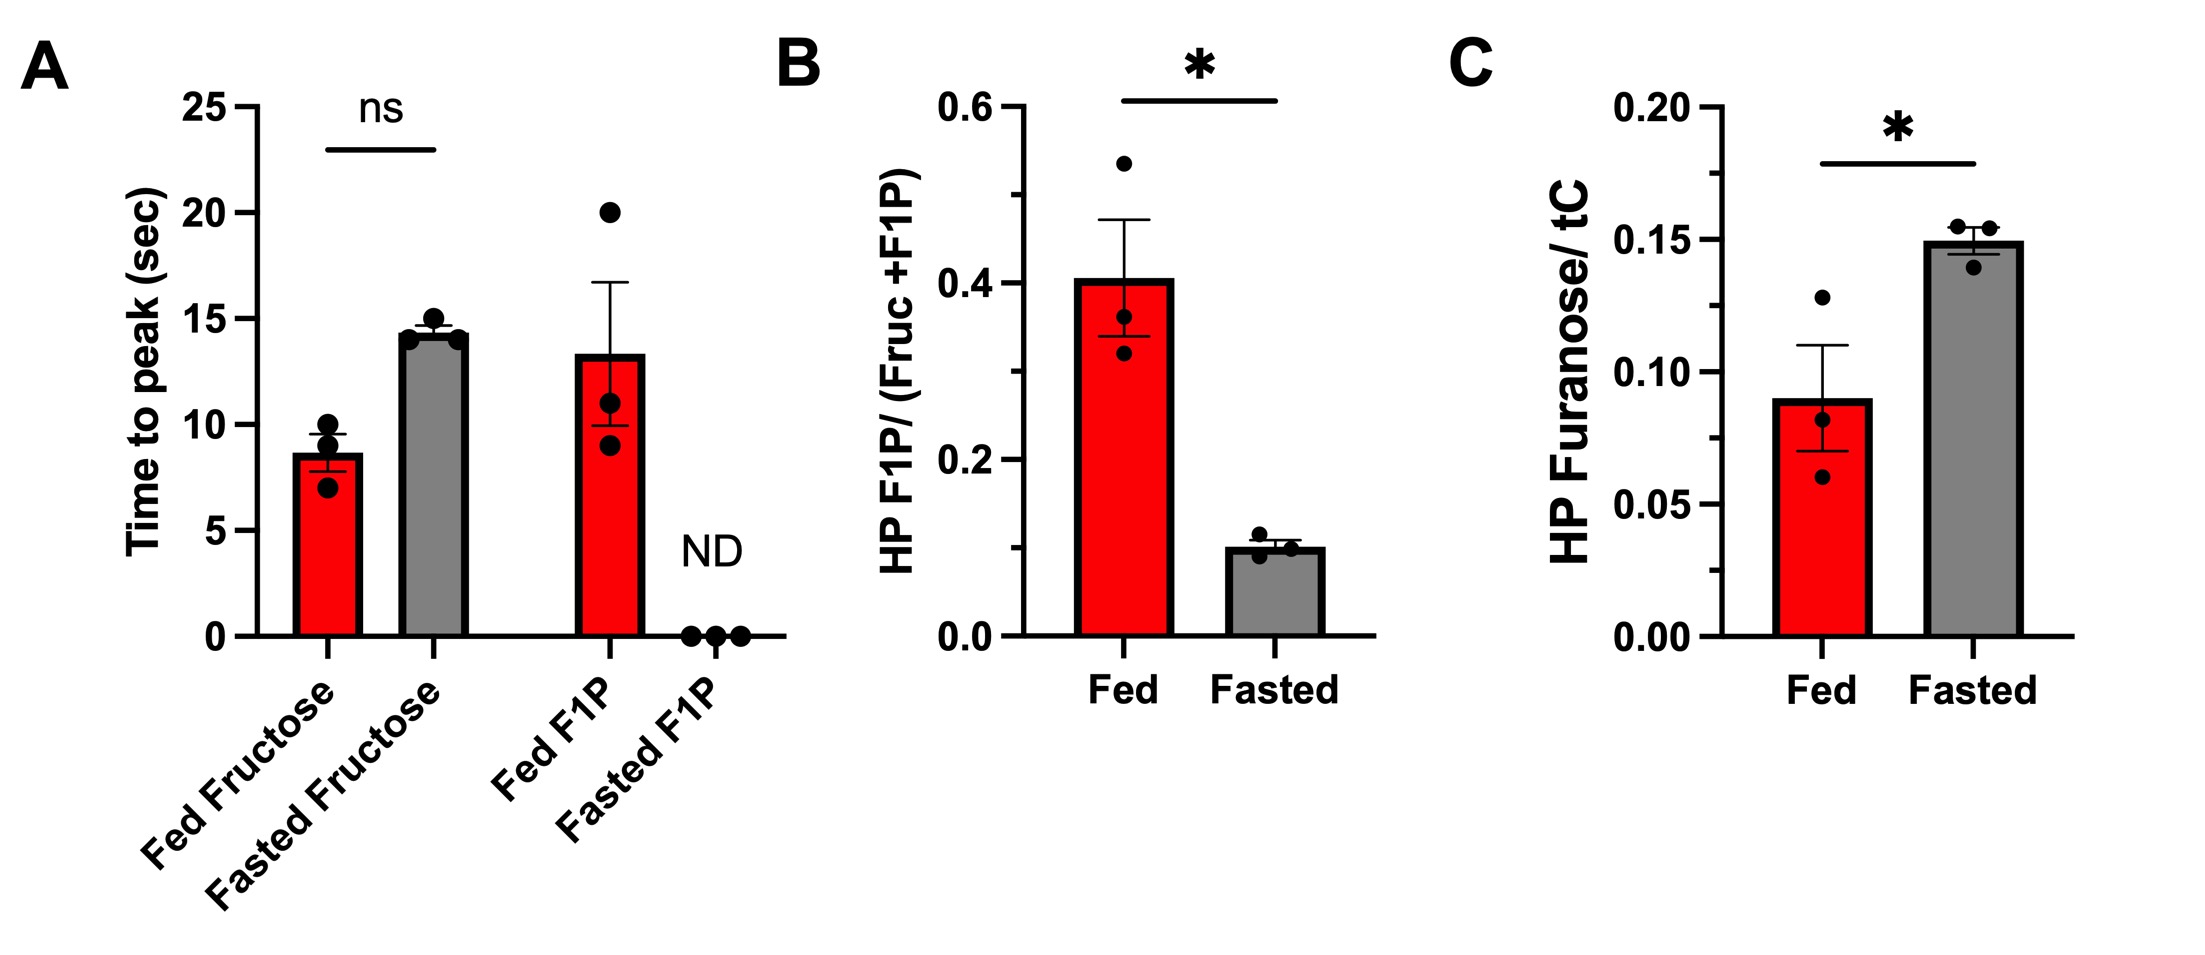
Overexpression of KHK in human hepatoma cells (HepG2, Figure 1a), facilitates their ability to metabolize fructose through KHK, generating high levels of [2-13C]fructose-1-phosphate from [2-13C]fructose (Figure 1b). Moreover, isotope tracing LC/MS showed that these cells gain the ability to produce 13C labeled glucose via gluconeogenesis in culture, as shown by the production of glucose m+3 under fructose condition only when KHK is overexpressed (Figure 1c). This supports the notion that KHK expression dictates the flux direction of fructose metabolism.To observe this switch in metabolic flux in vivo, fed or 6-hour fasted mice were imaged using HP [2-13C,U-2H]fructose injection (Figure 2a). The fructose injected via tail vein catheter into the mice had a T1 of 66.4 ± 4.7 sec, a polarization of 12.7 ± 2.8%, and a concentration of 57.6 ± 7.1 mM. A representative of the slab selective 13C spectra obtained in one of the fed mice is shown in Figure 2b, the F1P peak can be clearly observed. Representative 13C spectra comparing fasted and fed mice demonstrates the significant decrease in F1P in the fasted state (Figure 2c). When looking at the time to peak (Figure 3a), as expected, fructose maximum signal was reached prior to F1P, supporting metabolic conversion in the normal fed liver. Fasted fructose time to peak was later, suggesting differential timing, though this was not significant. These results would suggest that when mice are fed, fructose goes directly to gluconeogenesis through F1P, while in a fasting state, it is burnt for energy. This idea is further confirmed when the areas under the curves are calculated (Figure 3). In the case of F1P, fed mice showed a significantly higher F1P production compared to the fasted (n=3, p<0.05), however, when looking at the HP furanose peak over the total carbon, which represents the flux into F6P, the trend is reversed (n=3, p<0.05, Figure 3c).
Conclusion
Herein, we presented the effect of the fed vs fasted state in fructose metabolism in the normal liver probed using HP [2-13C,U-2H]fructose. Similarly to results observed in cancer, the metabolic state which the mice are in would mediate a differential metabolic flux. This has significant implications for the understanding of fructoylsis and provides a translational metabolic imaging strategy for future human studies.Acknowledgements
No acknowledgement found.References
1. Charrez, B., Qiao, L. & Hebbard, L. The role of fructose in metabolism and cancer. Horm. Mol. Biol. Clin. Investig. 22, 79–89 (2015).
2. Tee, S. S. et al. Ketohexokinase-mediated fructose metabolism is lost in hepatocellular carcinoma and can be leveraged for metabolic imaging. Sci. Adv. 8, eabm7985 (2022).
Figures