0210
Evaluation of Amide Proton Transfer-Weighted Imaging and T2 mapping for preoperative risk stratification of endometrioid adenocarcinoma1Qilu Hospital of Shandong University, Jinan city, Shandong province, China, 2GE Healthcare, Beijing, China, Beijing, China
Synopsis
Keywords: Uterus, Cancer, Amide proton transfer-weighted imaging; T2 mapping ; endometrioid adenocarcinoma; risk stratification
Motivation: Preoperative risk stratification of endometrioid adenocarcinoma (EA) impacts the choice of operative modality and prognosis of patients.
Goal(s): We aimed to perform an accurate and non-invasive preoperative risk stratification method for EA by MRI sequences.
Approach: APTw imaging as well as T2 mapping were included in this study.
Results: The APTw and T2 values showed significant differences between the low- and non-low-risk groups. Combining APTw with T2 mapping achieved the highest diagnostic efficacy in the preoperative risk stratification.
Impact: This suggested that the integrated use of APTw and T2 mapping can be an effective method for the preoperative risk assessment of EA.
INTRODUCTION
Risk stratification is invaluable guidance for the selection of operative procedures in patients with EA[1,2]. The commonly adopted risk stratification methods were biopsy and MRI. Although MRI as compared to biopsy is a non-invasive examination, the conventional sequences are susceptible to interference from diseases such as coexisting leiomyomas or adenomyosis, which tend to affect the accuracy of stratification results[3]. Therefore, it still needs to further explore non-invasive and accurate methods of preoperative risk stratification for EA.The APTw can indirectly measure amide proton signals in proteins and peptides through water signals and can reflect tumor metabolism[4]. T2 mapping as a quantitative imaging method indirectly reflects information about the content and composition of water and collagen by using T2 relaxation times (T2 values)[5]. Several studies have shown the application of APTw imaging and T2 mapping in the diagnosis, staging, and grading of endometrial cancer, whereas there have been few investigations using these two parameters for preoperative risk stratification in EA[6, 7].
Therefore, the objective of this study was to evaluate the value of APTw imaging, T2 mapping, and the combination of the two parameters in preoperative EA risk stratification, and hence to identify new available tools to accurately and efficiently perform risk stratification.
METHODS
Subjects75 patients known or suspected to have endometrial cancer were recruited in this study. Exclusion criteria: (1) patients underwent treatment prior to MRI examination; (2) images with severe motion and susceptibility artifacts; (3) lesions too small or poorly visible to detect.
MRI acquisition
All MR experiments were performed at a 3.0T-MR system (Discovery 750w, GE Healthcare, USA) with a 16-channel coil employed.
A two-dimensional spin-echo echo-planar imaging-based APTw imaging sequence was then performed on the largest slice of the lesion regarding anatomical images. The saturation pulse with amplitude of 2.0 μT and the continuous RF saturation for a duration of 2 seconds was implemented. TR/TE,4806/35.6ms; field-of-view, 220×220mm2; matrix, 128×128; slice thickness, 4mm; scan time, 3mins 27s.
T2 mapping was applied in axial view utilizing a stabilized MESE method, by acquiring two or more spin-echoes in a single repetition time (TR) duration. TR/TE,600/12.7-203.9ms; field-of-view, 240×240mm2; matrix, 256×192; slice thickness, 4mm; scan time, 3mins 56s.
Data analysis
The APTw imaging and T2 mapping were analyzed by GE ADW4.6 workstation. Two senior radiologists performed the regions of interest (ROIs) independently on the largest cross-section of the tumor on the T2WI, the ROIs were then autonomously copied to the APTw imaging and T2 mapping pseudo-color maps to calculate the APTw and T2 values. All ROI parameter values were evaluated three times on one slice and averaged for further assessment.Intraclass correlation coefficients (ICCs) was used to access the interobserver agreement[8]. Independent samples t-test were applied to compare quantitative variables between the two groups. The receiver operator characteristic (ROC) curve was conducted to evaluate the predictive performances of different parameters and the Delong test was implemented to compare the area under the curve (AUC) for each of the meaningful parameters and their combinations. P < 0.05 was considered statistically significant. Statistical analyses were conducted utilizing SPSS Software (version 26.0).
RESULTS
33 (44%) patients were categorized into the low-risk group and 42 (56%) patients were categorized into the non-low-risk group for data analysis.There were excellent agreements between the two observers for the measurements of APTw imaging and T2 mapping, with ICC results of 0.907 and 0.945, respectively.
The APTw values of the low-risk EA group were significantly lower than those of the non-low-risk EA group ([1.7.42 ± 0.453]% vs [26.084 ± 6.787]%, P < 0.001). The T2 values of the low-risk EA group were significantly higher than those of the non-low-risk EA group ([102.231 ± 9.485] ms vs [93.291 ± 7.354] ms, P < 0.001) (Figure 1-3). The combination of APTw and T2 mapping yielded the highest AUC of 0.882 which had no significant difference with APTw but was significantly higher than T2 mapping alone (AUC= 0.843 and 0.757, respectively) (Figure 4-5).
DISCUSSION
Our results showed that APTw and T2 values differed significantly between the two groups. This may be attributed to the more active mitosis and synthesis of mobile proteins and peptides in non-low-risk EA compared to low-risk tumors, leading to higher APTw values[9]. Additionally, lower T2 values were observed, likely due to increased tumor cell density, which reduces extracellular space and decreases the water content in tumor tissues.[10,11].CONCLUSION
Combined APTw and T2 mapping may be an effective imaging biomarker for predicting risk stratification of EA.Acknowledgements
No acknowledgement found.References
[1] Kitchener H, Swart A M, Qian Q, et al. Efficacy of systematic pelvic lymphadenectomy in endometrial cancer (MRC ASTEC trial): a randomised study[J]. Lancet, 2009, 373(9658): 125-36.
[2] Marin F, Pleşca M, Bordea C I, et al. Postoperative surgical complications of lymphadenohysterocolpectomy[J]. J Med Life, 2014, 7(1): 60-6.
[3] Sala E, Rockall A G, Freeman S J, et al. The added role of MR imaging in treatment stratification of patients with gynecologic malignancies: what the radiologist needs to know[J]. Radiology, 2013, 266(3): 717-40.
[4] Zhou J, Payen J F, Wilson D A, et al. Using the amide proton signals of intracellular proteins and peptides to detect pH effects in MRI[J]. Nat Med, 2003, 9(8): 1085-90.
[5] Puntmann V O, Isted A, Hinojar R, et al. T1 and T2 Mapping in Recognition of Early Cardiac Involvement in Systemic Sarcoidosis[J]. Radiology, 2017, 285(1): 63-72.
[6] Takayama Y, Nishie A, Togao O, et al. Amide Proton Transfer MR Imaging of Endometrioid Endometrial Adenocarcinoma: Association with Histologic Grade[J]. Radiology, 2018, 286(3): 909-917.
[7] Xu H, Zhang J, Han Y, et al. Role of T2 mapping of magnetic resonance imaging in the differentiation of endometrial cancer and benign endometrial lesions[J]. Diagn Interv Radiol, 2023, 29(1): 183-189.
[8] Lin Y, Luo X, Yu L, et al. Amide proton transfer-weighted MRI for predicting histological grade of hepatocellular carcinoma: comparison with diffusion-weighted imaging[J]. Quant Imaging Med Surg, 2019, 9(10): 1641-1651.
[9] Ray K J, Simard M A, Larkin J R, et al. Tumor pH and Protein Concentration Contribute to the Signal of Amide Proton Transfer Magnetic Resonance Imaging[J]. Cancer Res, 2019, 79(7): 1343-1352.
[10] Wang F, Zhang H, Wu C, et al. Quantitative T2 mapping accelerated by GRAPPATINI for evaluation of muscles in patients with myositis[J]. Br J Radiol, 2019, 92(1102): 20190109.
[11] Langer D L, Van Der Kwast T H, Evans A J, et al. Intermixed normal tissue within prostate cancer: effect on MR imaging measurements of apparent diffusion coefficient and T2--sparse versus dense cancers[J]. Radiology, 2008, 249(3): 900-8.
Figures
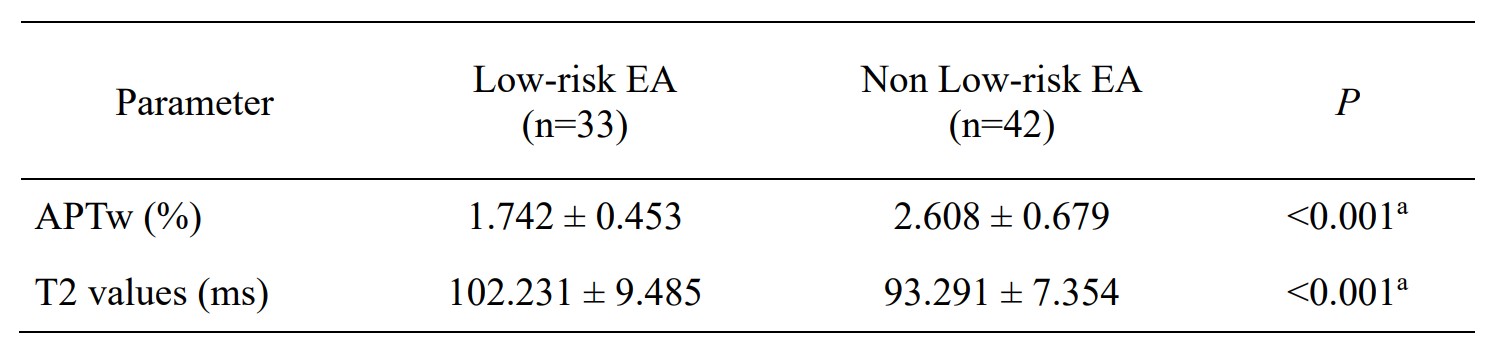
FIGURE 1: Comparison values of the APTWI and T2 mapping parameters between low- and non low-risk EA.
a P < 0.05 calculated by independent sample t-test.
EA = endometrioid adenocarcinoma; APTw = amide proton transfer-weighted imaging.
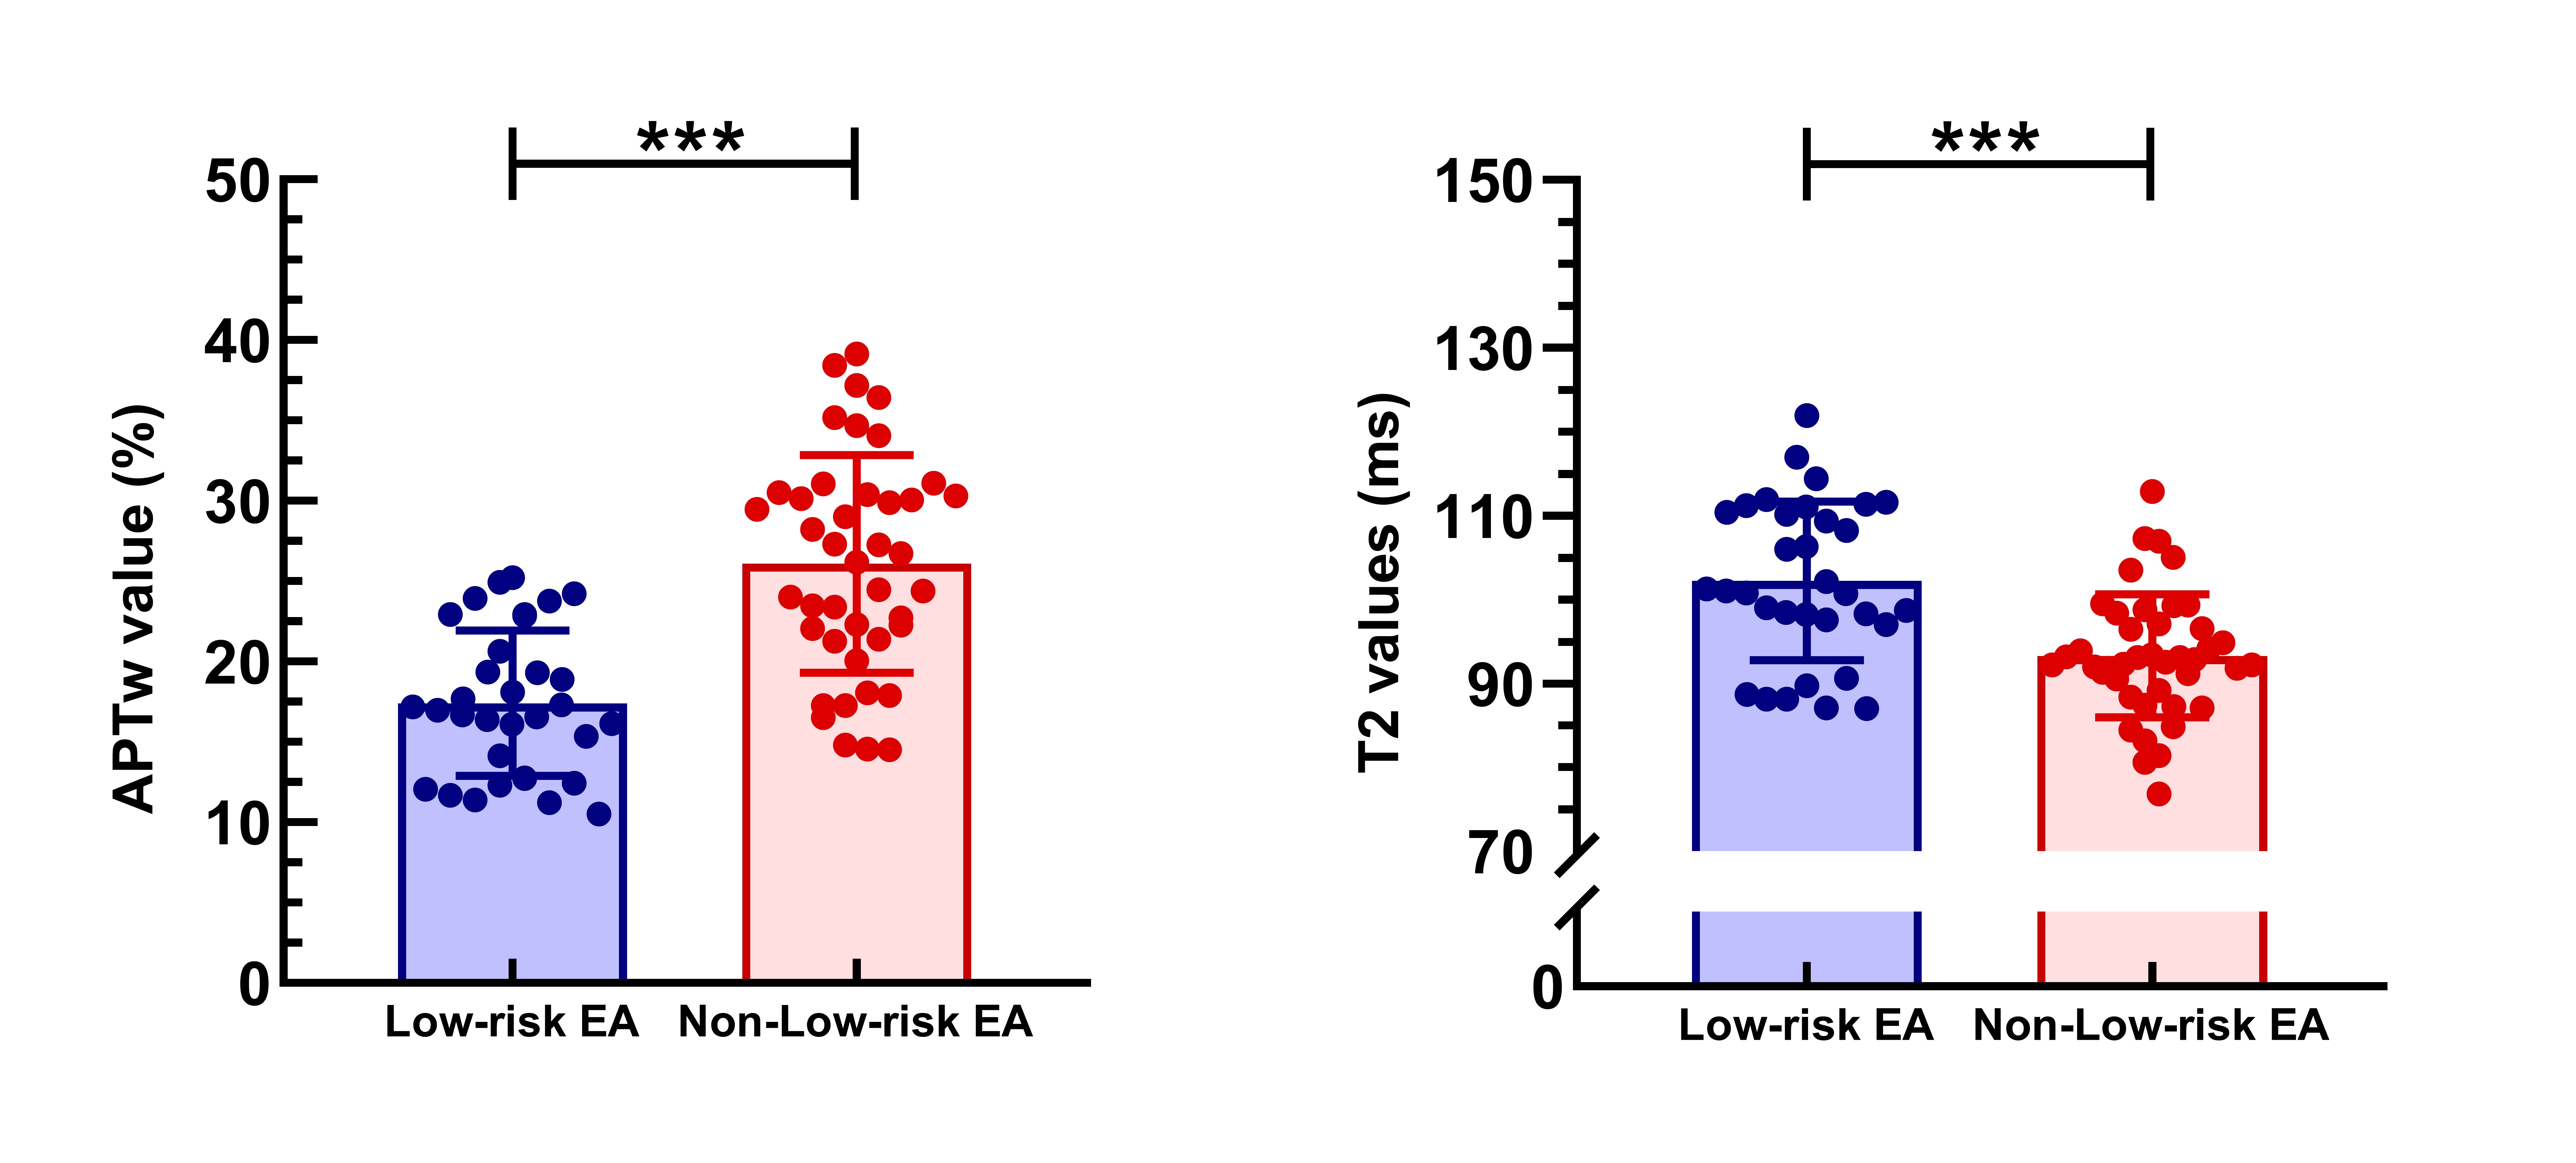
FIGURE 2: The scatter plot with bar chart for APTw (a) and T2 values in low- and non-low-risk EA. There were significant differences in APTw and T2 values between low- and non-low-risk EA (***P < 0.001).
APTw = amide proton transfer-weighted imaging; EA = endometrioid adenocarcinoma.
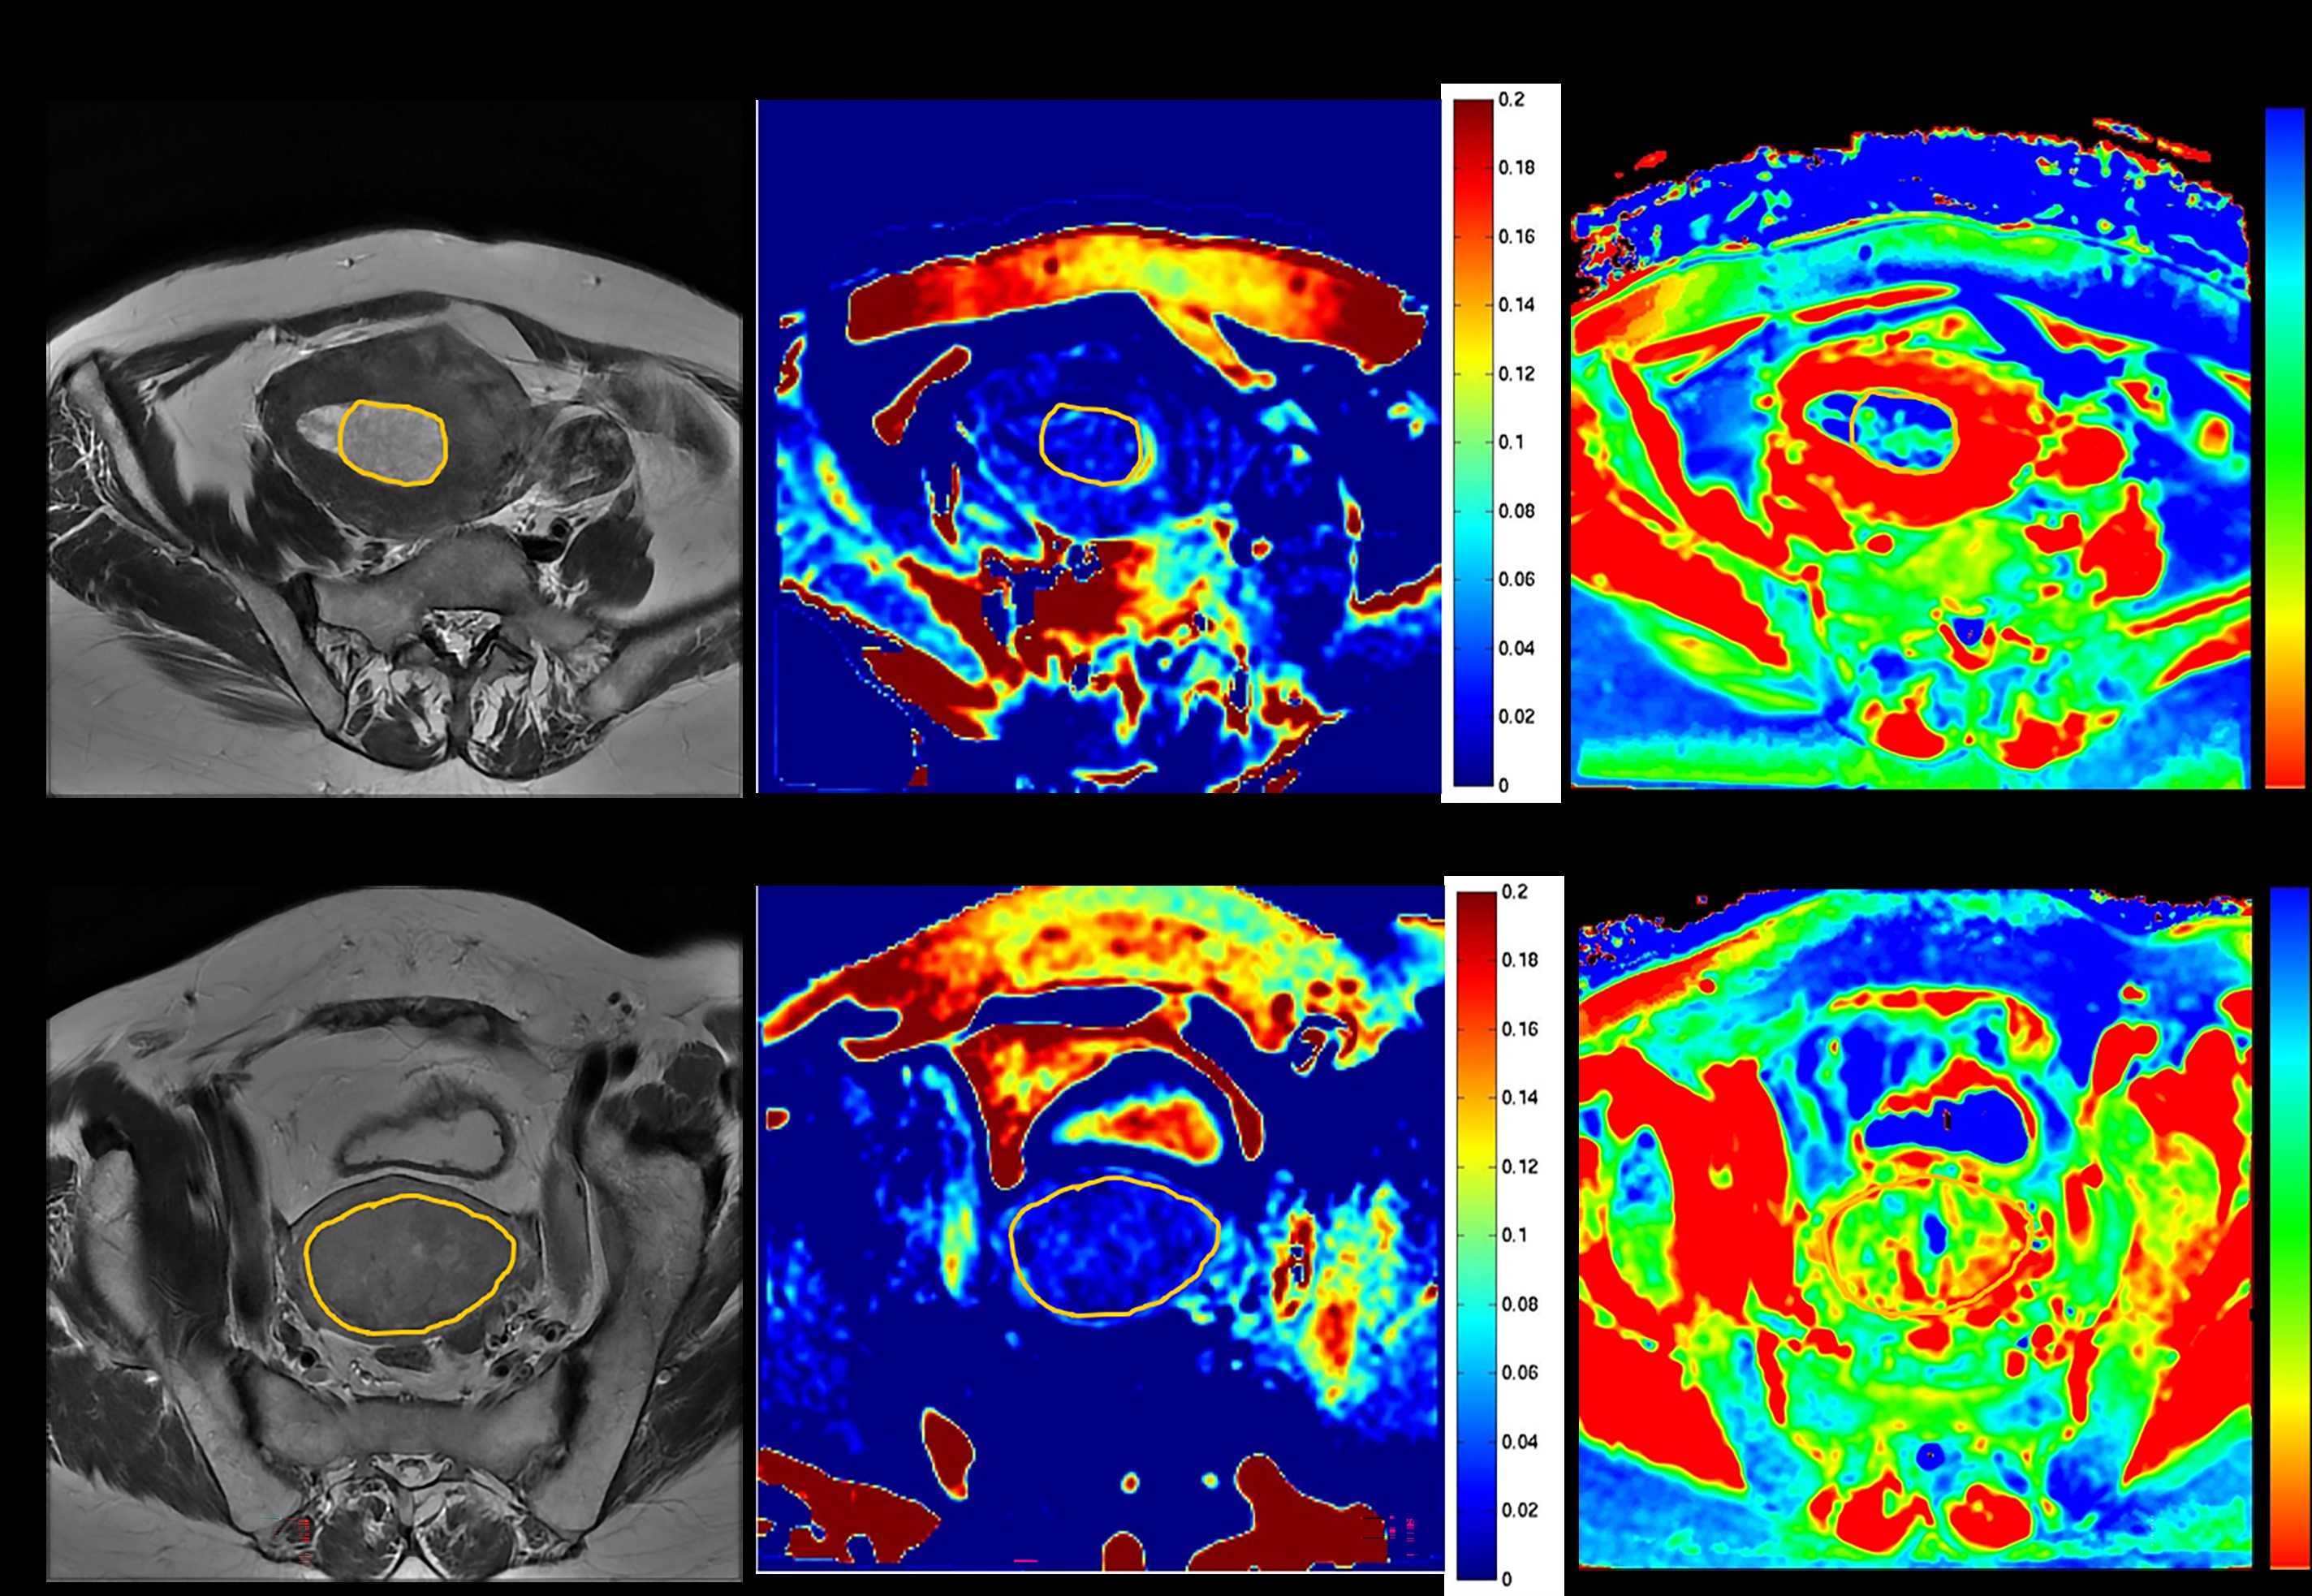
FIGURE 3: (a-c) Images were acquired from a 51-year-old female diagnosed with low-risk EA. (d-f) Images were acquired from a 60-year-old female diagnosed with non-low-risk EA. (a,d) T2-weighted imaging, (b,e) The APTw values were 1.448% in low-risk EA and 2.396% in non-low-risk EA in APTw images, respectively. (c,f) The T2 values were 119.421 ms in low-risk EA and 97.358 ms in non-low-risk EA in T2 mapping, respectively. The color bar indicates the APTw and T2 values.
APTw = amide proton transfer-weighted imaging; EA = endometrioid adenocarcinoma.
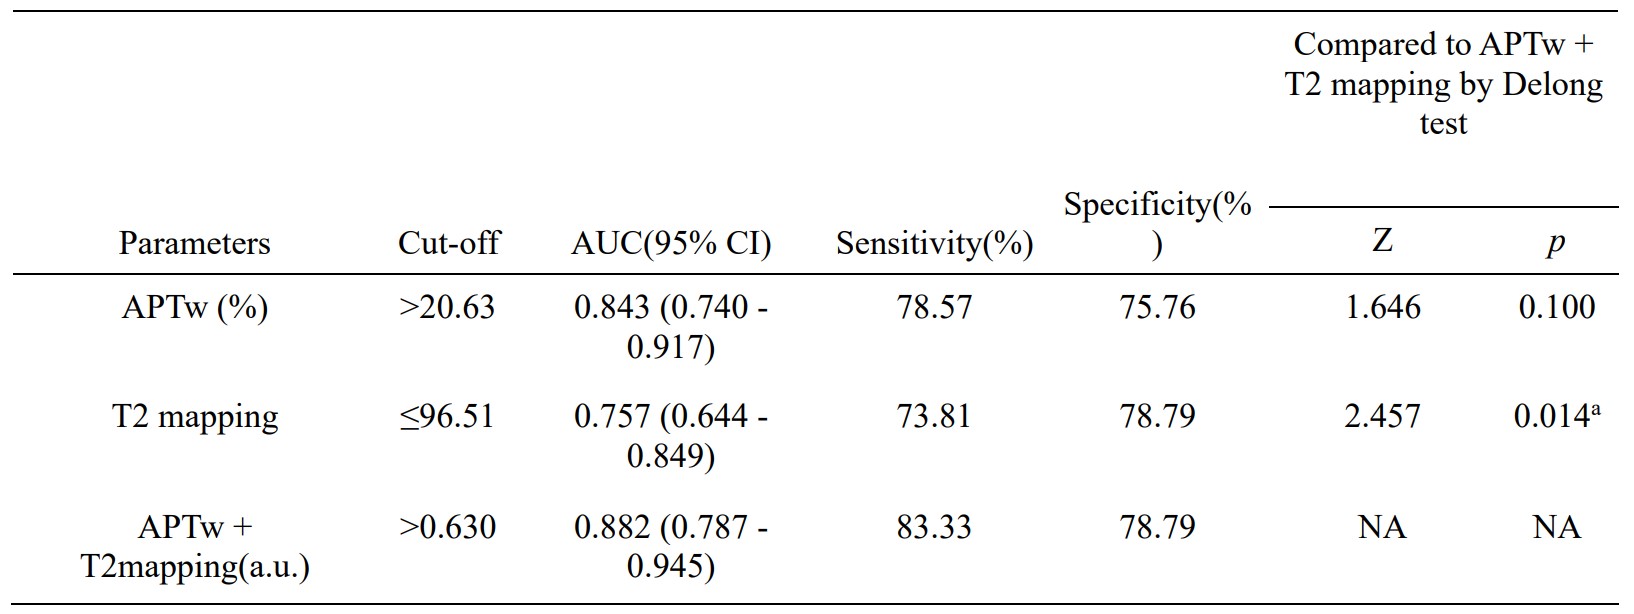
FIGURE 4: ROC curve analysis of the performance of APTw imaging, T2 mapping, and the combined parameter to evaluate the risk of EA. APTw + T2 mapping represents the combination of APTWI and T2 mapping.
a indicated the comparison with statistical significance.
AUC = area under the curve; APTw = amide proton transfer-weighted imaging; EA = endometrioid adenocarcinoma; a.u., arbitrary unit; NA, not available
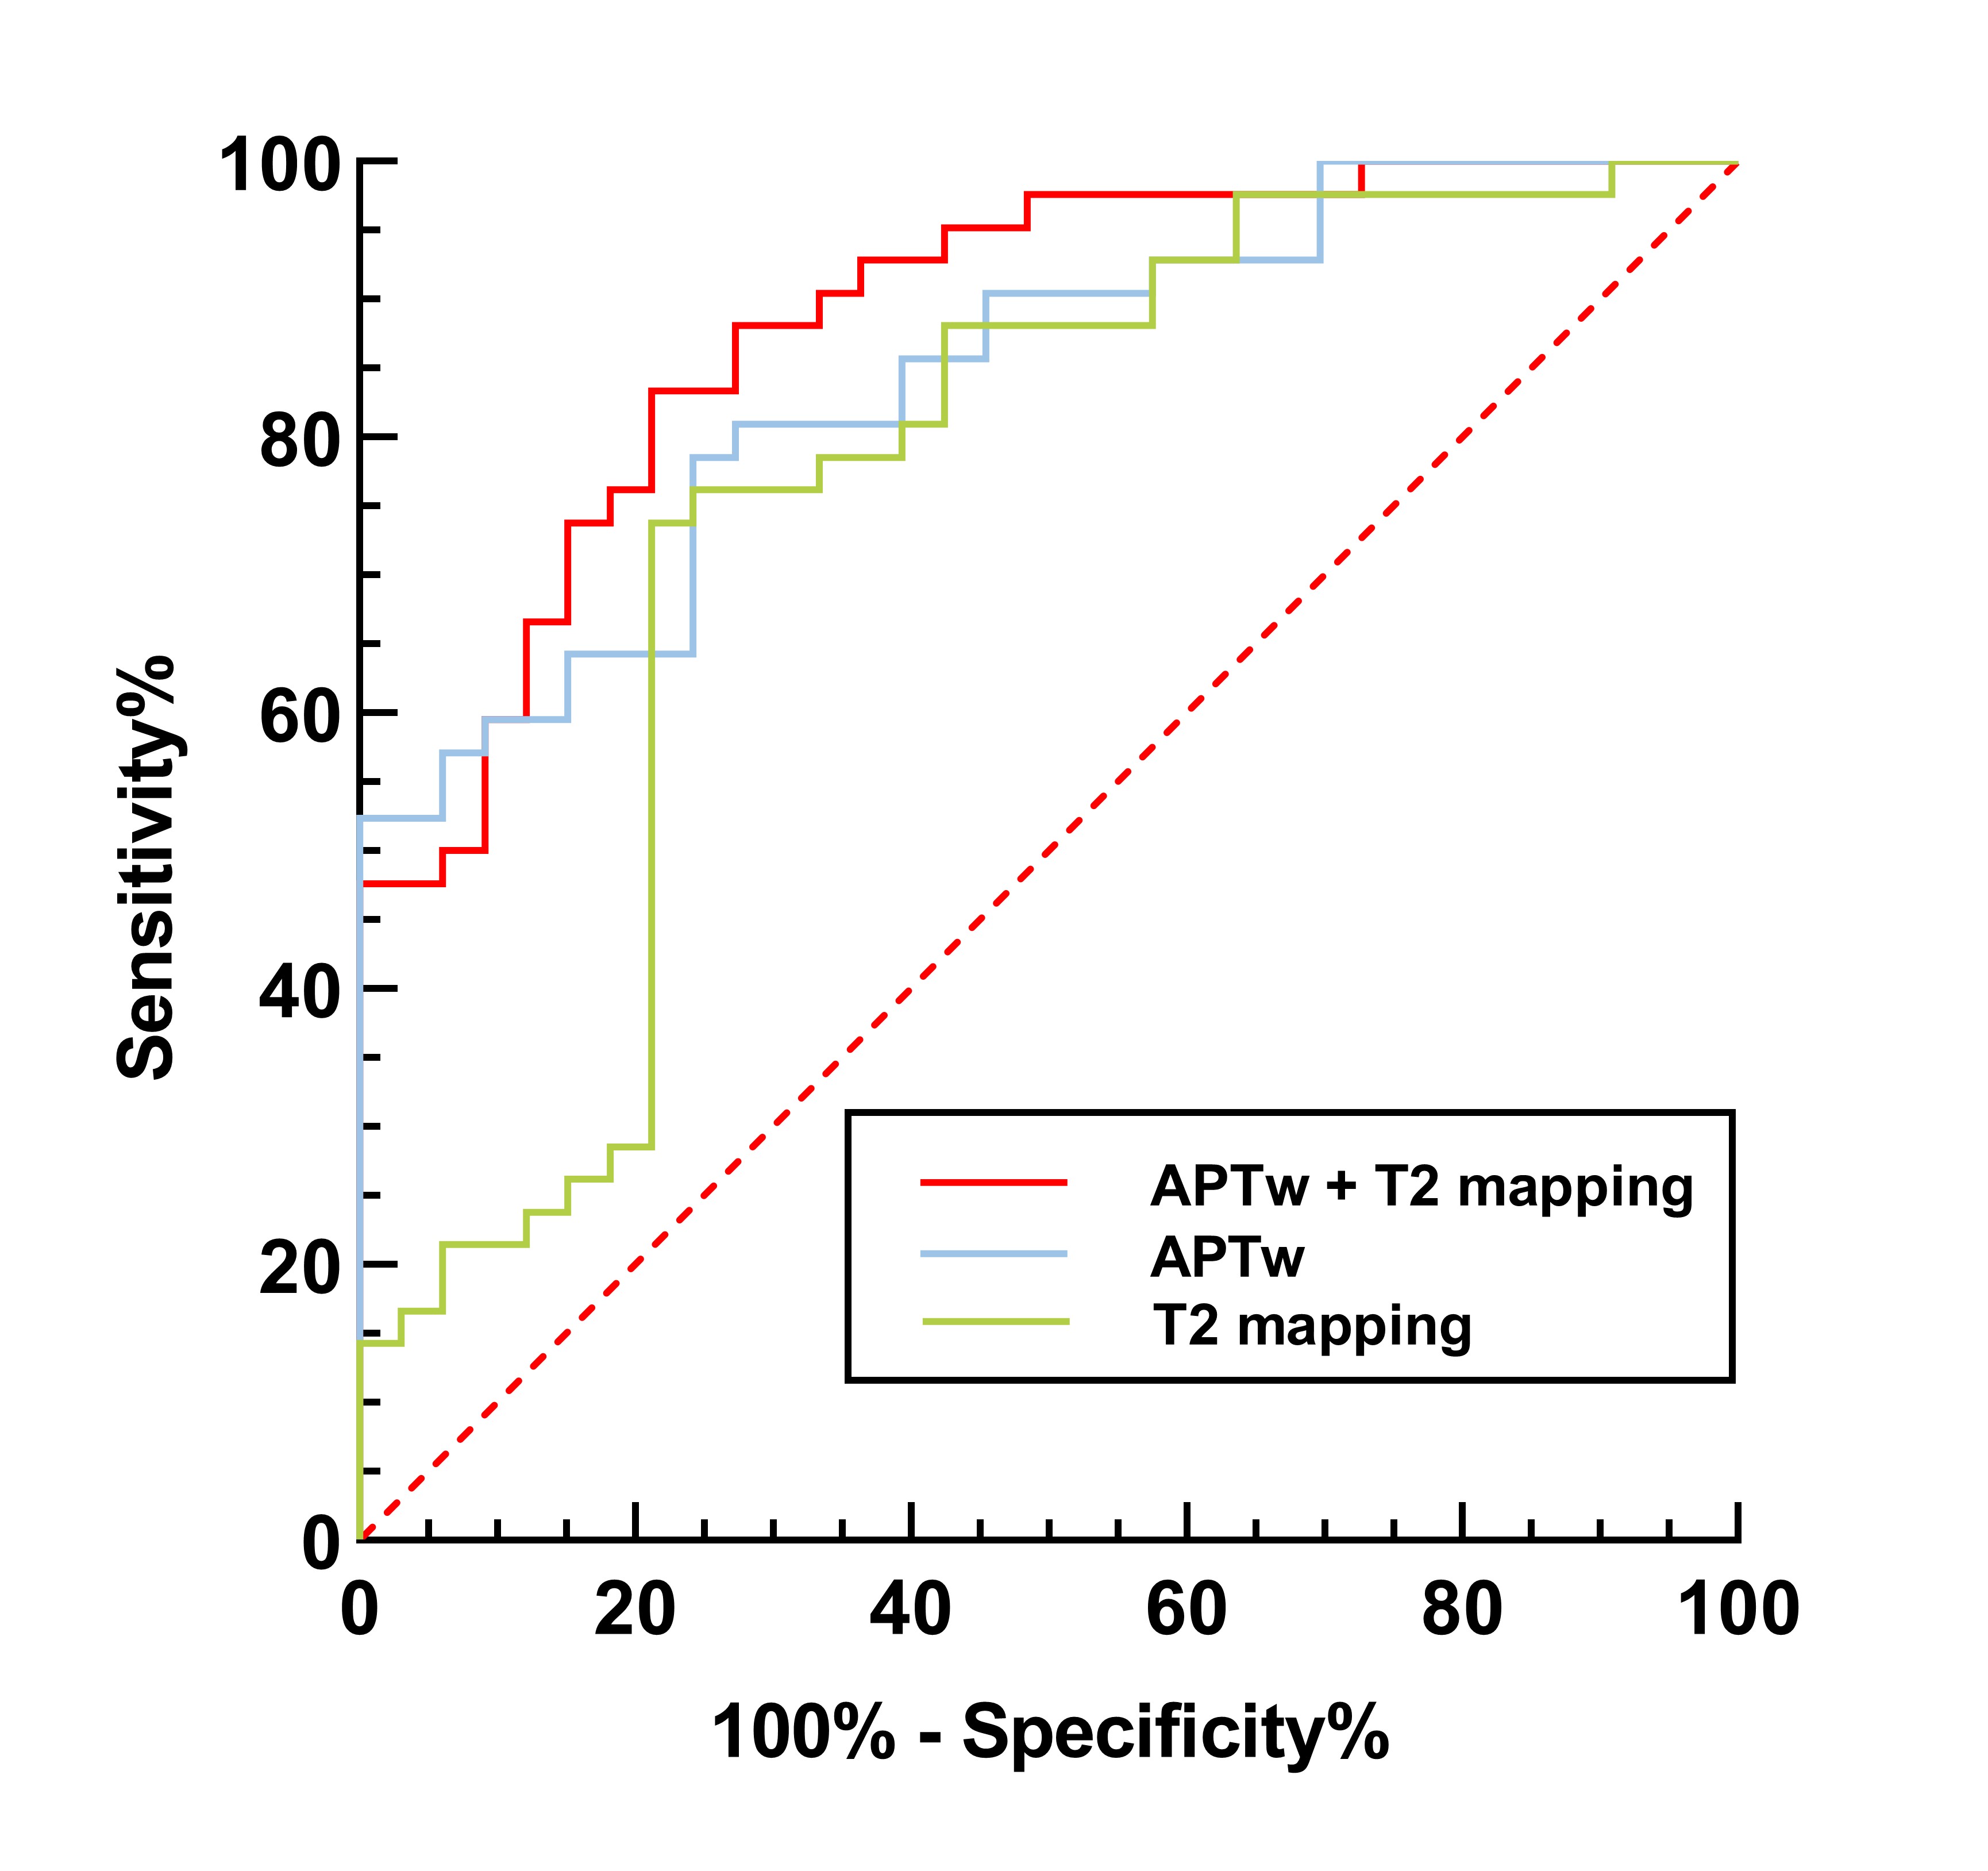
FIGURE 5: Receiver operating characteristic curves of each imaging parameter for discrimination between low- and non-low-risk EA. AUCs of APTw, T2 mapping, and APTw + T2 mapping were 0.843 (0.740 - 0.917), 0.757 (0.644 - 0.849), 0.882 (0.787 - 0.945), respectively.
APTw = amide proton transfer-weighted imaging; EA = endometrioid adenocarcinoma.