0209
Time-dependent Magnetic Resonance Imaging for Predicting Pathological Complete Response in Rectal Cancer with Neoadjuvant Therapy1Departments of Radiology, West China Hospital, Sichuan University, Guoxue Xiang No. 37, Chengdu, Sichuan, 610041, PR China, Chengdu, China, 2Colorectal Cancer Center, Department of General Surgery, West China Hospital, Sichuan University, Chengdu, 610041, People’s Republic of China, Chengdu, China, 3Department of Clinical, Philips Healthcare, China, Wuhan, China
Synopsis
Keywords: Pelvis, Diffusion/other diffusion imaging techniques, rectal cancer;neoadjuvant treatment;pathological complete response;oscillatory gradient spin echo
Motivation: Time-dependent (TD) magnetic resonance imaging (MRI), an emerging imaging modality, offers insights into cellular microstructures, but its relevance to rectal cancer's neoadjuvant treatment response remains unknown.
Goal(s): To determine the value of TD MRI-derived metrics for preoperatively predicting pathological complete response (pCR) in rectal cancer.
Approach: Univariate and multivariate logistic regression analyses were used to identify key predictors of pCR.
Results: Extracellular diffusivity independently predicted pCR, with a cutoff of 1.640 effectively distinguishing between pCR and non-pCR tumors.
Impact: Time-dependent magnetic resonance imaging emerges as a promising tool for detecting the pathological complete response in rectal cancer following neoadjuvant therapy, potentially facilitating the selection of patients who may benefit from a watch-and-wait approach.
Introduction
The global burden of rectal cancer remains substantial [1]. Locally advanced rectal cancer (LARC) usually requires neoadjuvant therapy (NAT) before radical resection. Patients who achieve pathological complete response (pCR) after NAT may be eligible for conservative management, known as the watch-and-wait strategy [2]. Therefore, it is crucial to identify pCR patients before surgery. Time-dependent diffusion (TD) magnetic resonance imaging (MRI), especially through the application of the oscillatory gradient spin echo (OGSE) diffusion method, has demonstrated distinctive advantages in characterizing microstructures [3,4]. Thus, the purpose of this study was to predict pCR in rectal cancer with neoadjuvant therapy using TD MRI-derived parameters.Methods
This prospective study adhered to the Declaration of Helsinki's ethical guidelines and obtained approval from our Institutional Review Board as well as informed written consent from all participants. All MRI scans were performed with a 3.0-T MRI scanner (Ingenia Elition, Philips Healthcare, the Netherlands), with the participant in the supine position and using an external phased-array body coil. The TD MRI requires the acquisition of diffusion MRI signals at varying diffusion times by using a combination of OGSE and pulsed gradient spin-echo sequence (PGSE). OGSE data were acquired at OGSE N2 (33 Hz, duration of diffusion gradient = 60.9 msec, two cycles, b = 0, 60, 120, 180 sec/mm2) and OGSE N1 (17 Hz, duration of diffusion gradient = 60.9 msec, one cycle, b = 0, 250, 500, 750 sec/mm2), and PGSE at diffusion duration and separation of 15.9 and 115.1 msec, respectively (b = 0, 300, 600, 900, 1200 sec/mm2). The following parameters were used for the above sequences: three diffusion directions; repetition time msec/echo time msec, 5000/140; field of view, 220×220 mm; in-plane resolution, 2.75×2.75 mm; number of slices, 6; and section thickness, 5 mm. Besides, high-resolution T2 images in sagittal, coronal, and oblique axes, as well as conventional diffusion weighted images (b = 1000 sec/mm2) in oblique axes, were collected. All MRI metrics were extracted from the whole tumor, using ITK-SNAP 4.0.2 and MATLAB R2022b software. As per the American Joint Committee on Cancer Staging Manual [5], pCR is defined as the absence of residual tumor cells, equivalent to pathological regression grade (pTRG) 0. On SPSS 22.0 and R software, differences in MRI parameters between pCR and non-pCR groups were compared using independent samples t-tests or Mann-Whitney U tests, predictive factors for pCR were assessed through univariate and multivariate analyses, and diagnostic performance metrics were evaluated, with significance set at P<0.05.Results
Between July 2022 and August 2023, 64 consecutive patients (43 men and 21 women; mean age 55.50 ± 11.21 years, range 27–81 years) with biopsy-proven rectal cancer were recruited. Differences of MRI Metrics Between pCR and non-pCR Groups were shown in Figure 1. Dex was significantly different between pCR and non-pCR groups (P=0.024, Figure 2-3), and between pTRG 0 and pTRG 2 or 3 tumors (P=0.008 and 0.029, respectively), while there was no significant difference between pTRG 0 and pTRG 1 tumors (P=0.580). Univariate and multivariate analysis demonstrated that only Dex was the predicting factor of pCR (P=0.034, Figure 4). The trend of the Dex values with different TRG grades is shown in Figure 4, and there was no significant difference in Dex values between pTRG 0 and pTRG 1 (P=0.709). Dex achieved the highest diagnostic performance, with an AUC of 0.708 in discriminating pCR from non-pCR (Figure 5).Discussion
In this study, TD MRI-based microstructural mapping and standard measurements of ADC were utilized for preoperative prediction of pCR in participants with LARC following NAT. Results from univariate and multivariate analyses indicated that only Dex was an independent predictor of pCR. Dex was significantly higher in the pCR group than that in non-pCR group. This may be due to the fact that NAT causes tumor cell necrosis and a decrease in cellular density, thereby leading to an increase in the diffusion coefficient of extracellular water molecules. Notably, the Dex values were slightly higher in pTRG 1 tumors than in pCR ones, although not statistically. This could be attribute to a greater degree of fibrosis in tumors achieving pCR. Given the small number of pCR participants in this study, our future research is going to further expand the sample size to validate these findings.Conclusion
TD MRI may serve as a vital non-invasive instrument for identifying appropriate candidates for non-surgical treatment approaches in patients with rectal cancer after neoadjuvant therapy.Acknowledgements
The authors would like to express their sincere appreciation to Xiaoyong Zhang and Zhigang Wu from the Department of Clinical at Philips Healthcare, China, for their invaluable assistance with the adjustment of MRI scanning parameters.References
[1] R.L. Siegel, K.D. Miller, H.E. Fuchs, A. Jemal, Cancer Statistics, 2021, CA Cancer J Clin 71(1) (2021) 7-33. https://doi.org/10. 3322/caac.21654
[2] Dossa F, Chesney TR, Acuna SA, Baxter NN. A watch-and-wait approach for locally advanced rectal cancer after a clinical complete response following neoadjuvant chemoradiation: a systematic review and meta-analysis. Lancet Gastroenterol Hepatol. 2017 Jul;2(7):501-513. doi: 10.1016/S2468-1253(17)30074-2IF: 35.7 Q1 . Epub 2017 May 4. PMID: 28479372IF: 35.7 Q1 .
[3] Wu, D., Jiang, K., Li, H., Zhang, Z., Ba, R., Zhang, Y., Hsu, Y. C., Sun, Y., & Zhang, Y. D. (2022). Time-Dependent Diffusion MRI for Quantitative Microstructural Mapping of Prostate ancer. Radiology, 303(3), 578–587. https://doi.org/10.1148/radiol.211180IF: 19.7 Q1 .
[4] Jiang X., Li H., Sean P. Devan., John C. Gore, Xu J. (2021). MR cell size imaging with temporal diffusion spectroscopy. Magnetic Resonance Imaging 77, 109–123. https://doi.org/10.1016/j.mri.2020.12.010IF: 2.5 Q3
[5] Edge SB, Compton CC. The American Joint Committee on Cancer: the 7th edition of the AJCC cancer staging manual and the future of TNM. Ann Surg Oncol. 2010 Jun;17(6):1471-4. doi: 10.1245/s10434-010-0985-4IF: 3.7 Q1
Figures
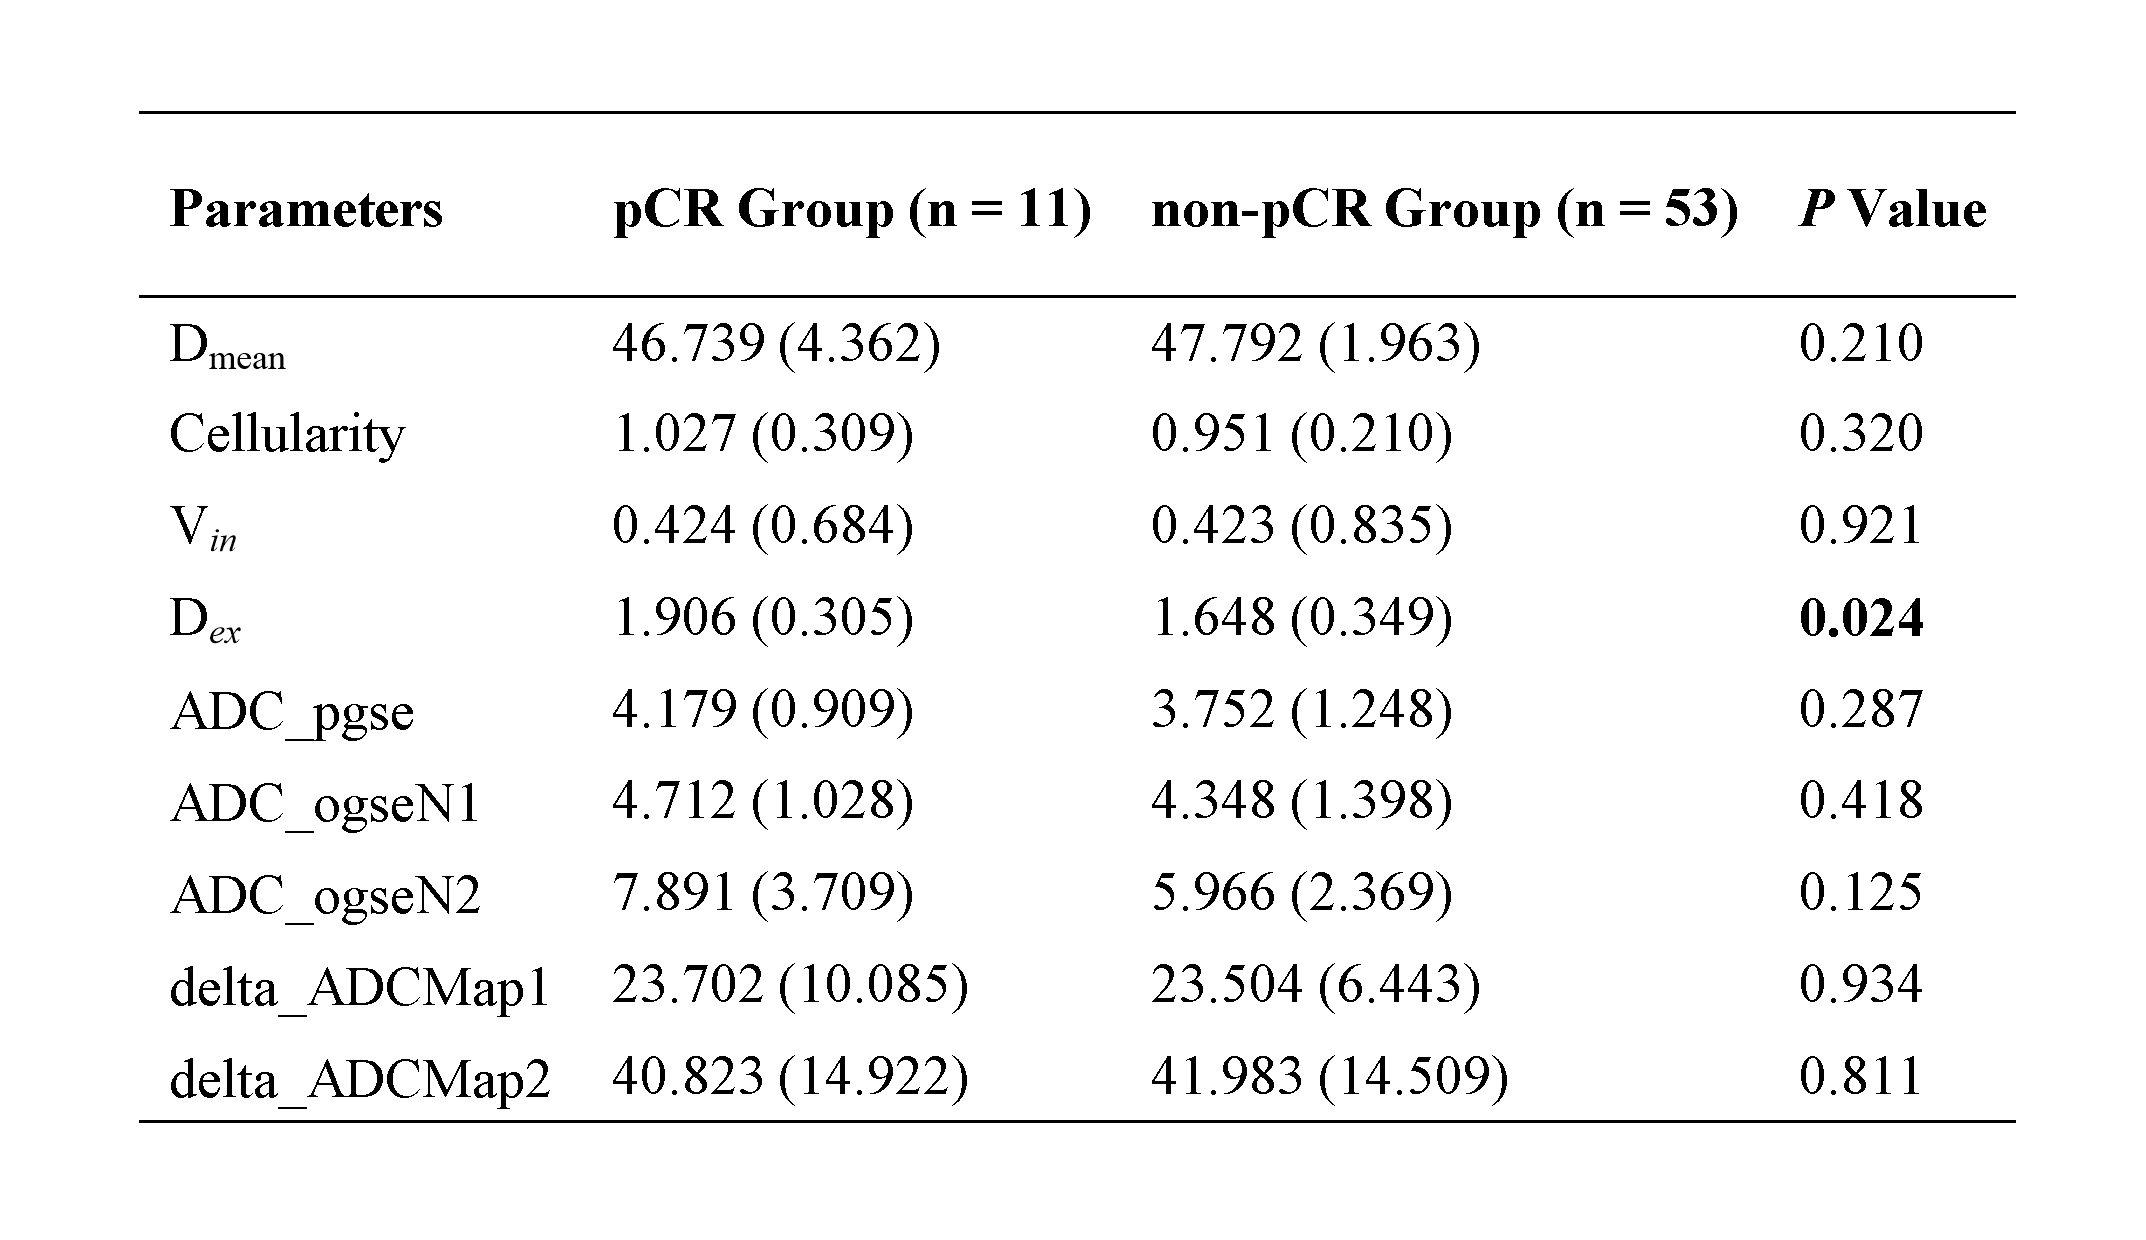
Fig. 1. Differences of MRI metrics between pCR and non-pCR groups
Notes: Data are mean values, with 95% confidence intervals in parentheses. ADC = apparent dispersion coefficient; Dex = extracellular diffusivity; Dmean = cell diameter; ogse = oscillating gradient spin-echo; pCR = pathological complete response; pgse = pulsed gradient spin-echo; Vin = intracellular volume fraction.
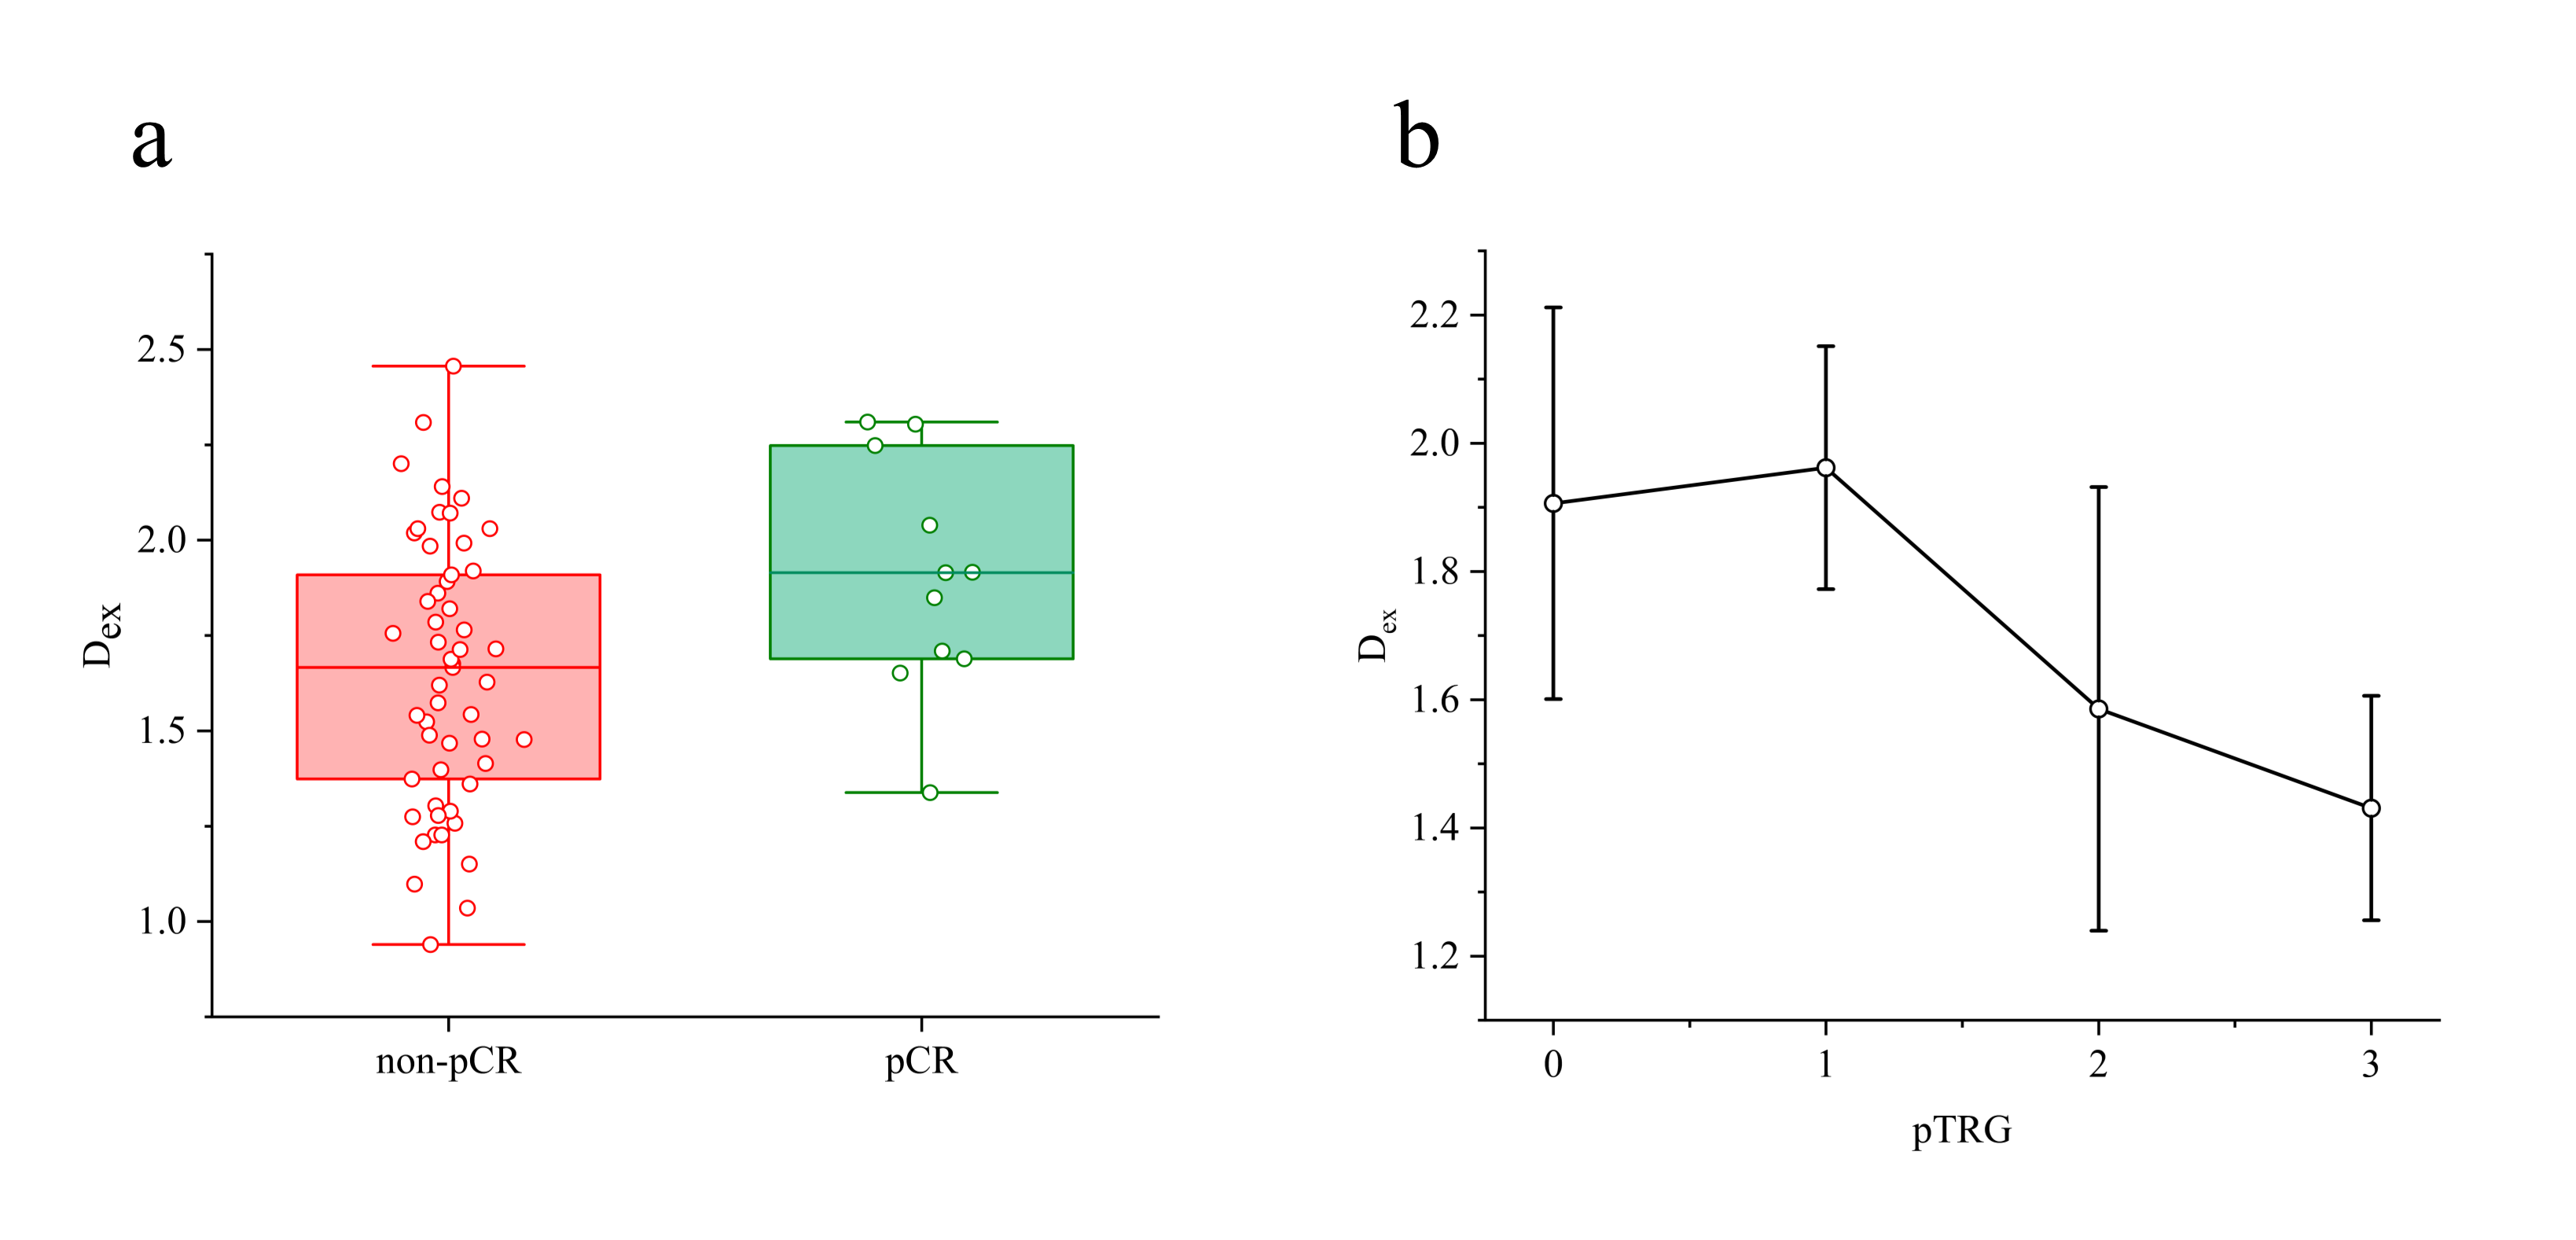
Fig. 2. Differences in Dex values between pCR and non-pCR groups (Fig. 2a) and among pTRG grades (Fig. 2b)
Notes: Dex = extracellular diffusivity; pCR = pathological complete response; pTRG = pathological regression grade.
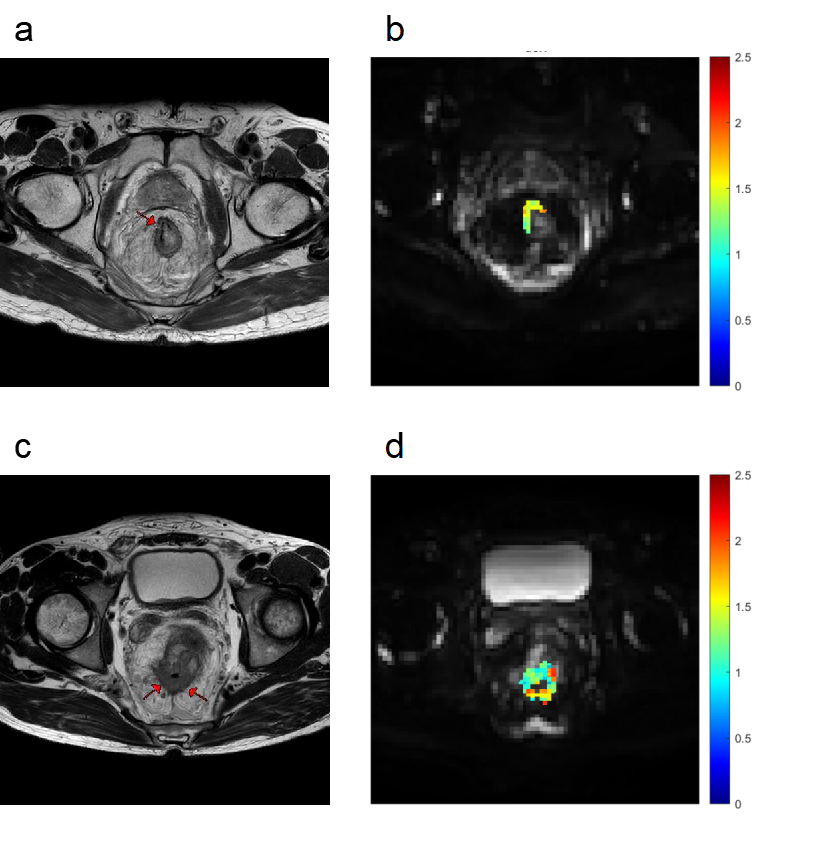
Fig. 3. The high-resolution axial T2-weighted image (a) displays the residual tumor bed with fibrosis in a 64-year-old male with pCR after neoadjuvant therapy, with Dex overlaid on the OGSE N0 image (b = 0 sec/mm2). The high-resolution axial T2-weighted image (c) displays the residual tumor in a 48-year-old male with non-pCR after neoadjuvant therapy, with Dex overlaid on the OGSE N0 image (b = 0 sec/mm2, d).
Notes: Dex = extracellular diffusivity; OGSE = oscillating gradient spin-echo; pCR = pathological complete response.
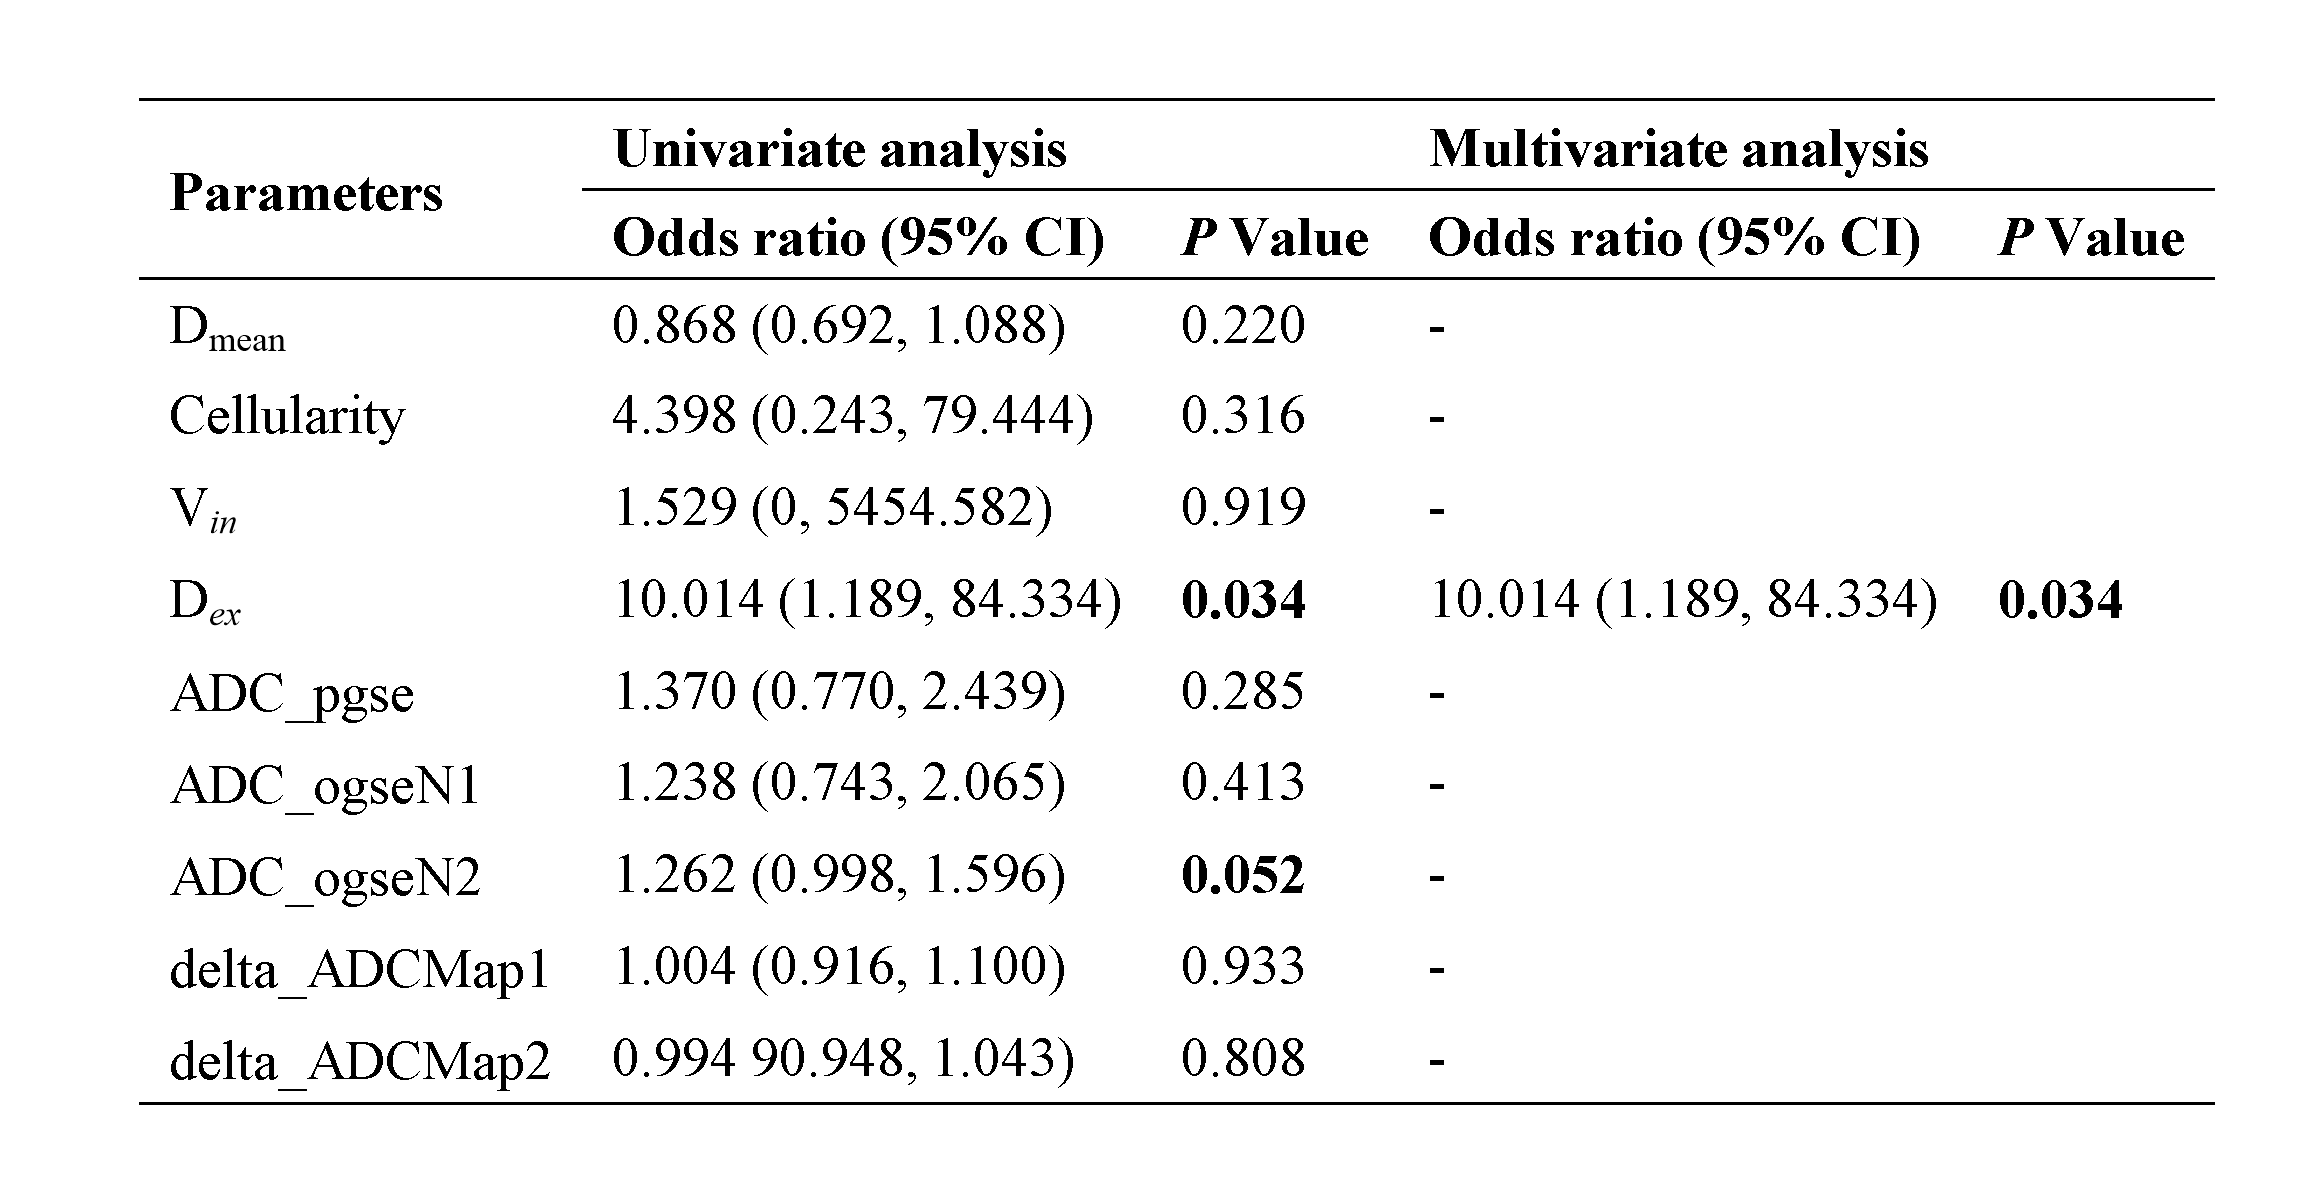
Fig. 4. Univariate and multivariate analysis of parameters predicting pCR
Notes: ADC = apparent dispersion coefficient; CI = confidence interval; Dex = extracellular diffusivity; Dmean = cell diameter; ogse = oscillating gradient spin-echo; pCR = pathological complete response; pgse = pulsed gradient spin-echo; Vin = intracellular volume fraction.
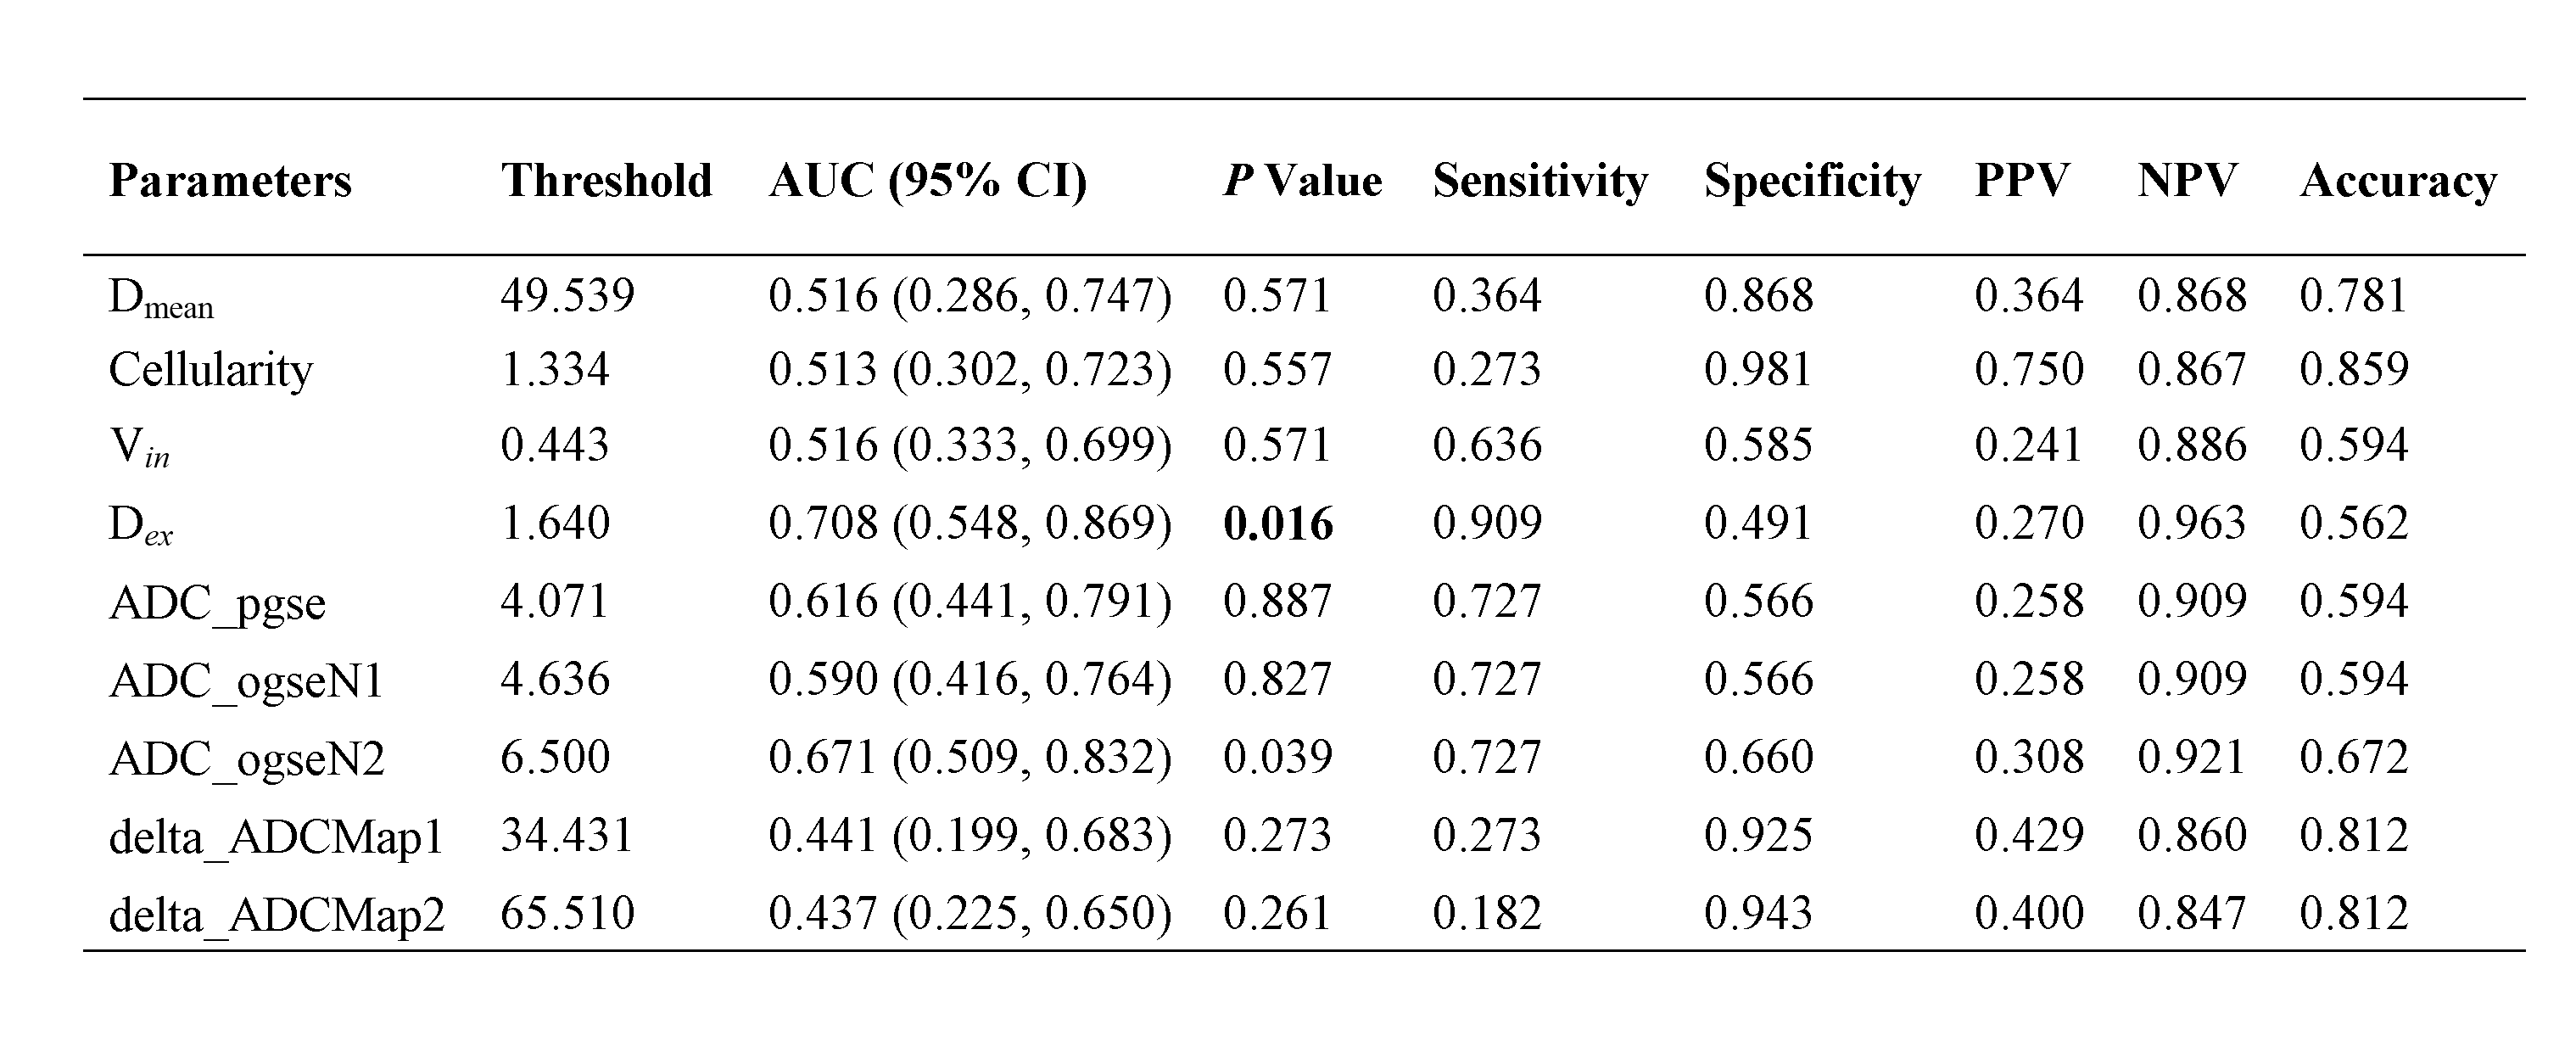
Fig. 5. Performance of parameters in predicting pCR
Notes: ADC = apparent dispersion coefficient; AUC = area under the curve; CI = confidence interval; Dex = extracellular diffusivity; Dmean = cell diameter; NPV = negative predictive value; ogse = oscillating gradient spin-echo; pCR = pathological complete response; pgse = pulsed gradient spin-echo; PPV = positive predictive value; Vin = intracellular volume fraction.