0208
Predictive value of mono-exponential and mathematical models in rectal cancer responsiveness to neoadjuvant chemoradiotherapy1Department of Radiology, Sichuan Provincial People's Hospital, University of Electronic Science and Technology of China, Chengdu, China, 2MR Research Collaboration, Siemens Healthineers, Chengdu, China, 3MRI clinical application, Customer Service Department, Siemens Digital Medical Technology Co., LTD, Shanghai, China
Synopsis
Keywords: Treatment Response, Treatment
Motivation: Although it is challenging to predict LARC responsiveness to nCRT, the potential of emerging non-Gaussian DWI models for this purpose remains unexplored.
Goal(s): To assess the efficacies of mono-exponential ADC and various non-Gaussian DWI models, including SEM, FROC, and CTRW, in predicting LARC responsiveness to nCRT.
Approach: This prospective study included 103 LARC patients. Various DWI models were assessed, and post-surgery histopathology was utilized to classify patients based on responsiveness to nCRT.
Results: Non-Gaussian models, especially CTRW parameters, demonstrated robust capacity to predict both pCR and T-downstaging. The combination of CTRW parameters yielded the best diagnostic performance.
Impact: This study demonstrated the potential for novel non-Gaussian DWI models to enhance predictions of LARC responsiveness to nCRT, facilitating optimized treatment plans and encouraging further research in precision oncology.
Introduction
Colorectal cancer is the third most common cancer worldwide1. Approximately 50% of patients present with locally advanced rectal cancer (LARC). Standard treatment for LARC primarily involves neoadjuvant chemoradiotherapy (nCRT) to shrink the tumor, reducing recurrence rates and enhancing quality of life2. However, nCRT responses can vary among patients: some are resistant to treatment, whereas 10%-30% achieve a pathological complete response (pCR). The achievement of pCR can sometimes eliminate the need for surgery and avoid severe surgical complications. However, current methods for identifying such patients remain inefficient. The accurate prediction of nCRT responsiveness can facilitate individualized treatment plans. Recent innovations include non-Gaussian diffusion-weighted imaging (DWI) models such as fractional-order calculus (FROC)3, stretched exponential model (SEM)4, and continuous-time random-walk (CTRW) 5, which show potential for assessing tumor heterogeneity in various organs. To our knowledge, no studies have evaluated the value of mono-exponential apparent diffusion coefficient (ADC), SEM, FROC, and CTRW models in predicting LARC responsiveness to nCRT. Therefore, this study was performed to evaluate the abilities of these models to predict LARC responsiveness to nCRT.Methods
MR imaging: This prospective study included 103 LARC patients scheduled for preoperative chemoradiotherapy. Magnetic resonance imaging (MRI) was conducted using a 3T MRI system (MAGNETOM Vida, Siemens Healthineers, Erlangen, Germany). Axial DWI was performed using a spectral attenuated inversion-recovery fat-suppressed, two-dimensional single-shot spin-echo planar imaging sequence with 11 b-values (0, 50, 100, 200, 500, 800, 1000, 1500, 2000, 2300, and 2600 s/mm2) and the following parameters: repetition time/echo time=3100/99 ms, field of view=226×226 mm2, matrix size=110×110, slice thickness=2 mm, and GRAPPA factor=2. The acquisition required approximately 6 min 21 s.Reconstruction & Segmentation: The ADC, SEM, CTRW, and FROC models were reconstructed using in-house postprocessing software (NeuDiLab) based on the open-resource tool DIPY (Diffusion Imaging in Python, https://dipy.org). For each tumor, freehand region-of-interest measurements were performed on the largest three largest tumor slices using MRIcron software (https://www.nitrc.org/projects/mricron). The parameters included ADC from the mono-exponential model; the distributed diffusion coefficient (SEM_DDC) and intravoxel heterogeneity index (SEM_α) from the SEM model; the diffusion coefficient (FROC_D), fractional order derivative in space (FROC_β), and spatial constant (FROC_µ) from the FROC model; and the anomalous diffusion coefficient (CTRW_D), temporal diffusion heterogeneity (CTRW_α), and spatial diffusion heterogeneity (CTRW_β) from the CTRW_model. Post-surgery histopathology evaluations were performed within 1 week by two blinded histopathologists.
Statistical Analysis: The histologic tumor regression grade (TRG) was assessed using the National Comprehensive Cancer Network and American Joint Committee on Cancer TRG system. Specimens without residual cancer cells were considered pCR. Patients were classified in the pCR group (TRG0) or non-pCR group (TRG1-3). The post-CRT pathological T stage (ypT) was determined based on the 7th edition of the American Joint Committee on Cancer (AJCC, 2010) tumor-nodal-metastasis (TNM) staging system. Patients were divided into the T-downstage group (ypT0-1) and non-T-downstage group (ypT2-4). The Mann-Whitney U test was used to identify associations of parameters with T-downstage status. Receiver operating characteristic analysis was used to predict pCR and T-downstage statuses.
Results
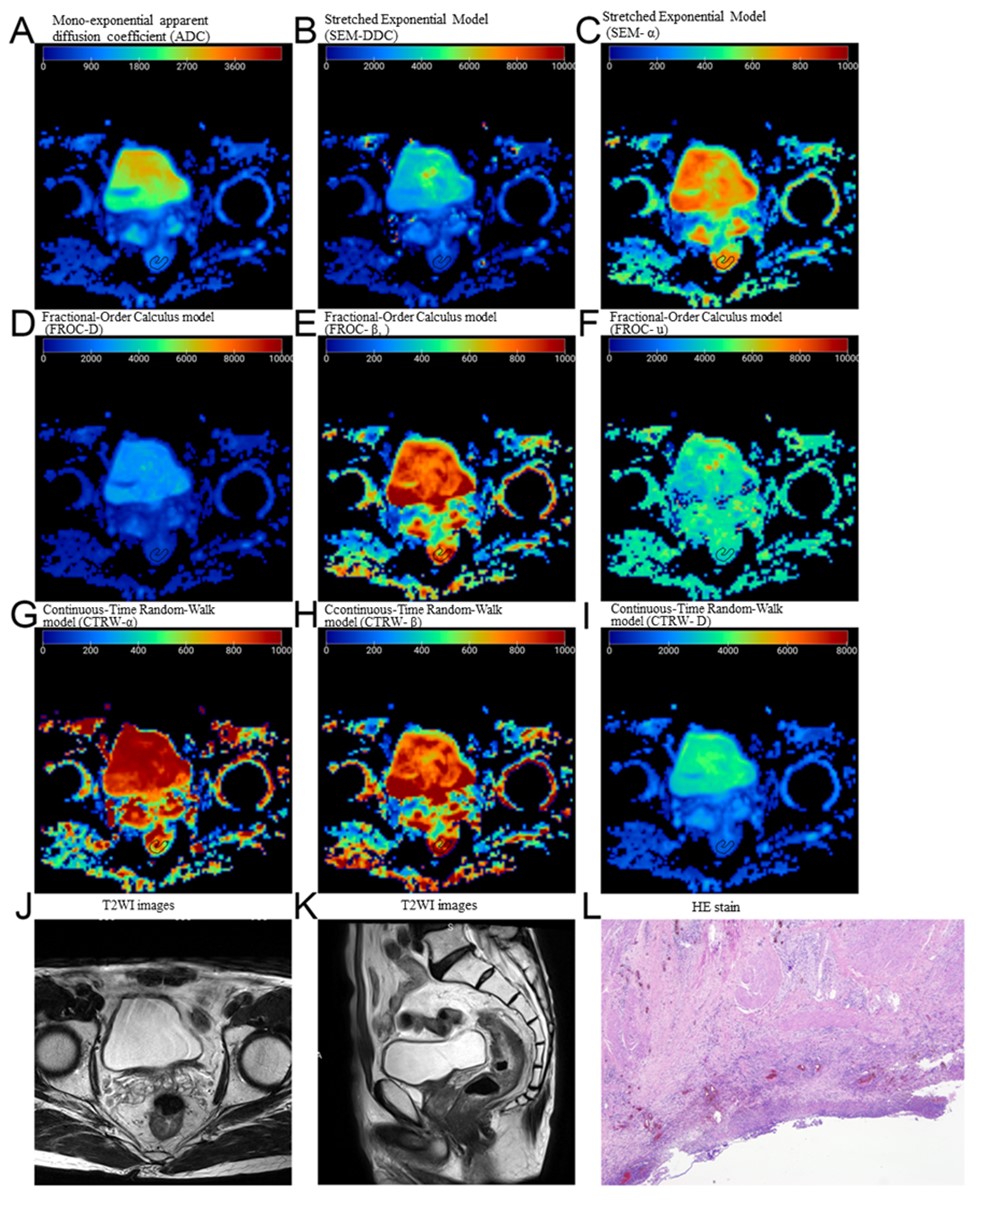
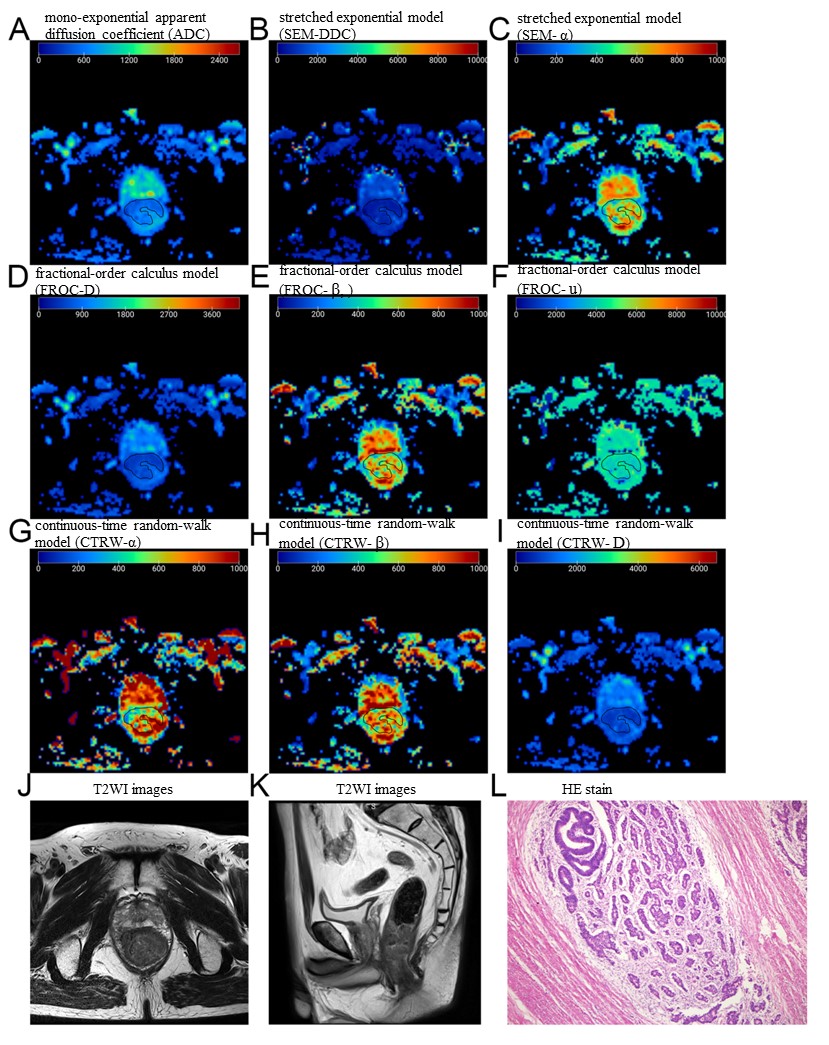
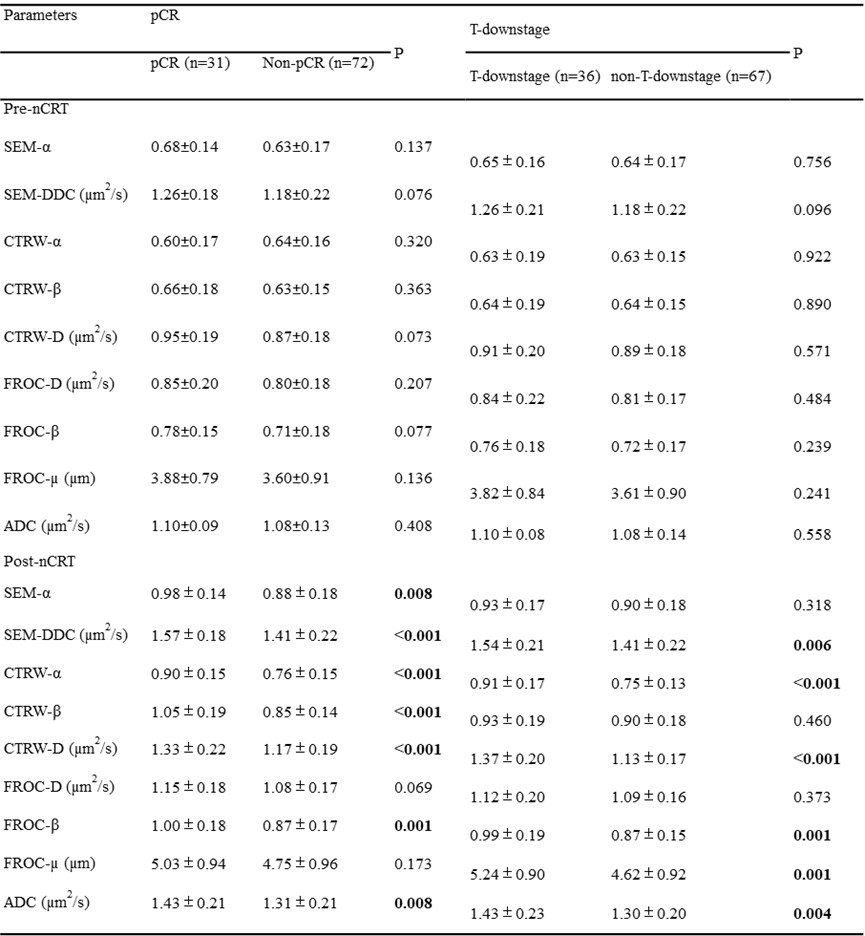
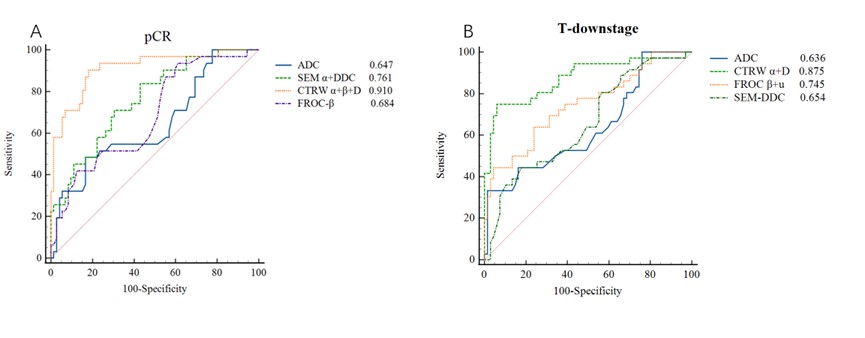
Among the 103 patients, the pCR rate was 30.1% (31/103) (typical pCR and non-pCR representations are shown in Figures 1 and 2), and the T-downstage rate was 35.0% (36/103). The SEM-α, SEM-DDC, CTRW-α, CTRW-β, CTRW-D, FROC-β, and ADC values were significantly higher in the pCR group than in the non-pCR group (all P<0.05). The SEM-DDC, CTRW-α, CTRW-D, FROC-β, FROC-µ, and ADC values were significantly higher in the T-downstage group (ypT0-1) than in the non-T-downstage group (ypT2-4) (P<0.05)(Table 1). Moreover, in terms of predicting pCR after nCRT, the combination of CTRW (α+β+D) yielded the best diagnostic performance among those parameters (area under the curve [AUC]=0.910, P<0.001)(Figure 3). In terms of predicting T-downstage after nCRT, the combination of CTRW (α+D) yielded the best diagnostic performance (AUC=0.875, P=0.048).Discussion
Our findings demonstrated the importance of non-Gaussian models in evaluating responsiveness to nCRT. Although the capacity of ADC to differentiate between pCR and non-pCR has been recognized6, our findings indicate that SEM and FROC are superior to ADC for distinguishing between pCR and non-pCR groups, and between T-downstage and non-T-downstage groups. Intriguingly, the combination of CTRW parameters (α, β, and D) displayed superior diagnostic performance in predicting both pCR and T-downstage after nCRT. This finding supported the viewpoint that a composite model (involving multiple imaging parameters) can provide more accurate and robust predictions, compared with reliance on individual markers.Conclusions
The results suggest that the CTRW-derived imaging markers α, β, and D hold promise in predicting LARC responsiveness to nCRT.Acknowledgements
No acknowledgement found.References
1. Siegel RL, Miller KD, Wagle NS, et al. Cancer statistics. CA Cancer J Clin. 2023;73(1):17-48.
2. Bigness A, Imanirad I, Sahin IH, et al. Locally advanced rectal adenocarcinoma: Treatment sequences, intensification, and rectal organ preservation. CA Cancer J Clin. 2021;71(3):198-208.
3. Magin RL, Hall MG, Karaman MM, el al. Fractional Calculus Models of Magnetic Resonance Phenomena: Relaxation and Diffusion. Crit Rev Biomed Eng. 2020;48(5):285-326.
4. Chen X, Jiang J, Shen N, et al. Stretched-exponential model diffusion-weighted imaging as a potential imaging marker in preoperative grading and assessment of proliferative activity of gliomas. Am J Transl Res. 2018;10(8):2659-68.
5. Guo H, Liu J, Hu J, et al. Diagnostic performance of gliomas grading and IDH status decoding A comparison between 3D amide proton transfer APT and four diffusion-weighted MRI models. J Magn Reson Imaging. 2022;56(6):1834-44.
6. Lambregts DMJ, Delli Pizzi A, Lahaye MJ, et al. A Pattern-Based Approach Combining Tumor Morphology on MRI With Distinct Signal Patterns on Diffusion-Weighted Imaging to Assess Response of Rectal Tumors After Chemoradiotherapy. Dis Colon Rectum. 2018;61(3):328-37.
Figures