0204
Multiparametric MRI-based radiomics fusion combined with quantitative stratified ADC-defined tumor habitats for TNBC identification1Department of Radiology, The Second Affiliated Hospital, School of Medicine, South China University of Technology, Guangzhou, China, 2Department of Radiology, Guangzhou First People's Hospital, Guangzhou, China, 3Philips Healthcare, Guangzhou, China, 4School of Biomedical Engineering, Southern Medical University, Guangzhou, China
Synopsis
Keywords: Breast, Cancer, Breast cancer, MRI, Triple-negative breast cancer, Tumor habitat
Motivation: Investigated the role of quantitative stratified apparent diffusion coefficient (ADC)-defined tumor habitats in differentiating triple-negative breast cancer (TNBC) from non-TNBC using a multiparametric MRI (mpMRI)-based feature fusion radiomics (RFF) approach.
Goal(s): To develop an RFF-StratifiedADC model using an RFF strategy and reveal distinct ADC map–based tumor habitats for distinguishing TNBC.
Approach: RFF (predominant MRI sequence–based fused features), RADC (ADC radiomics features), StratifiedADC (stratified ADC–defined tumor habitat parameters), and combined RFF-StratifiedADC models were constructed to identify TNBC.
Results: Stratified ADC parameters helped evaluate the underlying biological proliferation and cellularity within tumor habitats. The integrated RFF-StratifiedADC model was effective and reliable for TNBC identification.
Impact: Stratified ADC–defined tumor habitat parameters derived from whole-tumor ADC maps, along with fused radiomics features from dominant mpMRI sequences (T2WI, DWI, ADC maps, and DCE2), can serve as potential biomarkers for differentiating TNBC from non-TNBC.
Introduction
Quantitative ADC maps can assist in preoperatively distinguishing TNBC using cutoffs (min, mean, or max ADC)1,2. Nevertheless, these may not reflect the tumor's full heterogeneity. Cancers are recognized as a collection of habitats, each with distinct environmental selection forces and cellular evolution strategies3. Spatially explicit habitats of cancers are readily apparent in images, with changes in tumor cell density and necrosis. Thus, we envisioned that the histogram-derived, voxel-based, stratified quantitative ADC could be used to reveal various image-defined tumor habitats [e.g., proliferative tumor core (PTC, the most restricted and cellular components of the tumor), or necrosis/cyst subregion] in TNBC versus non-TNBC characterization. Leveraging mpMRI-based radiomics, which shows promise in subtype identification4-7, Therefore, using a newly lab-developed mMRI-based feature fusion radiomics (RFF) model8, we aimed to assess how ADC-stratified habitats enhance TNBC discrimination.Methods
Data collectionWe retrospectively studied 466 patients with breast cancer (54 TNBC, 412 non-TNBC) scanned using a 1.5T MRI (uMR 560, United Imaging) from January 2017 to April 2022 at Guangzhou First People’s Hospital. Imaging included T1WI, T2WI, DWI (b = 0, 600 s/mm²), and six DCE-MRI phases (62 seconds for each phase). ADC maps were generated automatically. Patients were allocated to training (n = 337) and test (n = 129) sets at a 3:1 ratio.
Tumor segmentation and radiomics feature selection
Lesions’ volume of interests (VOIs) were outlined on T2WI, DWI600, ADC, and DCE2 (the second phase of DCE-MRI) images. Utilizing Pyradiomics9, we extracted 109 features from each VOI. These features were fed into 150 models respectively using 10 classifiers and 15 feature selection methods to screen the best model.
Model development and evaluation
The following 4 models were developed (Fig. 1):
(i) RADC: Radiomics features from whole-tumor ADC maps.
(ii) StratifiedADC: Thirteen ADC histogram parameters, indicating various tumor habitats including PTC, chaotic, and necrosis/cysts areas, were derived from whole-tumor ADC histograms, which were summarized in Table 1.
(iii) RFF: Fusing radiomics features from T2WI, DWI, ADC, and DCE2.
(iv) RFF-StratifiedADC: Merged the selected RFF and StratifiedADC features.
Models’ performance was assessed and compared using AUC, sensitivity, specificity, accuracy, and the paired-sample Wilcoxon signed-rank test.
Results
The RFF model, developed from a strategic amalgamation of MRI sequences (ADC map, DWI600, T2WI, and DCE2, as shown in Fig. 2), demonstrated robust performance in distinguishing TNBC from non-TNBC, yielding AUCs of 0.818 and 0.773 in the training and test cohorts, respectively. Simultaneously, by quantifying distinct tumor habitats—such as necrosis/cysts, chaotic regions, and the proliferative tumor core, the StratifiedADC model revealed marked disparities between TNBC and non-TNBC cases with its top 3 discriminative parameters (P <.05, Fig. 3). The fusion of these models into the RFF-StratifiedADC model catapulted its efficacy to new heights. This amalgamated model, by integrating quintessential features from both the RFF and StratifiedADC models, achieved higher AUCs of 0.832 and 0.784 in the training and test sets, respectively, outshining its component models (P <.05) (Table 2).Discussion
Various physiologies and cytotypes have been observed within a tumor in spatially distinct habitats10-12. Our results indicated that the top 3 parameters in the StratifiedADC model were ADC post higher 25% mean, ADC lower 75% mean, and ADC lower 25% mean, which represented the necrosis/cyst habitat, chaotic habitat (encompassing most tumor cells and a low proportion of necrosis/cyst regions), and PTC (the most cellular and restricted components of the tumor), respectively. The StratifiedADC model revealed distinct tumor habitats and their unique microenvironment that might provide minable characteristics. Additionally, we discovered that the features of the RFF model fused with 4 sequences outperformed the RADC model (P <.05) based on a hypothesis that managing MRI sequences collaboratively would provide multidimensional image information by incorporating class structure information8. Notably, integrating the StratifiedADC with RFF model, the new RFF-StratifiedADC model outperformed any other models for TNBC identification. This combined model’s success heralded a promising direction for the application of integrated radiomic strategies, potentially revolutionizing the approach to TNBC identification. By fusing the spatially resolved ADC parameters with a rich set of radiomic features, the RFF-StratifiedADC model offered a nuanced, more detailed portrayal of tumor biology, which could inform tailored treatment options, aiming to elevate patient care to a level of unprecedented personalization.Conclusion
The RFF-StratifiedADC model was highly promising in identifying TNBC by integrating tumor habitat information from the whole-tumor ADC map–based StratifiedADC model and radiomics features from the mpMRI-based RFF model.Acknowledgements
No acknowledgements found.References
1. Horvat JV, Bernard‐Davila B, Helbich TH, et al (2019) Diffusion‐weighted imaging (DWI) with apparent diffusion coefficient (ADC) mapping as a quantitative imaging biomarker for prediction of immunohistochemical receptor status, proliferation rate, and molecular subtypes of breast cancer. J Magn Reson Imaging 50:836–846. https://doi.org/10.1002/jmri.26697
2. Xie T, Zhao Q, Fu C, et al (2019) Differentiation of triple-negative breast cancer from other subtypes through whole-tumor histogram analysis on multiparametric MR imaging. Eur Radiol 29:2535–2544. https://doi.org/10.1007/s00330-018-5804-5
3. Gatenby RA, Grove O, Gillies RJ (2013) Quantitative Imaging in Cancer Evolution and Ecology. Radiology 269:8–14. https://doi.org/10.1148/radiol.13122697
4. Qin Y, Tang C, Hu Q, et al (2022) Assessment of Prognostic Factors and Molecular Subtypes of Breast Cancer With a Continuous‐Time Random‐Walk MR Diffusion Model: Using Whole Tumor Histogram Analysis. Magnetic Resonance Imaging jmri.28474. https://doi.org/10.1002/jmri.28474
5. Conti A, Duggento A, Indovina I, et al (2021) Radiomics in breast cancer classification and prediction. Seminars in Cancer Biology 72:238–250. https://doi.org/10.1016/j.semcancer.2020.04.002
6. Lee JY, Lee K, Seo BK, et al (2022) Radiomic machine learning for predicting prognostic biomarkers and molecular subtypes of breast cancer using tumor heterogeneity and angiogenesis properties on MRI. Eur Radiol 32:650–660. https://doi.org/10.1007/s00330-021-08146-8
7. Zhang Y, Chen J-H, Lin Y, et al (2021) Prediction of breast cancer molecular subtypes on DCE-MRI using convolutional neural network with transfer learning between two centers. Eur Radiol 31:2559–2567. https://doi.org/10.1007/s00330-020-07274-x
8. Wu J, Liang F, Wei R, et al (2021) A Multiparametric MR-Based RadioFusionOmics Model with Robust Capabilities of Differentiating Glioblastoma Multiforme from Solitary Brain Metastasis. Cancers 13:5793. https://doi.org/10.3390/cancers13225793
9. Haghighat M, Abdel-Mottaleb M, Alhalabi W (2016) Discriminant Correlation Analysis: Real-Time Feature Level Fusion for Multimodal Biometric Recognition. IEEE TransInformForensic Secur 11:1984–1996. https://doi.org/10.1109/TIFS.2016.2569061
10. Gillies RJ, Brown JS, Anderson ARA, Gatenby RA (2018) Eco-evolutionary causes and consequences of temporal changes in intratumoural blood flow. Nat Rev Cancer 18:576–585. https://doi.org/10.1038/s41568-018-0030-7
11. Lloyd MC, Cunningham JJ, Bui MM, et al (2016) Darwinian Dynamics of Intratumoral Heterogeneity: Not Solely Random Mutations but Also Variable Environmental Selection Forces. Cancer Research 76:3136–3144. https://doi.org/10.1158/0008-5472.CAN-15-2962
12. Jardim-Perassi BV, Huang S, Dominguez-Viqueira W, et al (2019) Multiparametric MRI and Coregistered Histology Identify Tumor Habitats in Breast Cancer Mouse Models. Cancer Research 79:3952–3964. https://doi.org/10.1158/0008-5472.CAN-19-0213
Figures
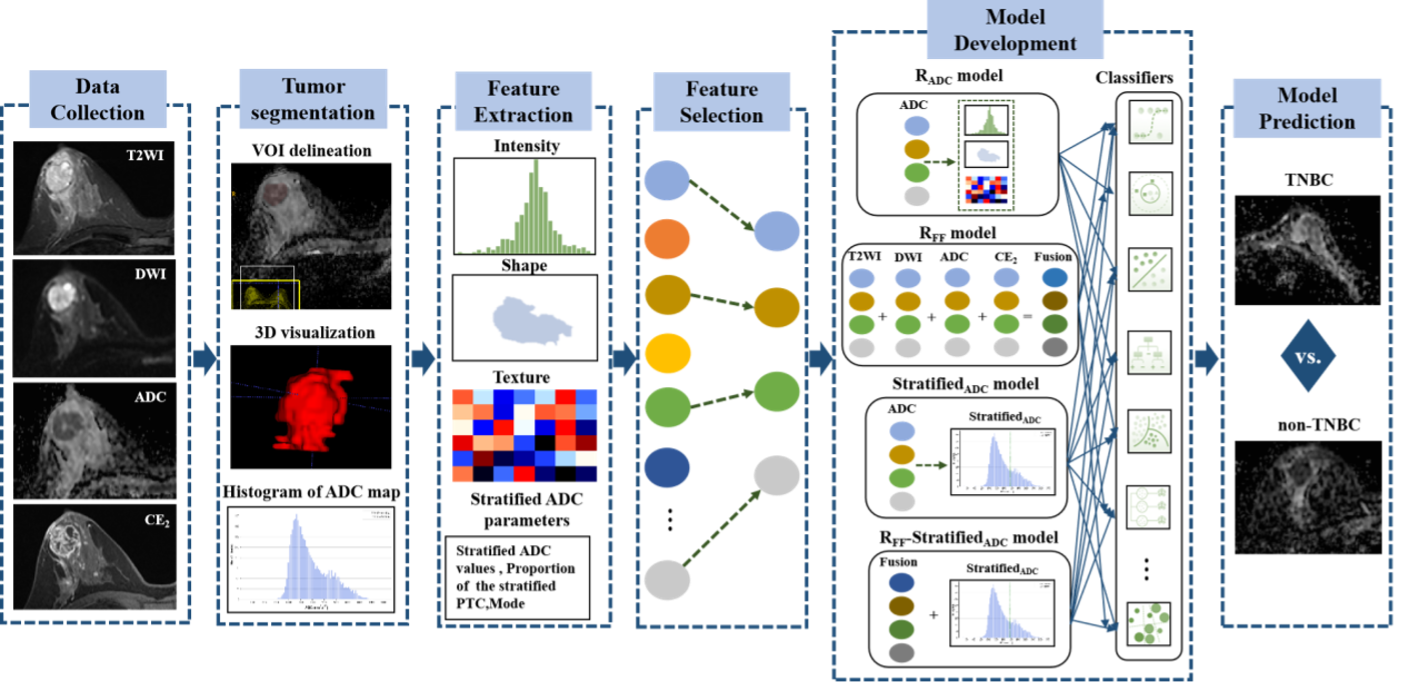
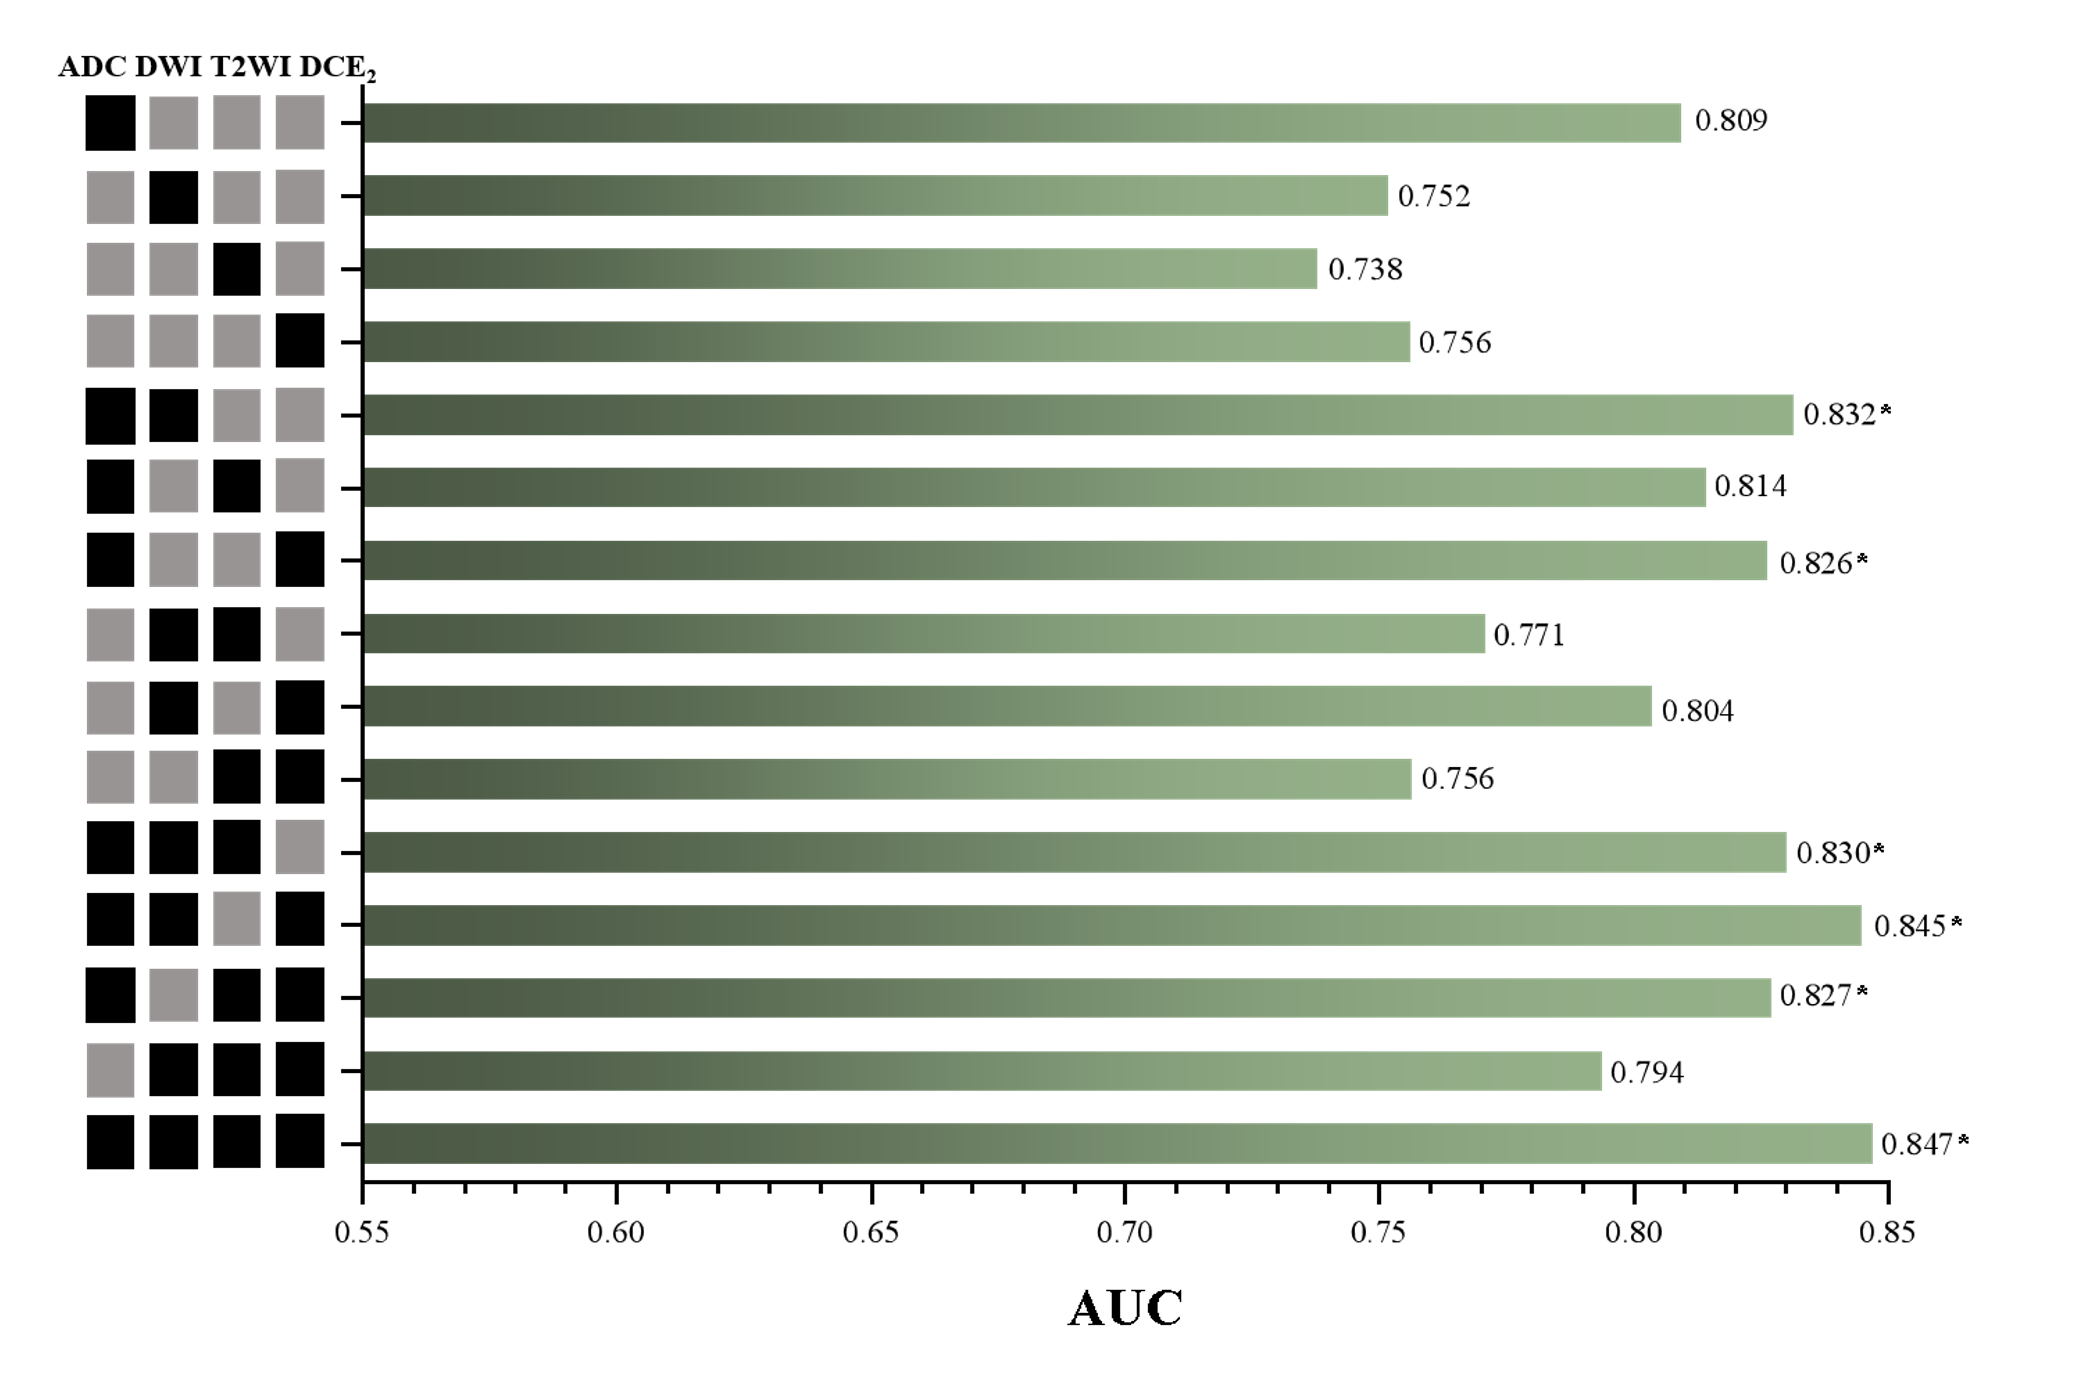
Figure 2. Performance comparisons in terms of maximal AUC of the 150 classification models on each single mpMRI sequence and their combinations to distinguish TNBC from non-TNBC. AUC, the area under the receiver-operating characteristic curve. DCE2, the second phase of dynamic contrast-enhanced MRI, super-early-contrast phase. TNBC, Triple-negative breast cancer.
* Comparison of maximum AUC between combinations inclusive of ADC and a single ADC sequence, with remarkable differences (P <.05).
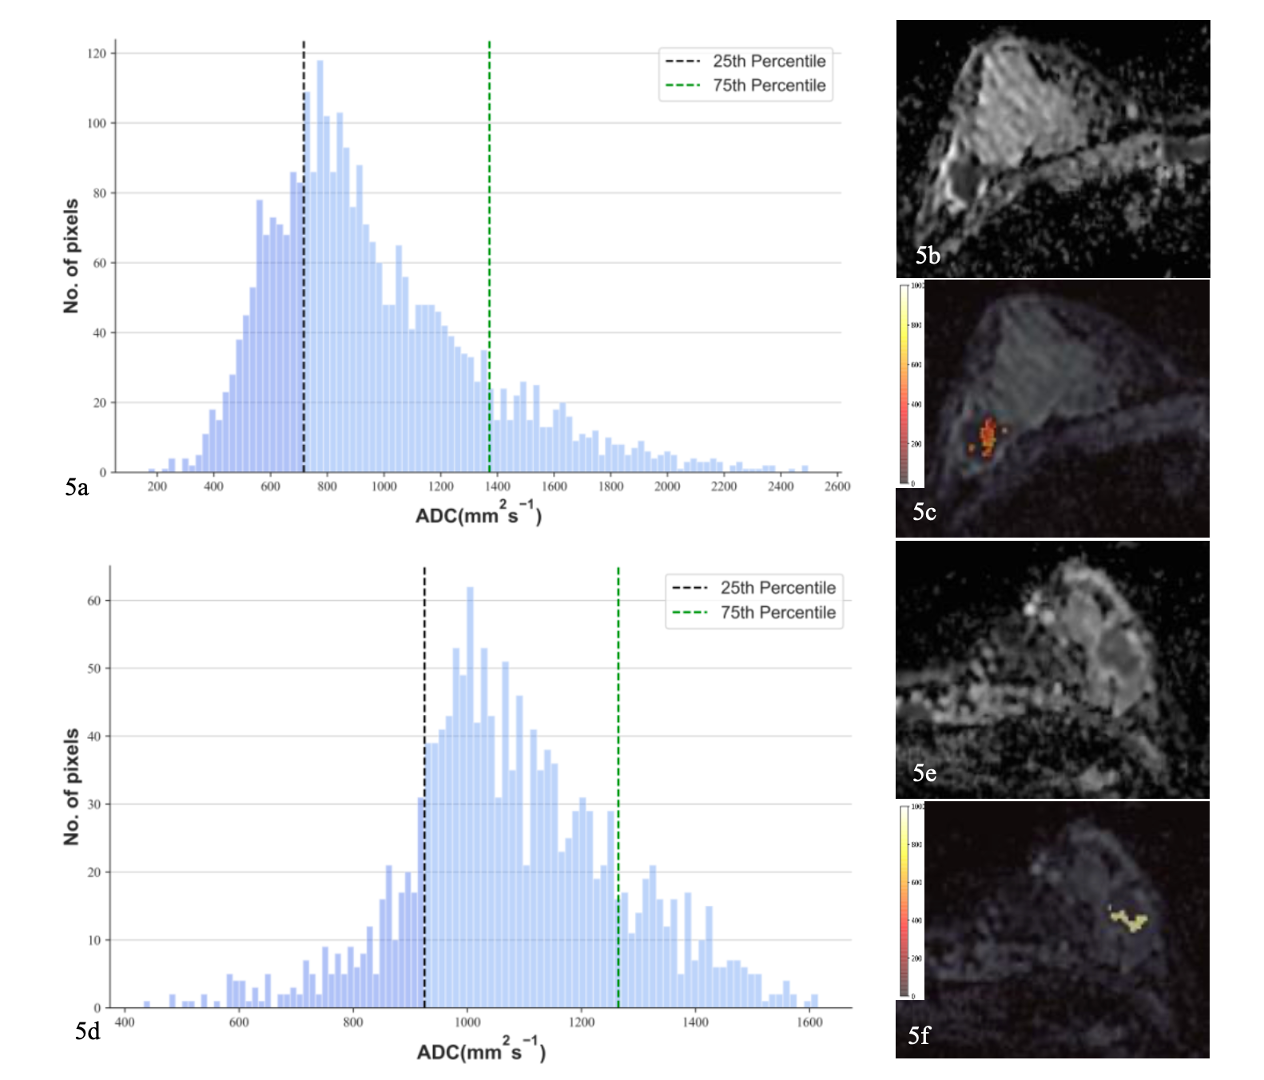
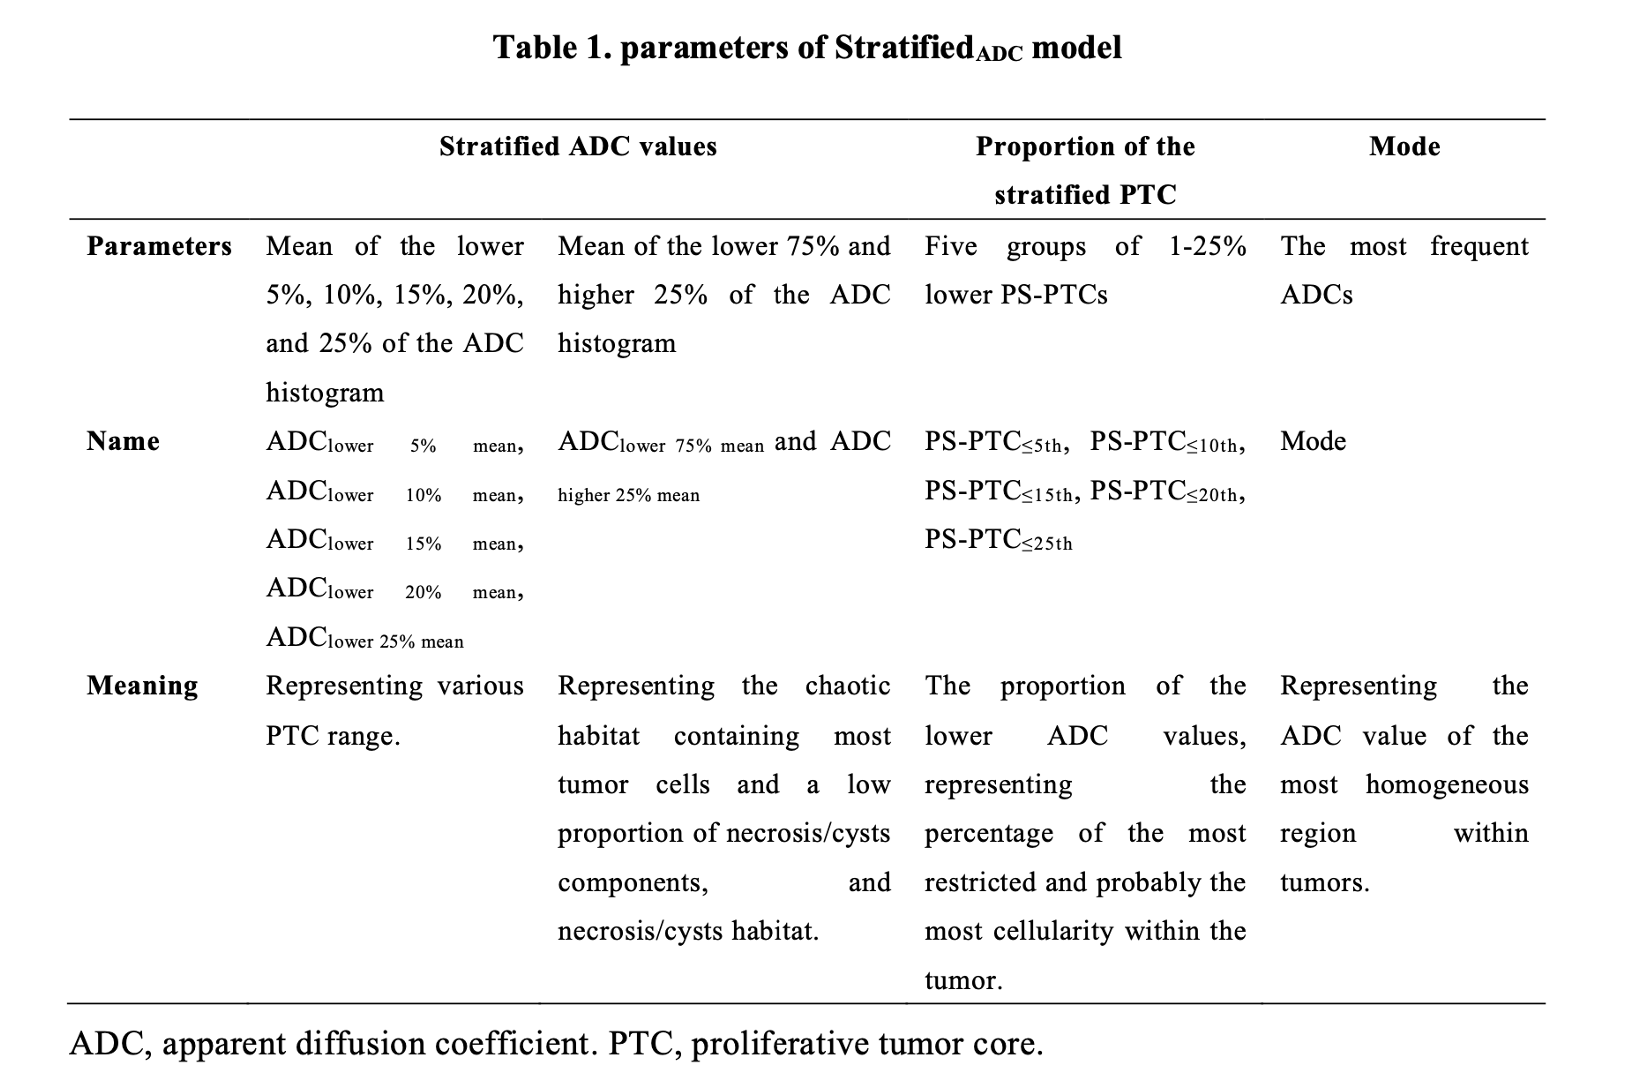
Table 1. parameters of StratifiedADC model
ADC, apparent diffusion coefficient. PTC, proliferative tumor core.
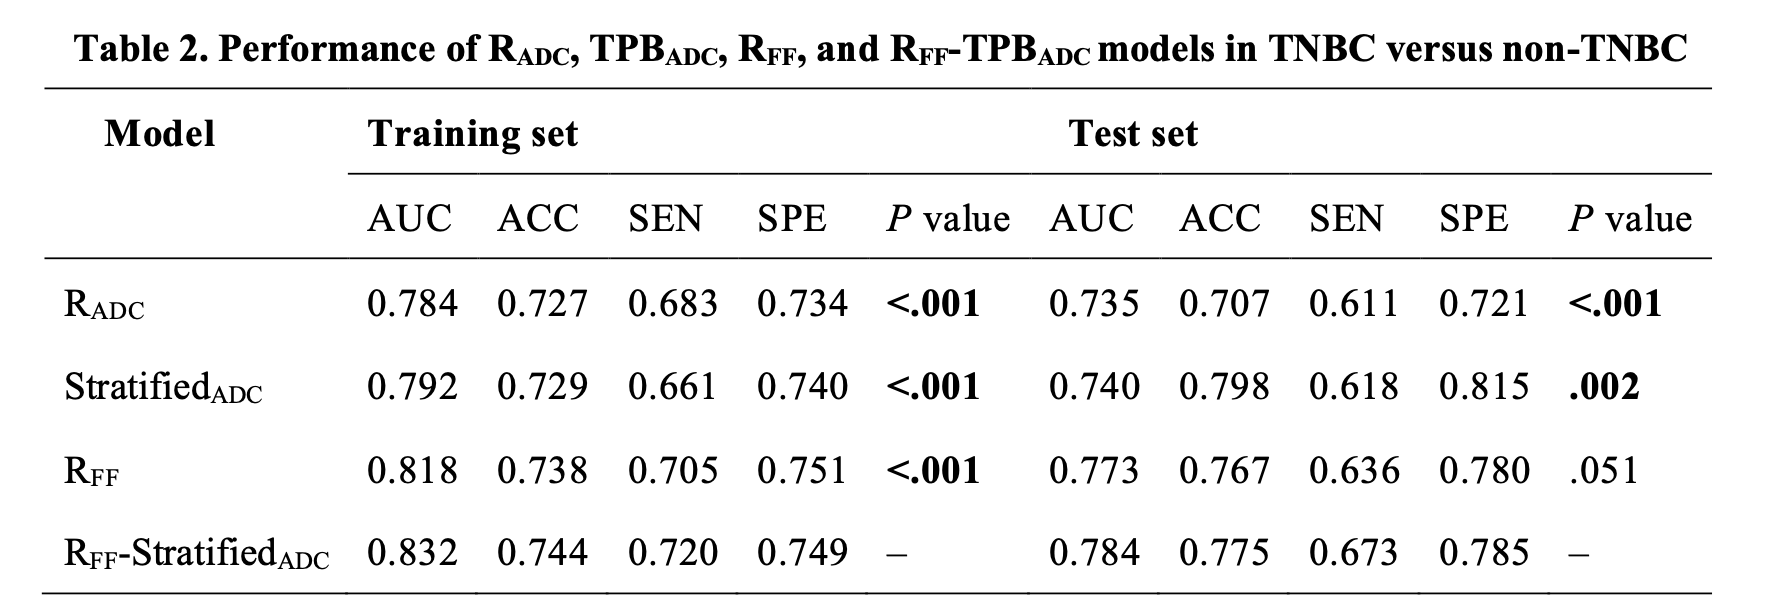
Table 2. Performance of RADC, TPBADC, RFF, and RFF-TPBADC models in TNBC versus non-TNBC
P value: compared the performance between the RFF-StratifiedADC model and other models through paired-sample Wilcoxon signed-rank test in the training and test sets. Significance values (P <.05) are presented in bold. ACC, Accuracy; AUC, area under the receiver-operating characteristic curve; SEN, sensitivity; SPE, specificity.