0203
Apparent diffusion coefficient as a non-contrast marker of residual disease after breast neoadjuvant treatment1Center for MR Research / Radiology, University of Minnesota, MINNEAPOLIS, MN, United States, 2Radiology, University of California San Francisco, San Francisco, CA, United States, 3University of Washington, Seattle, WA, United States, 4Radiology, University of Minnesota, MINNEAPOLIS, MN, United States, 5Radiology, University of Pennsylvania, Philadelphia, PA, United States, 6Radiology, University of Californa San Diego, San Diego, CA, United States, 7Radiology, University of Michigan, Ann Arbor, MI, United States, 8Radiology, New York University, New York, NY, United States
Synopsis
Keywords: Breast, Treatment, Cancer, Treatment Response
Motivation: Accurate imaging markers to establish pathologic complete response (pCR) during neoadjuvant chemotherapy (NACT) could enable therapy de-escalation to avoid excessive systemic treatments
Goal(s): To determine if quantitative diffusion-weighted MRI (DWI) can accurately detect pCR following NACT.
Approach: In the ACRIN 6698/I-SPY 2 multicenter trial dataset, tumor region apparent diffusion coefficient (ADC) from DWI was measured on post-NACT/presurgical MRIs. The accuracy of ADC for predicting pCR, alone and in combination with functional tumor volume (FTV) from contrast-enhanced MRI, was assessed.
Results: In multivariate models ADC accurately predicts pCR, and is influenced by field strength, spatial resolution, and lesion morphology.
Impact: Apparent diffusion coefficient measured by DWI shows promise for determining absence of residual disease following chemotherapy and may provide a non-contrast option for tailoring therapies and enabling patients to avoid unnecessary prolongation of treatment.
Introduction
Non-invasive imaging that can detect residual disease after neoadjuvant chemotherapy (NACT) could enable personalized treatment regimens by treating patients until a pathologic complete response (pCR) has been achieved and spare them the morbidity of unnecessary therapy. It has been reported that subjective interpretation of diffusion-weighted MRI (DWI) can give an assessment of residual disease1. The apparent diffusion coefficient (ADC) on DWI, which reflects tissue water diffusion and cellularity, has been previously identified as an early marker of response to therapy2 as confirmed in the large ACRIN 6698 multicenter trial3, but its value to identify presence of residual disease is less understood. The purpose of this study was to determine if quantitative ADC measured on pre-surgical MRIs could accurately distinguish patients with and without residual invasive breast cancer.Methods
This retrospective study utilized the publicly available ACRIN 6698 trial dataset hosted on TCIA4. ACRIN 6698, a sub-study of the larger I-SPY 2 treatment trial, acquired serial multiparametric MRI measurements over the course of NACT, at pre-treatment, 3- and 12- weeks mid-treatment, and post treatment (pre-surgical) timepoints. Pre-surgical data were used for this analysis and included original dicom images, functional tumor volume (FTV) segmentation masks derived from contrast-enhanced (CE) images, ADC maps, and manual ADC regions of interest (ROIs) as defined in the primary analysis. Dicom images and metadata were analyzed in python using SimpleITK5 to calculate FTV volumes and mean ADC values.The ability to detect residual disease was evaluated using receiver-operator curve (ROC) analyses. Performance was characterized using the area under the curve (AUC) with pCR as the outcome. Multiple logistic regression models were fit to assess the effect of combining ADC, FTV, and molecular subtype based on hormone receptor (HR) and human epidermal growth factor receptor 2 (HER2) status.
The performance of ADC was evaluated in subgroups based on imaging characteristics (field strength and spatial resolution) and pre-treatment lesion morphology (single or multiple lesions, mass or non-mass findings; longest diameter). Spatial resolution was characterized by the nominal acquired volume of each imaging pixel to include in-plane resolution and slice thickness effects. Spatial resolution and lesion size were dichotomized by the median value for subgroup comparisons. Subgroups with fewer than 20 pCRs were not considered to avoid spurious findings.
All statistical analyses were performed using JMP (SAS Institute, Cary NC) and scikit-learn6. AUC confidence intervals were determined using DeLong’s method7,8.
Results
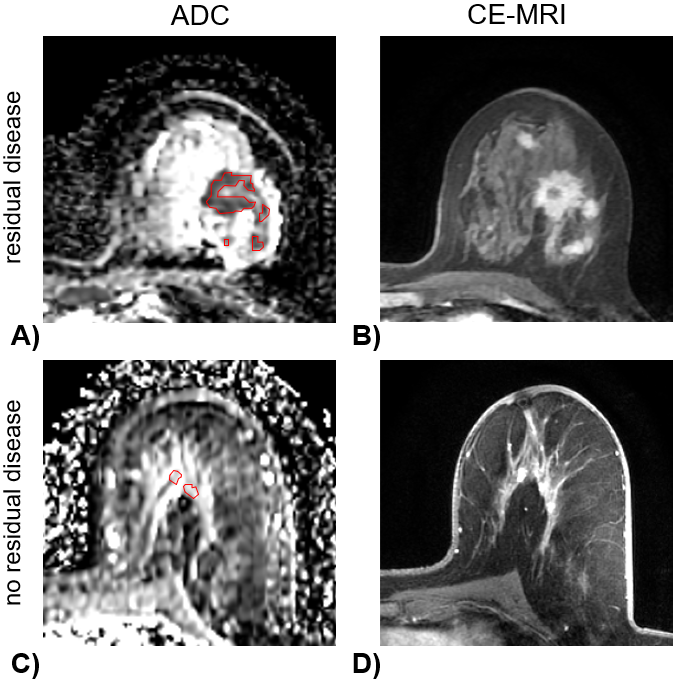
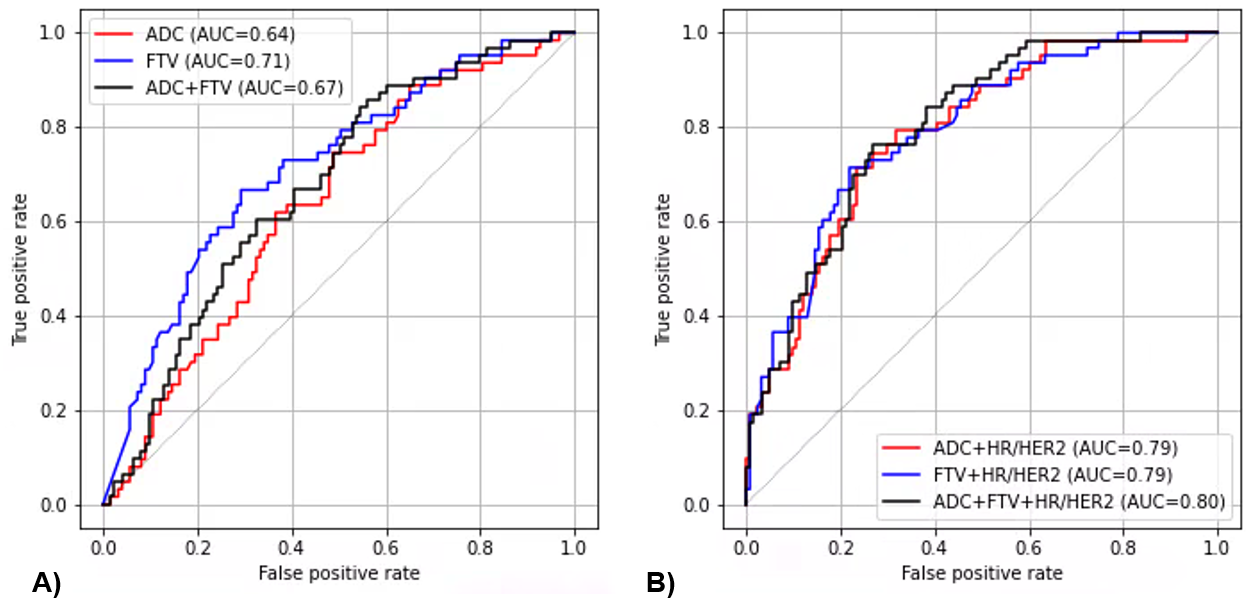
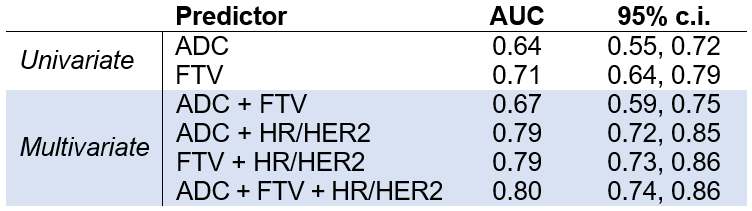
Of the 242 participants included in the ACRIN 6698 analysis set, 186 had evaluable imaging data for both CE-MRI and DWI at the pre-surgery timepoint (83 HR+/HER2-, 29 HR+/HER2+, 17 HR-/HER2+, 57 HR-/HER2- subtypes). Overall, 63/186 (34%) achieved pCR. Examples are shown in Figure 1.Univariate and multivariate AUCs for predicting pCR are tabulated in Table 1. The performance of ADC (AUC=0.64) was lower than that of FTV (AUC = 0.71); using both together did not improve performance (0.67). Performance increased with the addition of molecular subtype, giving comparable AUCs of 0.79-0.80 for all models (Figure 2).
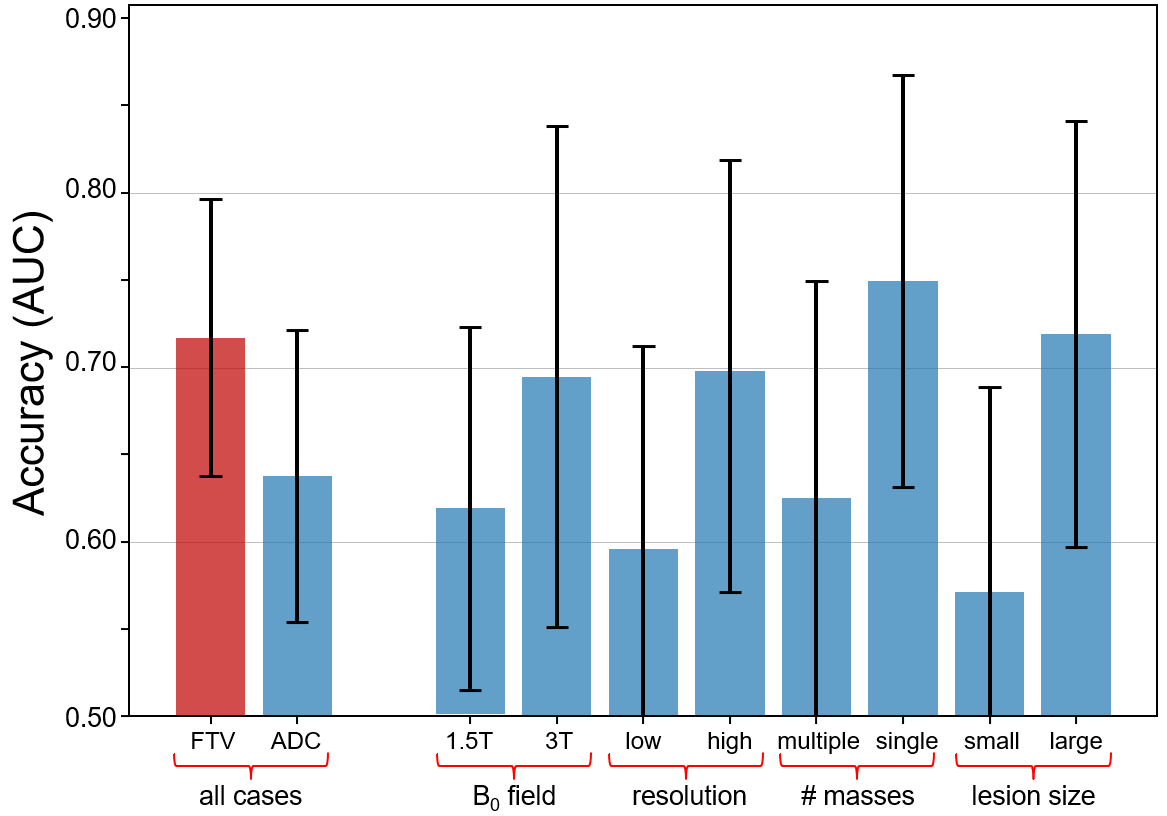
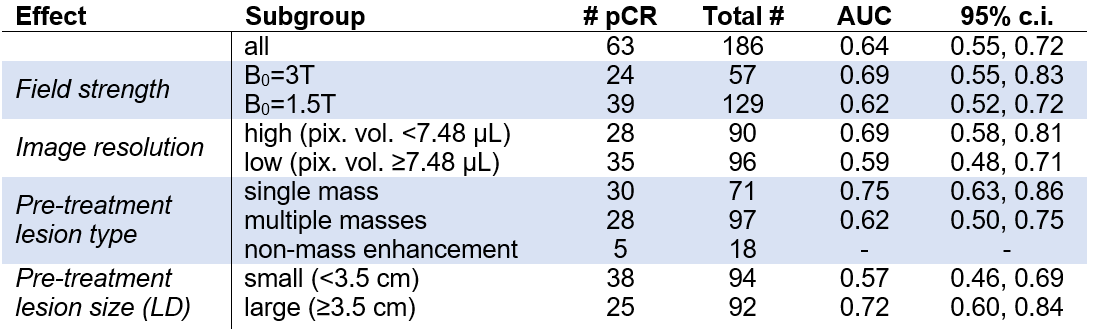
The performance of ADC alone was further analyzed in subgroups based on imaging factors and lesion morphology to identify aspects that impact performance (Table 2, Figure 3). ADC showed moderately improved ability to detect residual disease when measured with higher field strength and higher image spatial resolution. The non-mass enhancement lesion type subgroups were too small for analysis, so only single and multiple mass groups were assessed. ADC also performed better with larger lesions and single-mass lesions, further supporting the need for higher spatial resolution to improve accuracy of DWI for evaluating response to treatment.
Discussion
This exploratory retrospective analysis showed that measurements of ADC at the pre-surgical timepoint have moderate accuracy for non-invasively detecting residual disease. However, when combined with HR/HER2 subtype in multivariate analyses, ADC gives accuracy similar to that of FTV. This may support the use of non-contrast MRI scans for following neoadjuvant chemotherapy (although in this data the ADC ROIs were drawn with guidance from CE-MRI). Subgroup analyses further showed that ADC performance was better when acquired at high field and with high spatial resolution and for evaluating larger lesions and single masses. Together these findings suggest that higher image quality and spatial resolution might improve the overall performance of ADC across a broader range of lesion sizes and types. Results need to be further validated in future prospective studies.Conclusion
Quantitative ADC measurements can detect the presence of residual disease. The performance can potentially be improved by increasing image resolution and adjusting for variabilities in field strength and lesion morphology.Acknowledgements
Our thanks to all participants of the I-SPY 2.2 Imaging Working Group / Subgroup on Diffusion Weighted Imaging for their ongoing discussions that motivated this work. Funding sources: NIH P41-EB027061, R01-CA248192, U01-CA225427, and P01-CA210961.References
1. Ota R, Kataoka M, Iima M, et al. Evaluation of pathological complete response after neoadjuvant systemic treatment of invasive breast cancer using diffusion-weighted imaging compared with dynamic contrast-enhanced based kinetic analysis. European Journal of Radiology. 2022;154:110372. doi:10.1016/j.ejrad.2022.110372
2. Reig B, Lewin AA, Du L, et al. Breast MRI for Evaluation of Response to Neoadjuvant Therapy. RadioGraphics. 2021;41(3):665-679. doi:10.1148/rg.2021200134
3. Partridge SC, Zhang Z, Newitt DC, et al. Diffusion-weighted MRI Findings Predict Pathologic Response in Neoadjuvant Treatment of Breast Cancer: The ACRIN 6698 Multicenter Trial. Radiology. 2018;289(3):618-627. doi:10.1148/radiol.2018180273
4. Clark K, Vendt B, Smith K, et al. The Cancer Imaging Archive (TCIA): Maintaining and Operating a Public Information Repository. J Digit Imaging. 2013;26(6):1045-1057. doi:10.1007/s10278-013-9622-7
5. Lowekamp BC, Chen DT, Ibáñez L, Blezek D. The Design of SimpleITK. Front Neuroinform. 2013;7. doi:10.3389/fninf.2013.00045
6. Pedregosa F, Varoquaux G, Gramfort A, et al. Scikit-learn: Machine Learning in Python. MACHINE LEARNING IN PYTHON. 7. DeLong ER, DeLong DM, Clarke-Pearson DL. Comparing the areas under two or more correlated receiver operating characteristic curves: a nonparametric approach. Biometrics. 1988;44(3):837-845.
8. Sun X, Xu W. Fast Implementation of DeLong’s Algorithm for Comparing the Areas Under Correlated Receiver Operating Characteristic Curves. IEEE Signal Processing Letters. 2014;21(11):1389-1393. doi:10.1109/LSP.2014.2337313
Figures