0200
Value of quantitative relaxation mapping calculated from Multiple-Repetition Multiple-Echo DWI acquisition in prostate cancer detection1Radiology, Kawasaki Medical School, Kurashiki, Japan, 2Philips Japan, Tokyo, Japan, 3Radiolonet Tokai, Nagoya, Japan, 4Kawasaki Medical School, Kurashiki, Japan
Synopsis
Keywords: Prostate, Prostate
Motivation: The detection rate of csPCa in PI-RADS 3 lesions is only 25-38%. This leads to unnecessary biopsies.
Goal(s): Can multiparametric quantitative maps based on estimated T1 and T2 help differentiate clinically significant prostate cancer (csPCa) from non-csPCa in PI-RADS 3 lesions?
Approach: We compare T1, T2, and ADC obtained from Multiple-Repetition time Multiple- Echo time (MRME) based DWI (MRME-DWI) between csPCas and non-csPCas in PI-RADS 3 lesion using MRI-ultrasound fusion targeted biopsy as the reference standard.
Results: The T1, T2, and ADC were significantly lower for csPCas than non-csPCas. Combining these indices yields an AUC of 0.82.
Impact: MRME-DWI can simultaneously obtain T1, T2, and ADC from a single region of interest in a single imaging session. Combining these quantitative measures is expected to improve the detection rate of clinically significant prostate cancer in PI-RADS 3 lesions.
INTRODUCTION
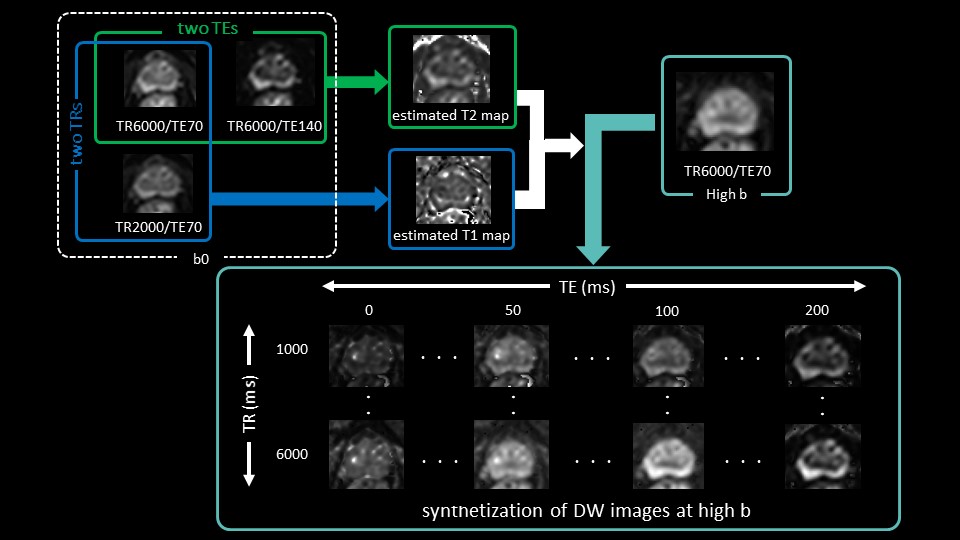
Multiparametric MRI (mp-MRI) is widely used in prostate. However, one challenge is that mp-MRI cannot reliably differentiate clinically significant prostate cancer (csPCa) from non-csPCa in suspicious lesions with PI-RADS category 3. Two articles1,2 reported that only 25-38% of the PI-RADS 3 lesions are csPCa. This insufficient diagnostic performance could lead to unnecessary biopsies. This low level of detectability could be due to low CNR, related to the specific feature that T1 and T2 are shorter in PCa than normal prostate3-5. Recently, we have reported clinical usefulness of an arbitrary diffusion contrast-weighted image of the target TR and target TE in prostate, based on Multiple Repetition time Multiple Echo time (MRME) based DWI6. Synthetization of DW images generated with TR of 1000 ms and TE of 0 ms improved contrast between PCa and normal prostate. Synthetic images are generated from quantitative relaxation parameters. Therefore, these relaxation parameters calculated from MRME-DWI could also be utilized to detect csPCa. The purpose of this study is to validate if multiparametric quantitative maps based on estimated T1 and T2 can help differentiate csPCa from non-csPCa in PI-RADS 3 lesions.METHODS
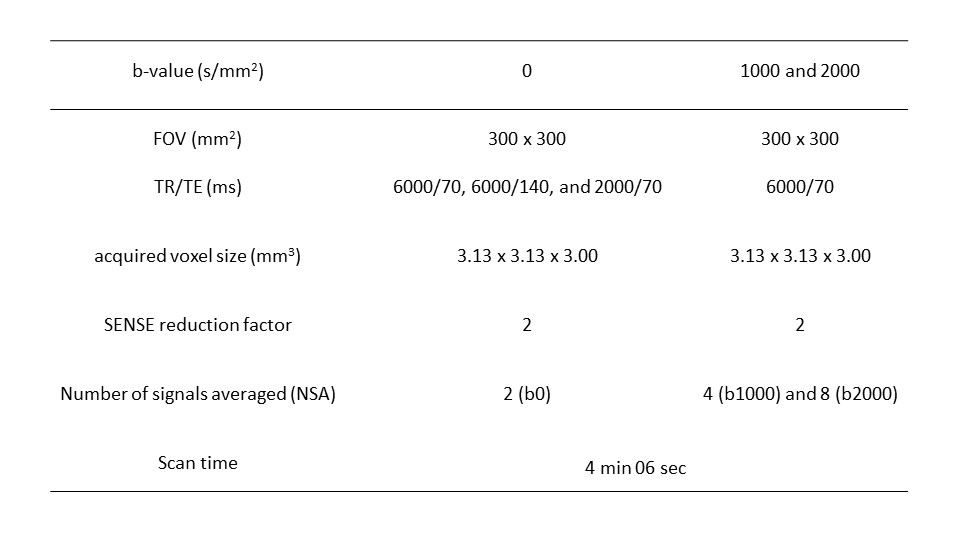
IRB approved this retrospective study and waived the need for informed consent. 73 patients with PI-RADS 3 lesions who underwent prostate mp-MRI and subsequent MRI-ultrasound fusion targeted biopsy for lesions suggestive of PCa on mp-MRI were evaluated. All MR images were obtained with a 3T MRI (Ingenia Elition 3.0T, Philips). For synthetization of DW image, MRME-DWI acquisition includes b0 images acquired with two different TR and TE, and b1000 and b2000 acquired with single TR and TE (Figure 1). The T1 can then be estimated by using the signal from 2 b0 images, varying TR and keeping TE constant, while T2 can be estimated from 2 b0 images with constant TR but varying TE (Figure 1). The detailed imaging parameters are described in Figure 2. Estimated T1, T2, and ADC calculated from images at b-value of 0 and 1000 s/mm2 (ADC0-1000) values were compared between PI-RADS 3 target biopsy-proven csPCa and non-csPCa by using Mann-Whitney U test. The diagnostic performance of each parameter was evaluated by ROC curve. P < 0.05 was considered to indicate a statistically significant difference.RESULTS and DISCUSSION
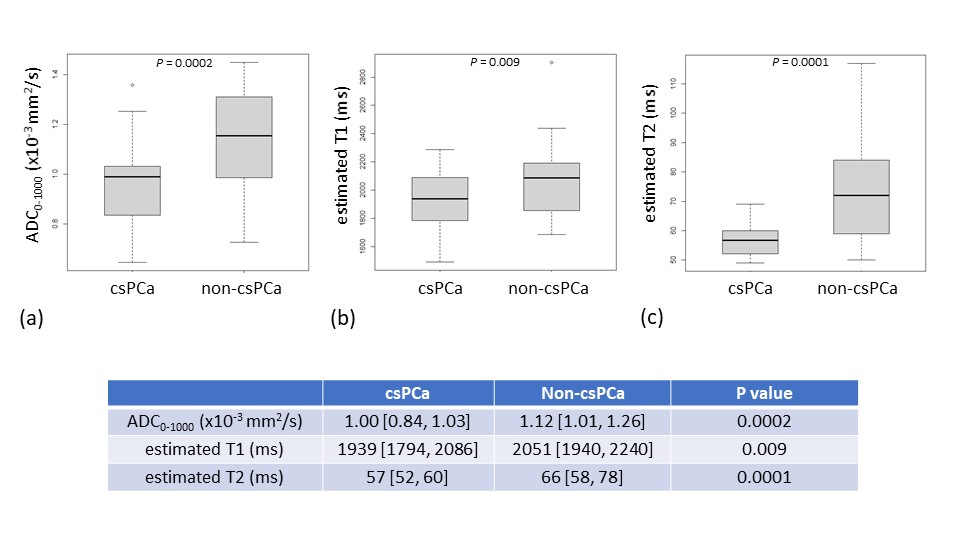
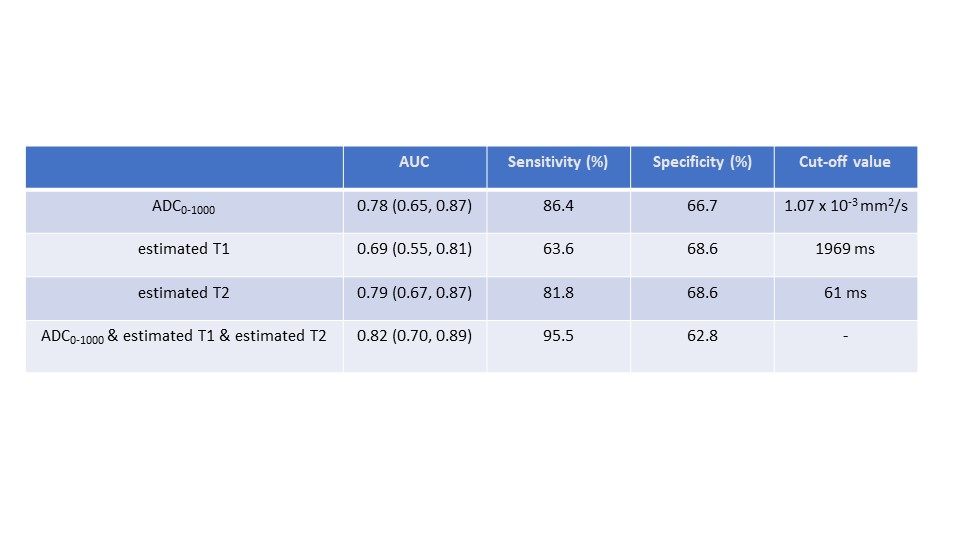
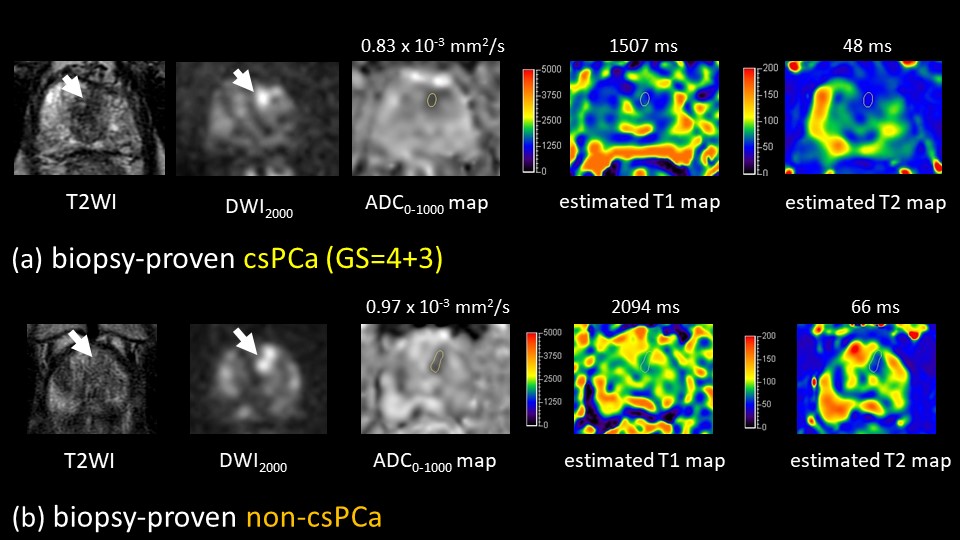
Biopsy-proven csPCa and non-csPCa among PI-RADS 3 lesions were identified in 22 and 51 lesions, respectively. The median estimated T1, T2, and ADC0-1000 in csPCa were significantly lower (1939 ms, 57 ms, and 1.00 mm2/s) than non-csPCa (2051 ms, 66 ms, and 1.12 mm2/s) (P = 0.009 for T1, P = 0.0001 for T2, and P = 0.0002 for ADC0-1000) shown in Figure 3. The AUC for T2 (0.79) is higher than the AUC for T1 (0.69) and ADC0-1000 (0.78) (Figure 4). However, there is no significant difference in AUC among ADC0-1000, estimated T1, and T2. ADC0-1000, estimated T1, and T2 map for two patients are shown in Figure 5. The combination of estimated T1, T2, and ADC0-1000 yields an AUC of 0.82. Figure 5 shows representative clinical cases with cancer and noncancer. With this approach, in addition to the conventional DW images at b-value of 1000 and 2000, ADC map, and estimated T1 and T2 map, synthetization of DW image for each b-value can be acquired in approximately 4 minutes, which is acceptable scan time in clinical practice. The quantitative relaxation values are calculated based on just two data points, but these estimates could be clinically relevant if further study improves the current results.CONCLUSION
Our results indicate that estimated T2 calculated from MRME-DWI acquisition might more accurately differentiate csPCa from non-csPCa in PI-RADS 3 lesions compared to ADC. However, to reduce the number of unnecessary biopsies, it is crucial to improve diagnostic performance more, thus necessitating further optimization.Acknowledgements
No acknowledgement found.References
1. Tamada T, Kido A, Yamamoto A, et al. Comparison of Biparametric and Multiparametric MRI for Clinically Significant Prostate Cancer Detection With PI-RADS Version 2.1. J Magn Reson Imaging 2021; 53: 283-291.
2. Stolk TT, de Jong IJ, Kwee TC, et al. False positives in PIRADS (V2) 3, 4, and 5 lesions: relationship with reader experience and zonal location. Abdom Radiol (NY) 2019; 44: 1044-51.
3. Yu AC, Badve C, Ponsky LE, Pahwa S, et al. Development of a Combined MR Fingerprinting and Diffusion Examination for Prostate Cancer. Radiology 2017; 283: 729-38.
4. Shiradkar R, Panda A, Leo P, et al. T1 and T2 MR fingerprinting measurements of prostate cancer and prostatitis correlate with deep learning-derived estimates of epithelium, lumen, and stromal composition on corresponding whole mount histopathology. Eur Radiol 2021;31: 1336-46.
5. Panda A, Obmann VC, Lo WC, et al. MR Fingerprinting and ADC Mapping for Characterization of Lesions in the Transition Zone of the Prostate Gland. Radiology 2019; 292: 685-94.
6. Ueda Y, Tamada T, Sanai H, et al. Feasibility of synthetic short TR and short TE DWI in prostate cancer. Proceedings of the 30th Annual Meeting of ISMRM, 2022 #3711.
Figures