0195
Baseline virtual MR elastography and extracellular volume fraction in the prediction of response to neoadjuvant chemotherapy in gastric cancer1Department of Diagnostic Radiology, National Cancer Center/National Clinical Research Center for Cancer/Cancer Hospital, Chinese Academy of Medical Sciences and Peking Union Medical College, Beijing, China, 2MR Research Collaboration, Siemens Healthineers, Beijing, China
Synopsis
Keywords: Digestive, Elastography, gastrointestinal; Cancer
Motivation: Although neoadjuvant chemotherapy (NAC) was recommended for gastric cancer (GC), only about 40% patients could achieve pathological response. Accurate prediction of the NAC response is crucial for patients’ benefits.
Goal(s): To evaluate the predictive performance of virtual MR elastography (vMRE) and extracellular volume (ECV) for predicting the response to of NAC in GC patients.
Approach: Patients underwent DWI-based elastography, pre- and post-contrast T1 mapping before treatment. DWI-based virtual shear modulus (μDiff) and ECV were calculated from DWI and T1 mapping.
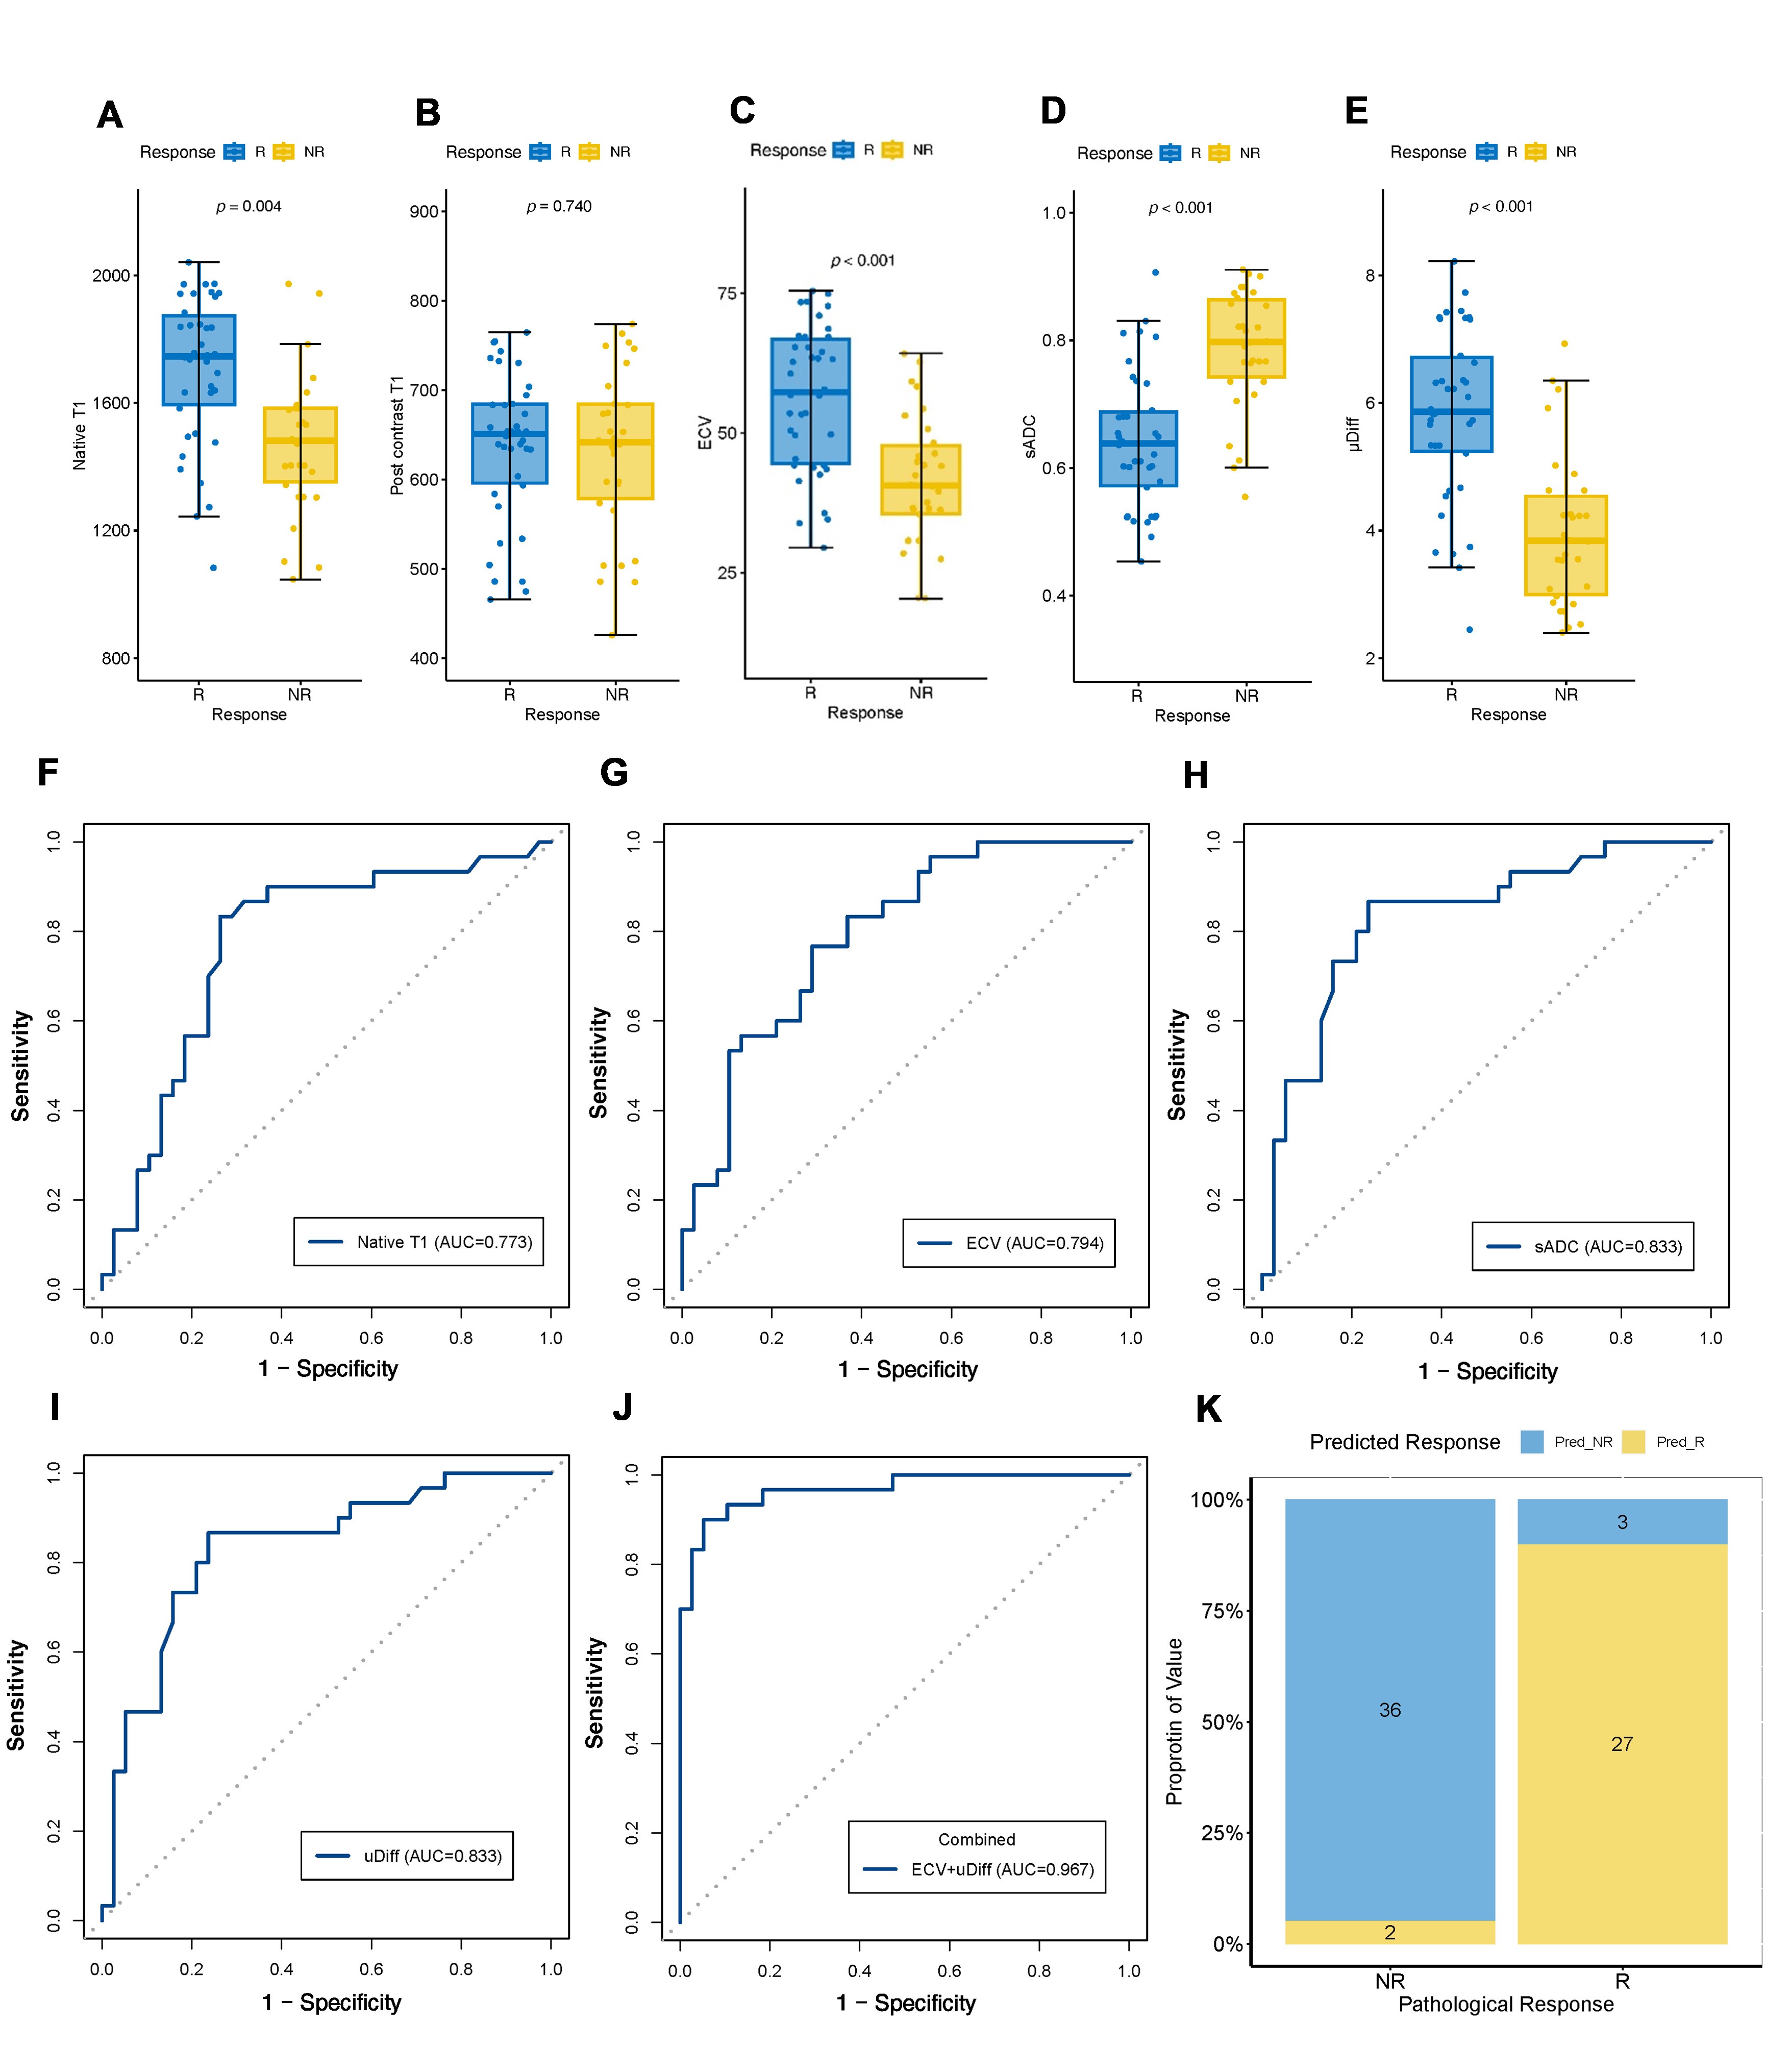
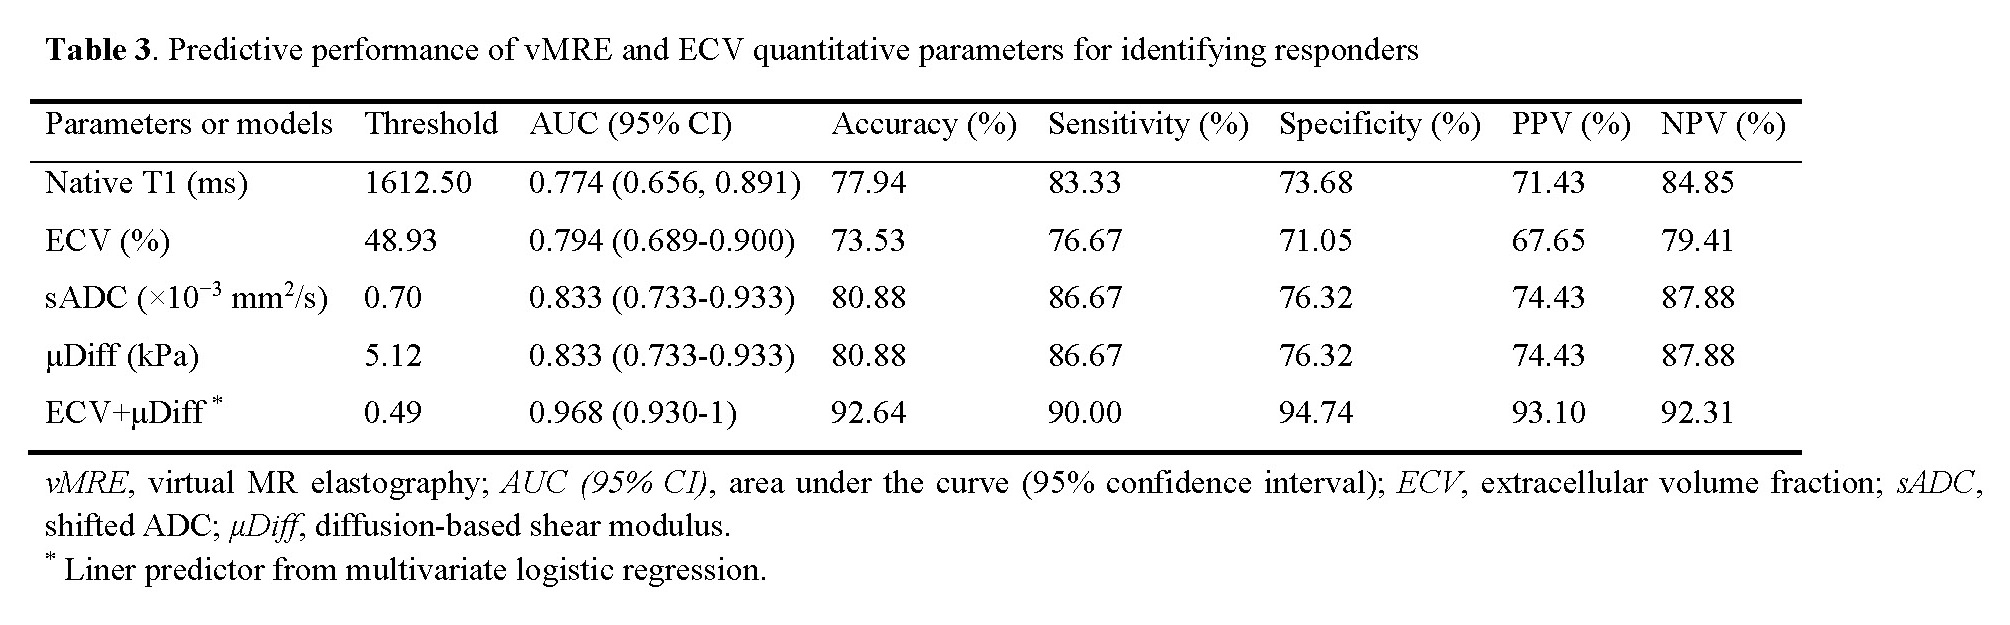
Results: Both μDiff (AUC: 0.833) and ECV (AUC: 0.794) were independent predictors for NAC response, their combination could improve the AUC to 0.968.
Impact: Our result revealed that DWI-based virtual shear modulus (μDiff) and ECV exhibited a promising predictive ability for predicting response to NAC. This would aid in identifying responders before treatment, reducing unnecessary toxicity and side effects, and guiding individualized treatment.
Introduction
Most of the patients with GC in China are diagnosed as locally advanced GC (LAGC) with poor outcomes [1-3]. Neoadjuvant chemotherapy (NAC) was recommended by NCCN guidelines as a preferred approach for LAGC before radical gastrectomy [4,5]. However, not all patients can benefit from NAC, and the poor-responders might suffer from additional negative side effects related to chemotherapy [6,7]. Thus, pretreatment and accurate prediction of the NAC response is still a challenge. Cancer-associated fibroblasts and its induced tumor fibrosis play a crucial role in the tumor invasion, metastasis, and chemoresistance, which can reshape the extracellular matrix and change matrix stiffness [8-10]. While being a promising method for evaluation tumor stiffness, magnetic resonance elastography (MRE) lacks in image resolution and relies on additional hardware for vibrations induction [11-13]. Recently, a novel proposed virtual MR elastography (vMRE) based on DWI with dedicated postprocessing could provide high-resolution volumetric tissue stiffness maps [14]. Previous studies have shown that T1 value and extracellular volume fraction (ECV) is an imaging biomarker for myocardial fibrosis and emerging evidence has highlighted its potential in assessing histopathological of GC [15-17]. Hence, the purpose of this study was to assess the performance of vMRE derived stiffness and ECV in predicting response to NAC in LAGC.Methods
Consecutive patients with pathologically confirmed gastric adenocarcinoma and received NAC plus radical gastrectomy were prospective collected. The patients underwent three cycles of NAC (SOX regimen) and received radical surgery within 4 weeks of completion of NAC. Pathologic tumor regression was assessed using the Mandard tumor regression grade (TRG) standard [18]. All patients underwent MR examination on a 3T MRI system (MAGETOM Prisma, Siemens Healthineers, Germany) before NAC. vMRE data were acquired using DWI with four b-value (01, 2003, 8004, 15008, s/mm2). T1 mapping was performed before and 5 min after contrast agent injection, using variable flip angle VIBE sequence. Native and postcontrast T1 mapping were registered before analysis. The shifted ADC (sADC), DWI-based virtual shear modulus (μDiff), and ECV maps were calculated via an in-house developed software written in MATLAB (Version: R2018b, Mathworks, Natick, Mass) on a pixel-by-pixel basis, according to the literature [14-17]. The volumes of interest (VOIs) of the whole tumor were drawn on images of T1 mapping and b800, with reference to T2WI and contrast-enhanced images. All statistical analyses were conducted using R software. Diffusion parameters were compared by Mann–Whitney U test. Logistic regression analyses were performed to identify the independent predictors. The receiver operating characteristic (ROC) curve was performed to evaluate the prediction performance.Results
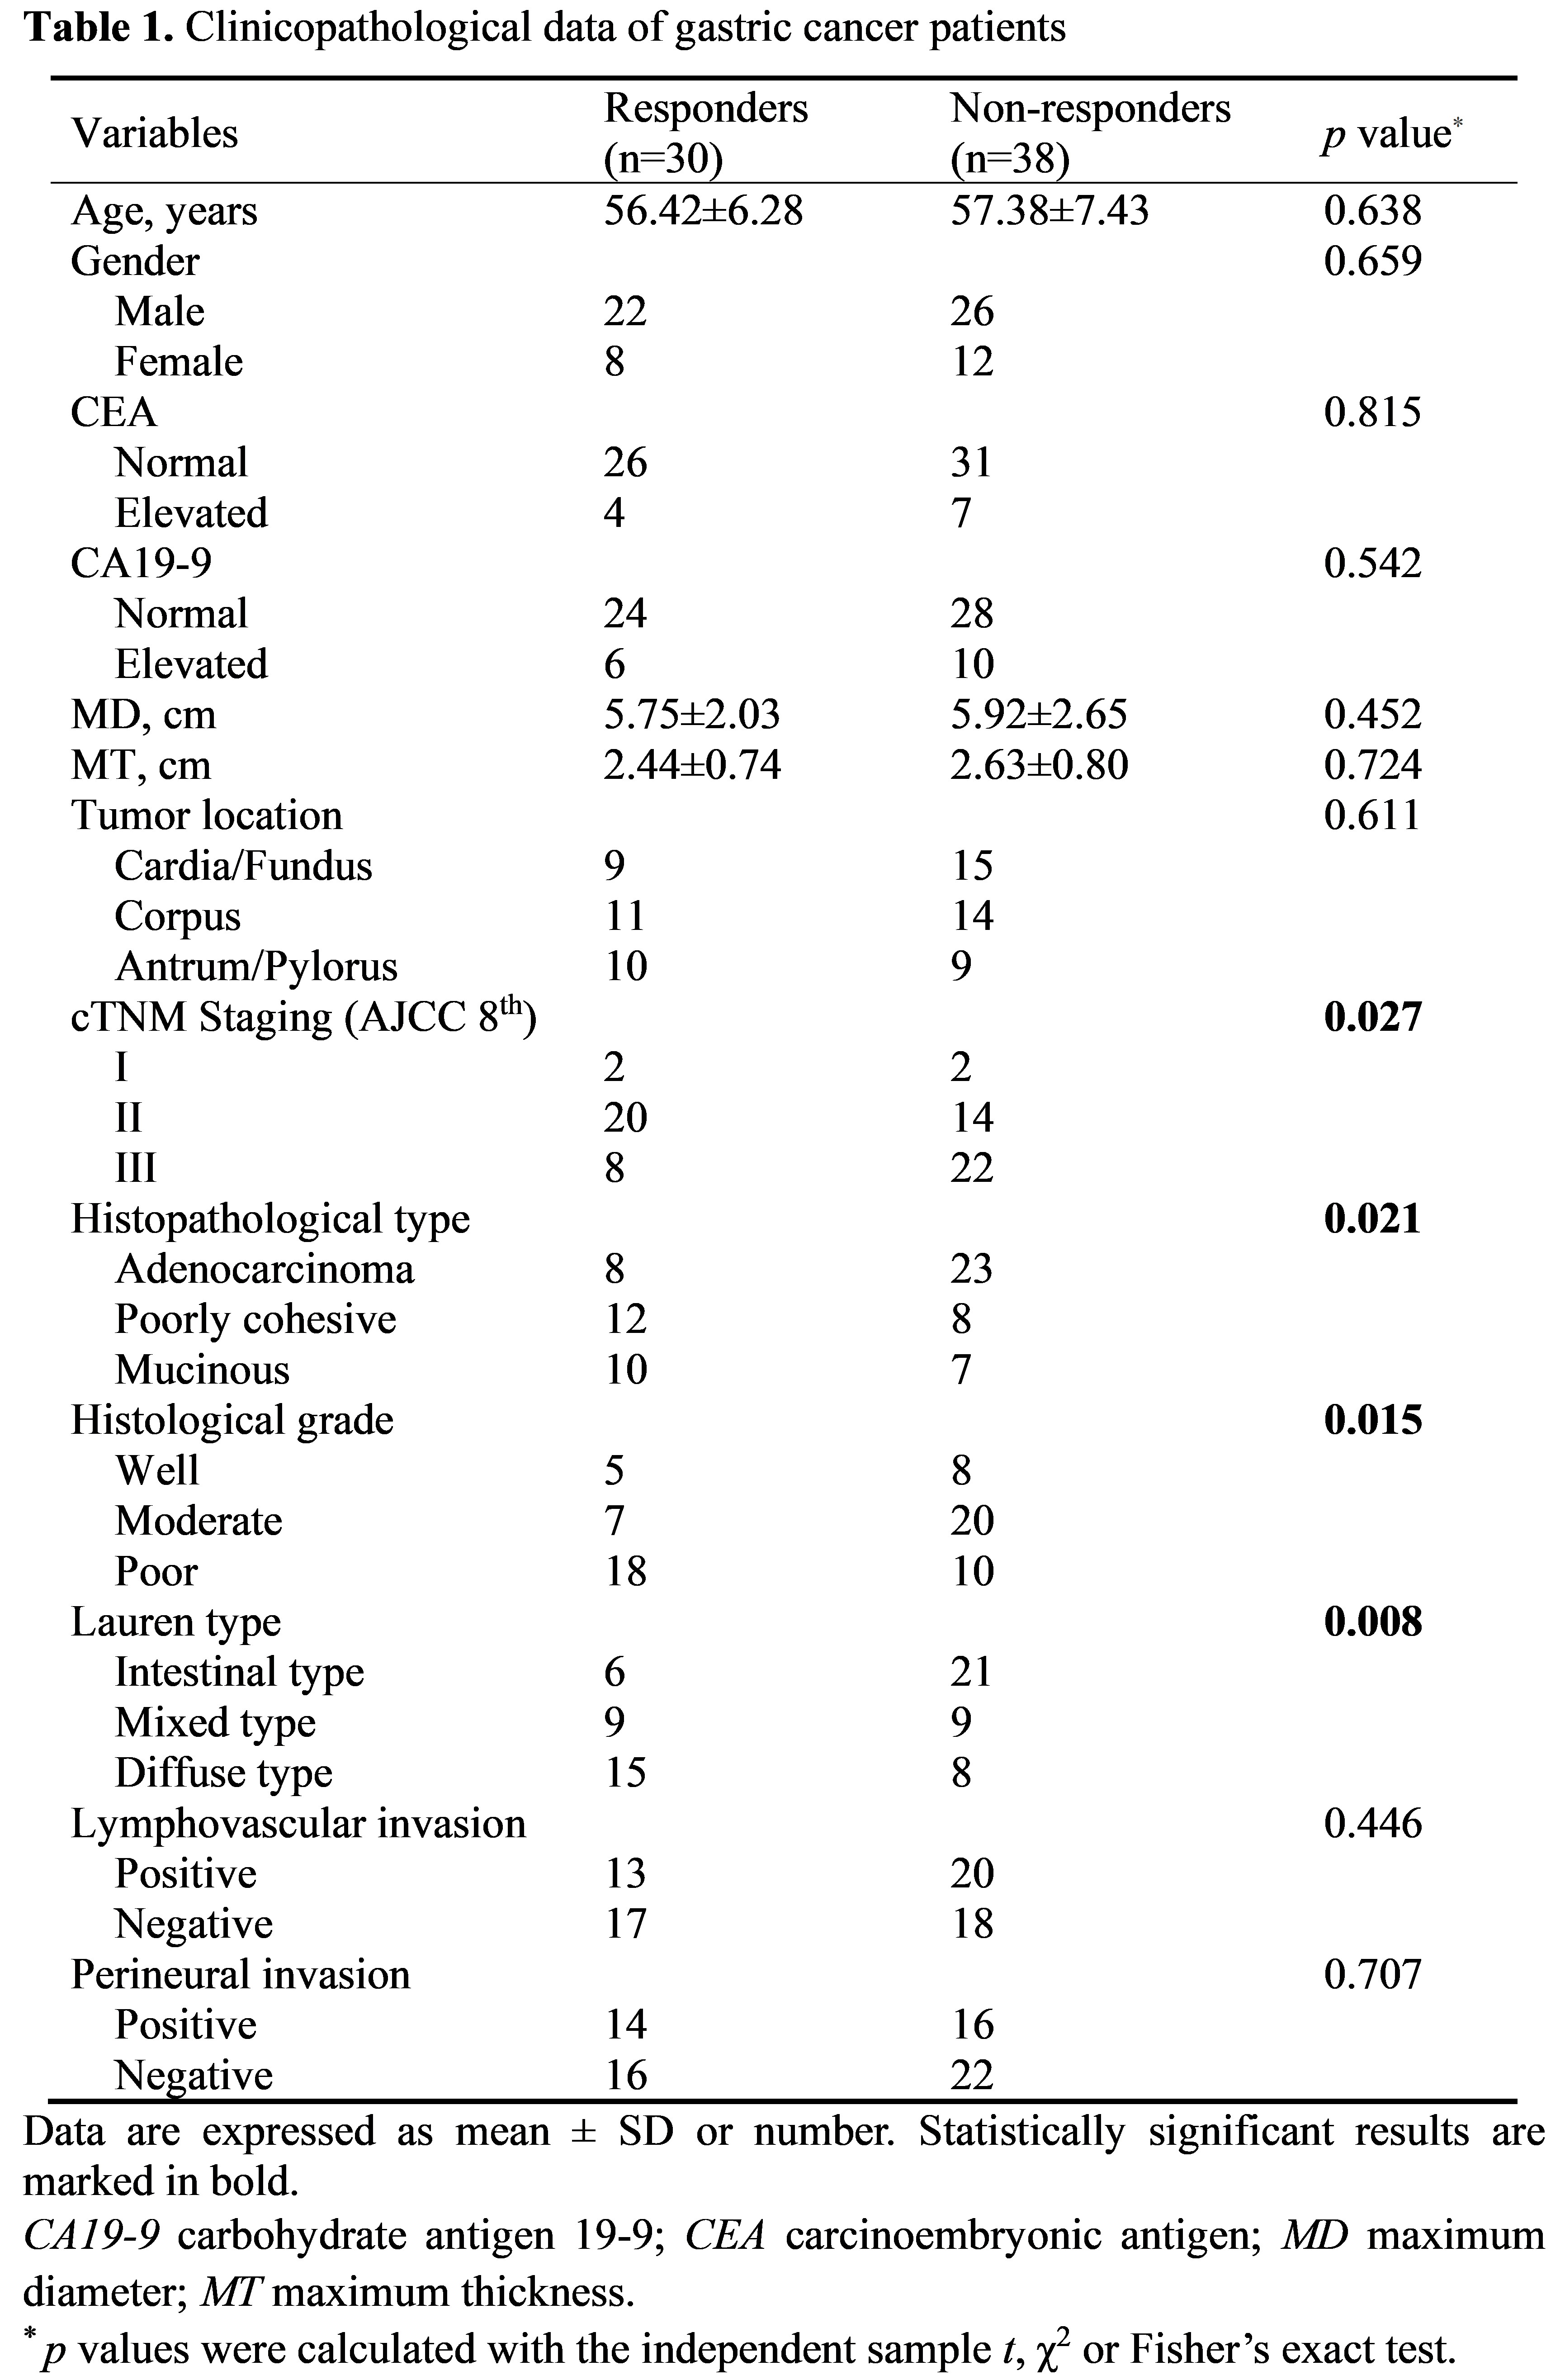
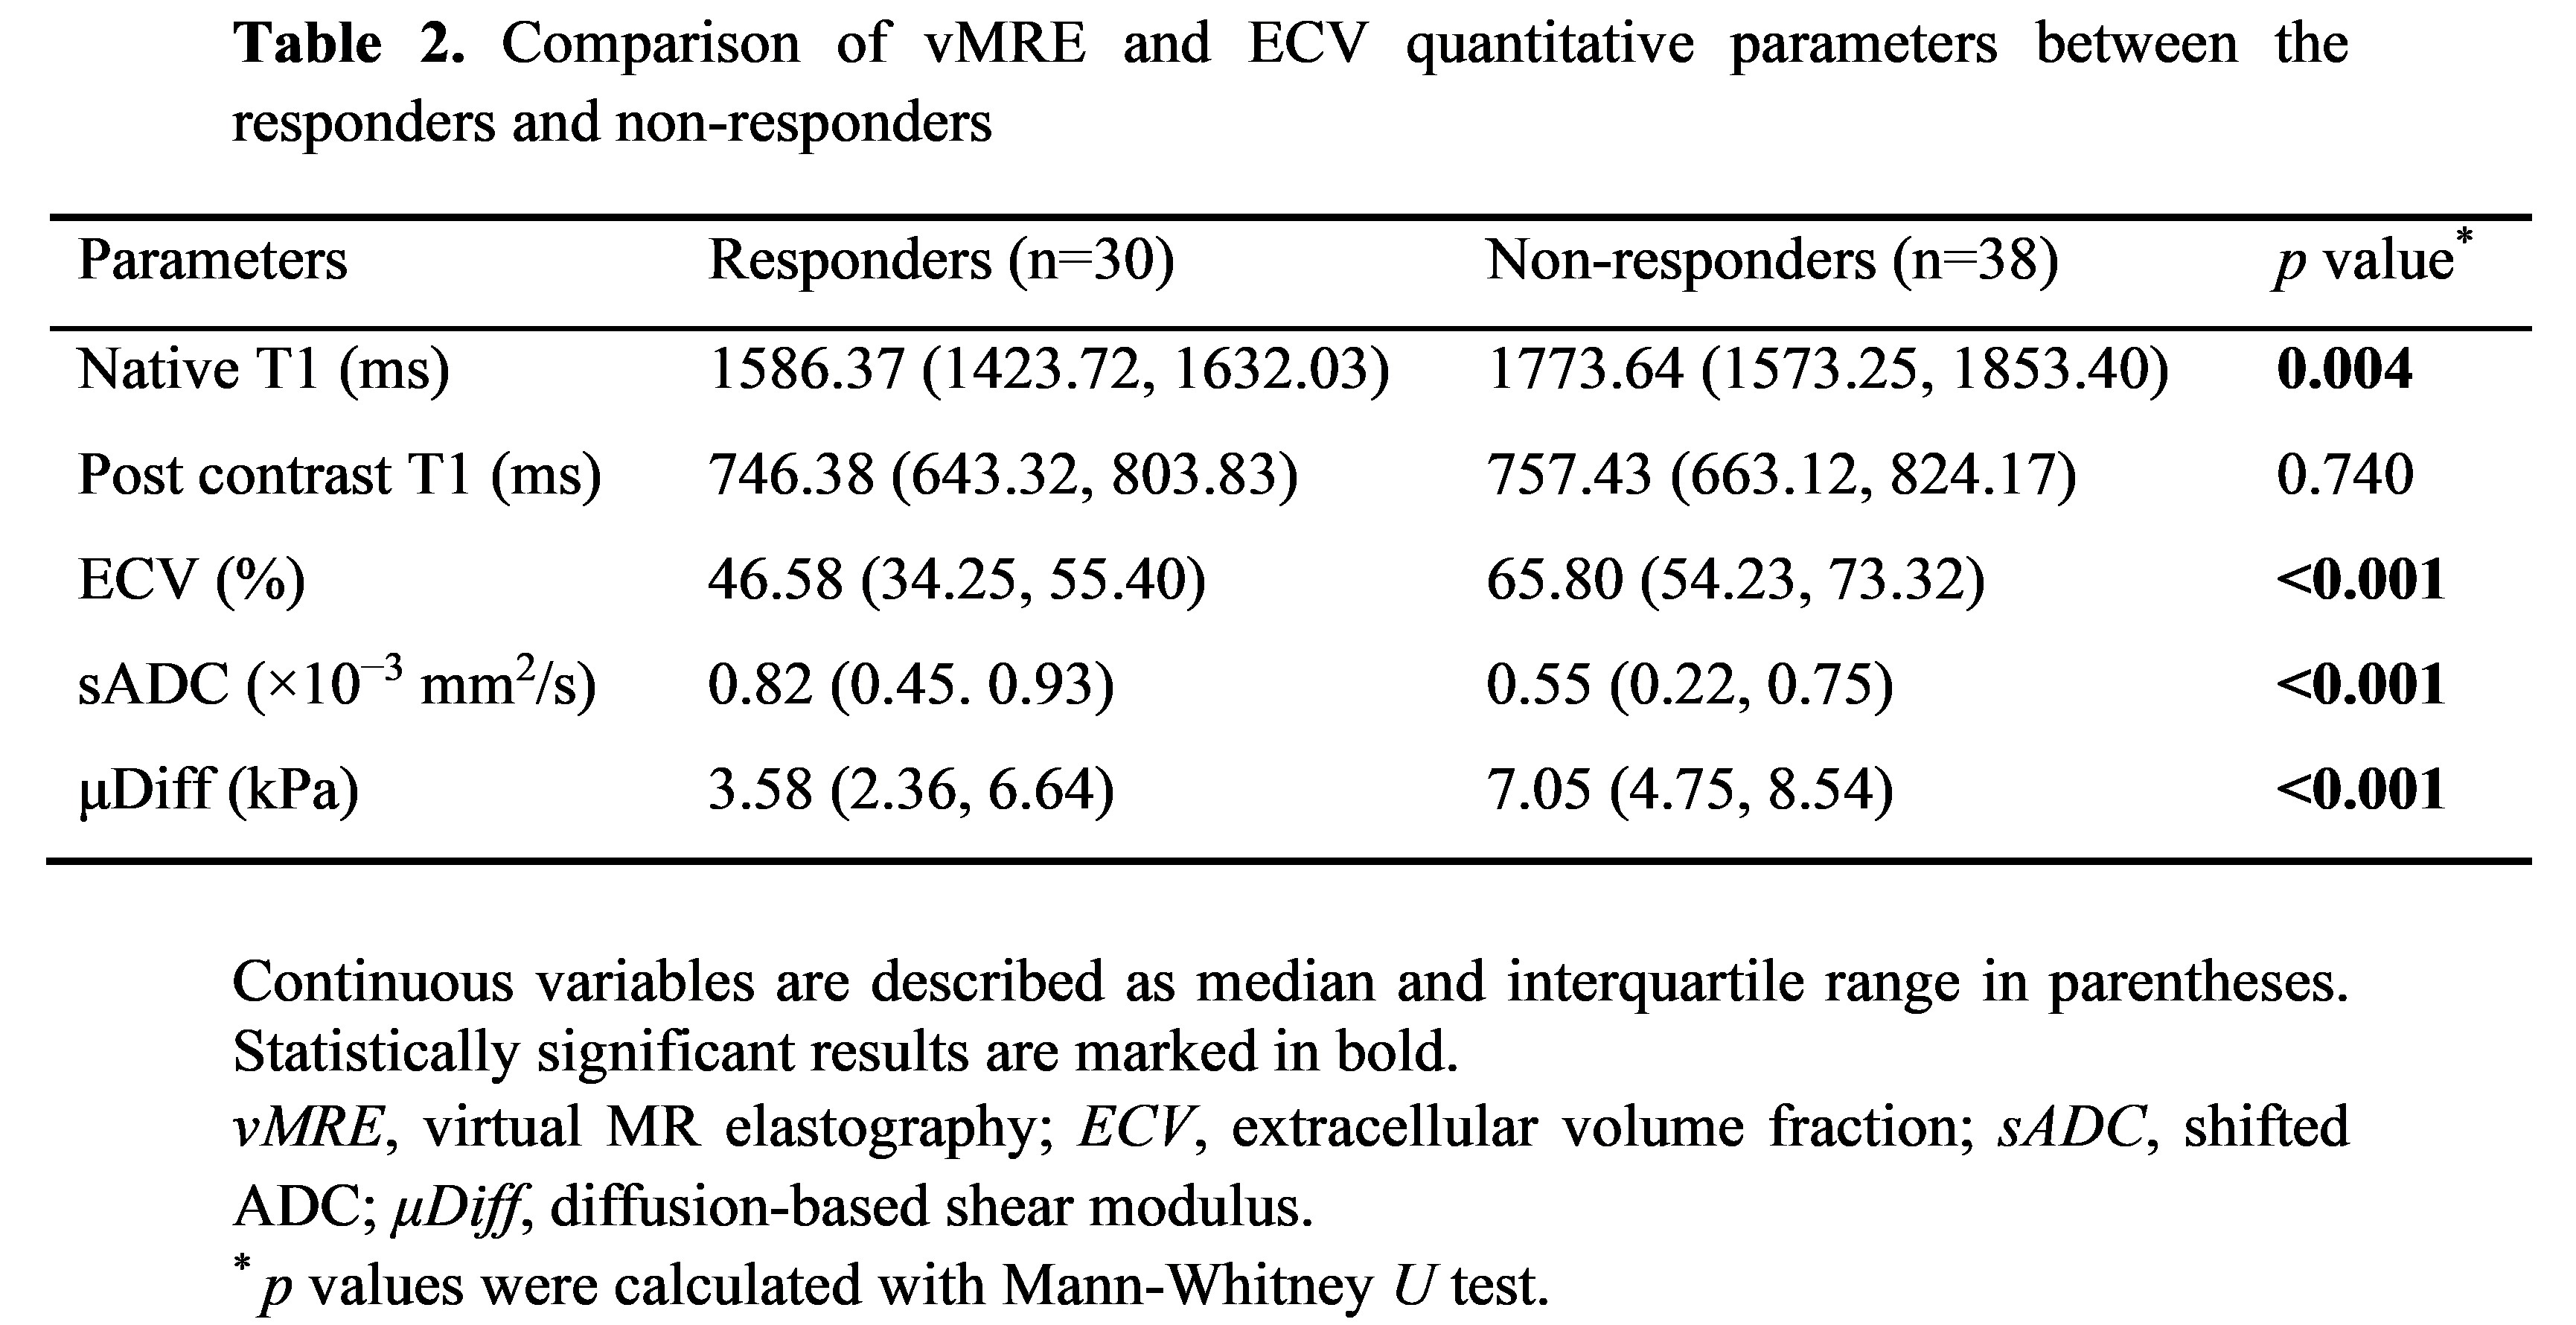
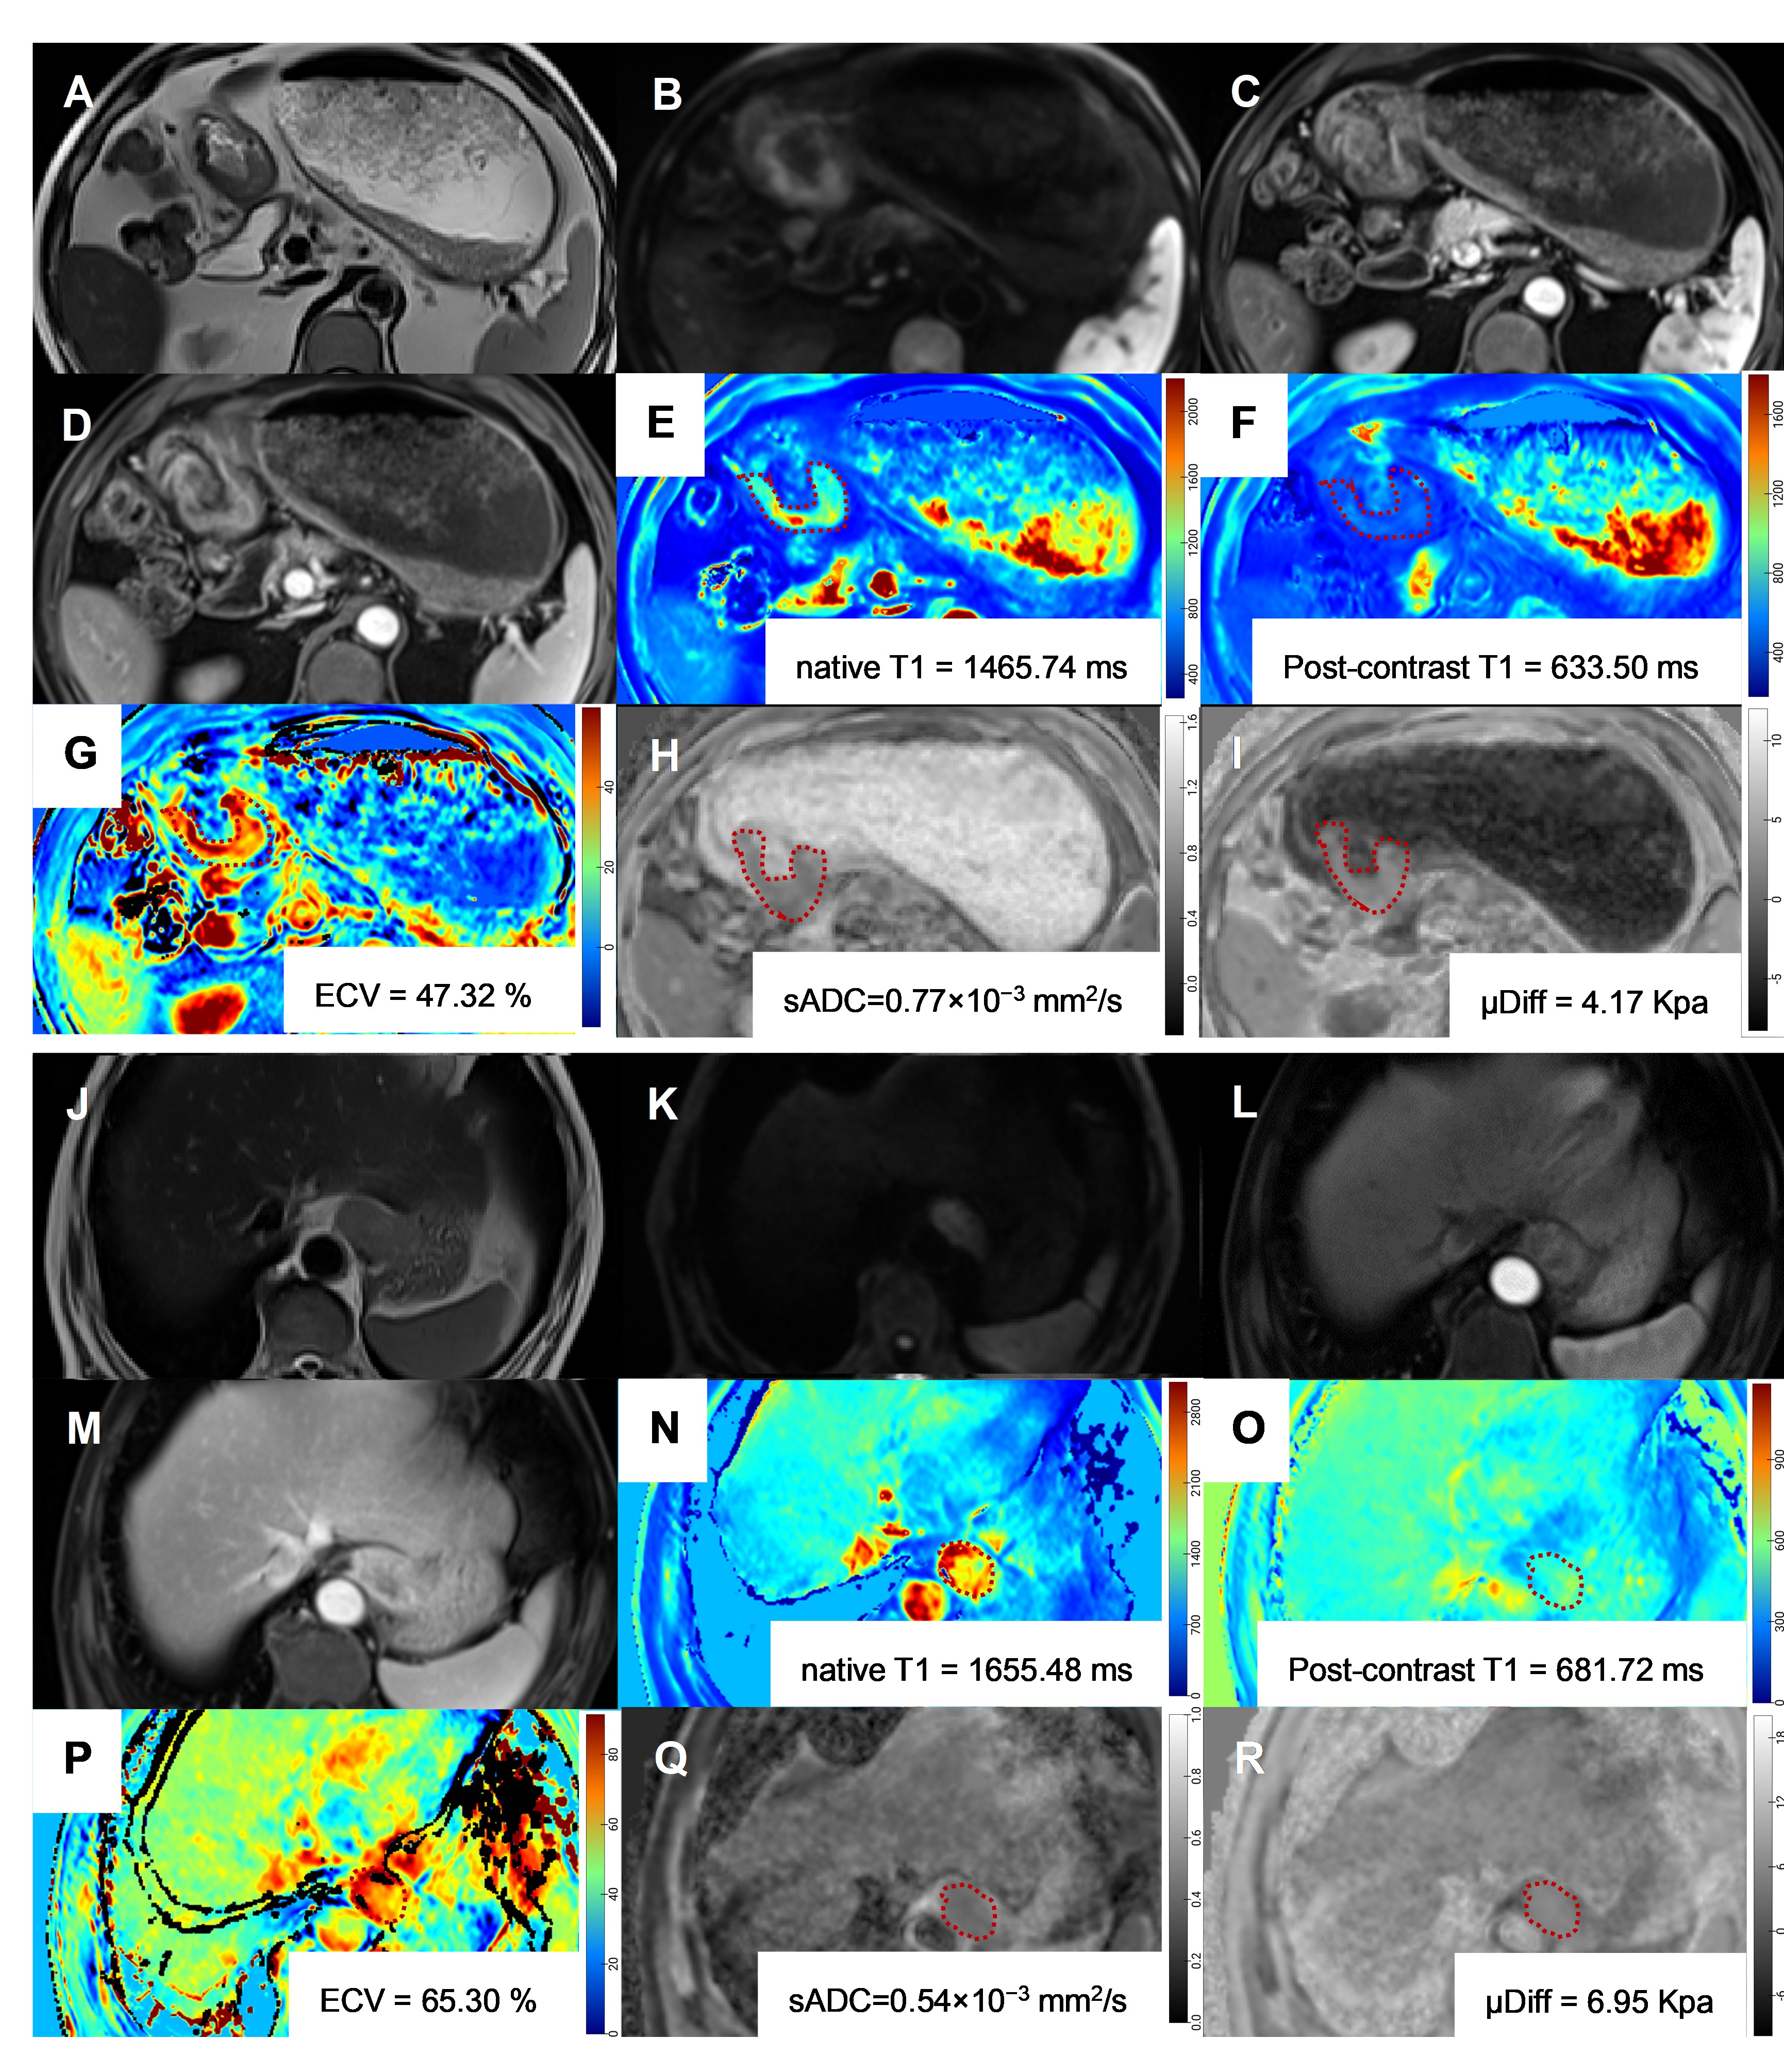
A total of 68 LAGC patients (43 males, 25 females; mean age: 57.01 ± 6.85 years) were finally enrolled. After gastrectomy, 44.12% were pathologic responders (TRG1-3) and 55.88% non-responders (TRG4-5). The patients’ clinical-pathological data are summarized in Table 1. Non-responders showed a higher tumor stage (p = 0.027) than responders. Statistical differences were observed for histopathological type, histological grade, and Lauren type between responders and non-responders (p < 0.05). The differences in the vMRE and ECV parameters between the two groups are listed in Table 2 and Figure 1A-E. Compared with non-responders, the Native T1, ECV, and μDiff values in responders were significantly lower (all p<0.05), whereas the sADC values were significantly higher in responders (p<0.05). Table 3 and Figure 1F-K summarize and displayed the predictive performance of the parameters for discriminating responders from non-responders. sADC and μDiff exhibited the highest predictive performance with an AUC of 0.833. Multivariate logistic regression analysis through the backward stepwise method revealed μDiff and ECV were independent predictors for pathologic response, and their combination could further improve predictive performance to an AUC to 0.968. Figure 2 illustrative examples of vMRE and ECV imaging for a responder and non-responder, respectively.Discussion
Predicting response to NAC is important for planning of surgical management and chemotherapy. We prospectively analyzed the predictive significant of baseline vMRE and ECV data of LAGC patients for pathological response prediction. Obvious stroma fibrosis is one of the features of gastric cancer. Stiffness is bio-mechanical characteristics of the tumor [8-10]. The increased μDiff (or stiffness) might cause by the fibroblasts proliferation and induce the changes of extracellular stroma component, which was related to chemoresistance [8]. Fibrosis can also lead to enlargement of the extracellular space due to the accumulation of matrix. ECV was reported to be significant correlated with gastric tumor infiltration pattern [16]. These may explain the relationship between ECV and treatment response.Conclusion
Tumor stiffness determined by vMRE and ECV exhibited good performances in predicting response to NAC and thus may be used to guide clinical treatment in LAGC patients.Acknowledgements
None.References
[1] Sung H, Ferlay J, Siegel RL, et al. Global Cancer Statistics 2020: GLOBOCAN Estimates of Incidence and Mortality Worldwide for 36 Cancers in 185 Countries. CA Cancer J Clin. 2021 May;71(3):209-249.
[2] Jiang D, Zhang L, Liu W, et al. Trends in cancer mortality in China from 2004 to 2018: A nationwide longitudinal study. Cancer Commun (Lond). 2021 Oct;41(10):1024-1036.
[3] Zhou J, Zheng R, Zhang S, et al. Gastric and esophageal cancer in China 2000 to 2030: Recent trends and short-term predictions of the future burden. Cancer Med. 2022 Apr;11(8):1902-1912.
[4] Ajani JA, D'Amico TA, Bentrem DJ, et al. Gastric Cancer, Version 2.2022, NCCN Clinical Practice Guidelines in Oncology. J Natl Compr Canc Netw. 2022 Feb;20(2):167-192.
[5] Wang XZ, Zeng ZY, Ye X, et al. Interpretation of the development of neoadjuvant therapy for gastric cancer based on the vicissitudes of the NCCN guidelines. World J Gastrointest Oncol. 2020 Jan 15;12(1):37-53.
[6] Li S, Yu W, Xie F, et al. Neoadjuvant therapy with immune checkpoint blockade, antiangiogenesis, and chemotherapy for locally advanced gastric cancer. Nat Commun. 2023 Jan 3;14(1):8.
[7] Stark AP, Ikoma N, Chiang YJ, et al. Characteristics and Survival of Gastric Cancer Patients with Pathologic Complete Response to Preoperative Therapy. Ann Surg Oncol. 2019 Oct;26(11):3602-3610.
[8] Lu Y, Jin Z, Hou J, et al. Calponin 1 increases cancer-associated fibroblasts-mediated matrix stiffness to promote chemoresistance in gastric cancer. Matrix Biol. 2023 Jan;115:1-15.
[9] Jang M, An J, Oh SW, et al. Matrix stiffness epigenetically regulates the oncogenic activation of the Yes-associated protein in gastric cancer. Nat Biomed Eng. 2021 Jan;5(1):114-123.
[10] Yang Y, Ma Y, Yan S, et al. CAF promotes chemoresistance through NRP2 in gastric cancer. Gastric Cancer. 2022 May;25(3):503-514.
[11] Guo J, Savic LJ, Hillebrandt KH, et al. MR Elastography in Cancer. Invest Radiol. 2023 Aug 1;58(8):578-586.
[12] Park SJ, Yoon JH, Lee DH, et al. Tumor Stiffness Measurements on MR Elastography for Single Nodular Hepatocellular Carcinomas Can Predict Tumor Recurrence After Hepatic Resection. J Magn Reson Imaging. 2021 Feb;53(2):587-596.
[13] Manduca A, Bayly PJ, Ehman RL, et al. MR elastography: Principles, guidelines, and terminology. Magn Reson Med. 2021 May;85(5):2377-2390.
[14] Kromrey ML, Le Bihan D, Ichikawa S, et al. Diffusion-weighted MRI-based Virtual Elastography for the Assessment of Liver Fibrosis. Radiology. 2020 Apr;295(1):127-135.
[15] Treiber J, Novak D, Fischer-Rasokat U, et al. Regional extracellular volume within late gadolinium enhancement-positive myocardium to differentiate cardiac sarcoidosis from myocarditis of other etiology: a cardiovascular magnetic resonance study. J Cardiovasc Magn Reson. 2023 Feb 9;25(1):8.
[16] Nishimuta Y, Tsurumaru D, Kai S, et al. Extracellular volume fraction determined by equilibrium contrast-enhanced computed tomography: correlation with histopathological findings in gastric cancer. Jpn J Radiol. 2023 Jul;41(7):752-759.
[17] Noid G, Godfrey G, Hall W, et al. Predicting Treatment Response From Extracellular Volume Fraction for Chemoradiation Therapy of Pancreatic Cancer. Int J Radiat Oncol Biol Phys. 2023 Mar 1;115(3):803-808.
[18] Derieux S, Svrcek M, Manela S, et al. Evaluation of the prognostic impact of pathologic response to preoperative chemotherapy using Mandard's Tumor Regression Grade (TRG) in gastric adenocarcinoma. Dig Liver Dis. 2020 Jan;52(1):107-114.
Figures