0194
Three-dimensional MR Elastography Identifies Portal Hypertension in Cirrhosis: A Prospective Multicenter Study1Department of Radiology, Shengjing Hospital of China Medical University, Shenyang, Liaoning, China
Synopsis
Keywords: Liver, Elastography
Motivation: Hepatic venous pressure gradient (HVPG) is the gold standard for diagnosing portal hypertension, but it is invasiveness, cost, and feasibility.
Goal(s): To develop a non-invasive model based on Three-dimensional (3D) MR elastography (3D-MRE) to detect portal hypertension.
Approach: Spearman correlation analysis between 3D-MRE parameters and HVPG; Multivariable linear regression analysis between mechanical parameters and HVPG; Logistic regression analysis and establish a model to diagnose portal hypertension.
Results: 3D-MRE is a non-invasive, rapid, and highly accurate tool for predicting portal hypertension. Especially Spleen stiffness at 60Hz was the independent parameters associating HVPG.
Impact: This indicates that the use of 3D-MRE can provide more personalized evaluation and better medical experience for patients with cirrhosis and provides a new method for non-invasive diagnosis of portal hypertension.
Introduction
Hepatic venous pressure gradient (HVPG) measurement is considered the most reliable way to evaluate portal hypertension (PH) in cirrhosis. Developing a non-invasive model to diagnose the severity of PH, particularly to diagnose clinically significant portal hypertension (CSPH, HVPG>10mmHg), is crucial because HVPG measurement, which is currently the gold standard, is an invasive procedure. Three-dimensional (3D) MR elastography (3D-MRE) can measure viscoelastic parameters for both liver and spleen, which correlates with the severity of liver fibrosis and showed great potential for evaluating PH. However, there is currently a paucity of literature regarding the evaluation of HVPG using 3D-MRE. The existing studies are limited to single-center investigations with a small sample size, thus lacking robust evidence to support its widespread use. Hence, this study aimed to develop multivariate models based on 3D-MRE to determine portal hypertension using HVPG as the gold standard from multicenters.Method
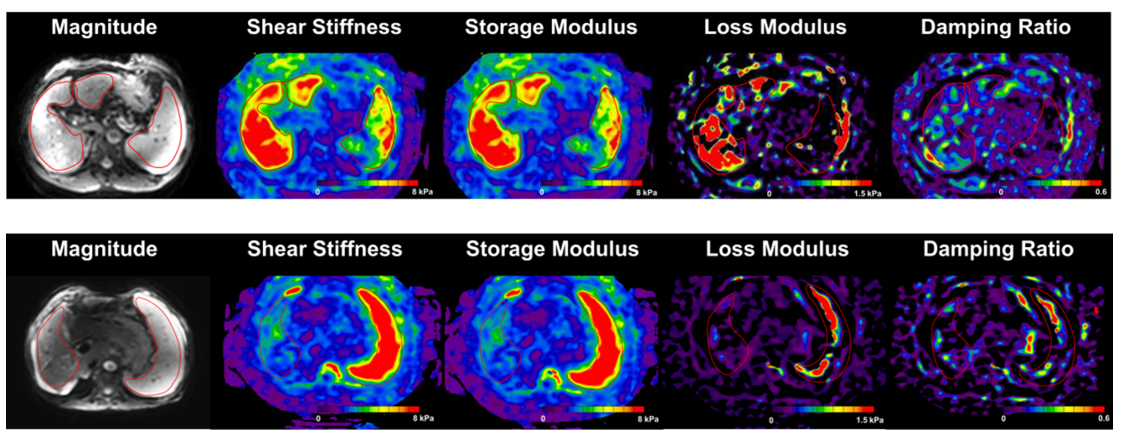
This study enrolled patients with cirrhosis scheduled for HVPG, and who intended to undergo MR imaging (including 3D-MRE and diffusion-, T1-, and T2-weighted imaging) within one month before the HVPG procedure. A total of 57 patients were recruited from five institutions . MRE was performed at both 60 Hz and 30 Hz using Spin Echo Echo Planar Imaging (GE3.0T Signa Excite HD) ,TR/TE=1333.76/38. Multiple viscoelastic parameters of the liver and spleen were evaluated independently by two radiologists. Univariable and multivariable linear regression analyses were conducted to assess the associations between mechanical parameters and HVPG. Univariable and multivariable logistic regression analyses were used to predict clinically significant portal hypertension (CSPH, HVPG>10mmHg) and severe portal hypertension (SPH, HVPG>12mmHg), respectively.Result
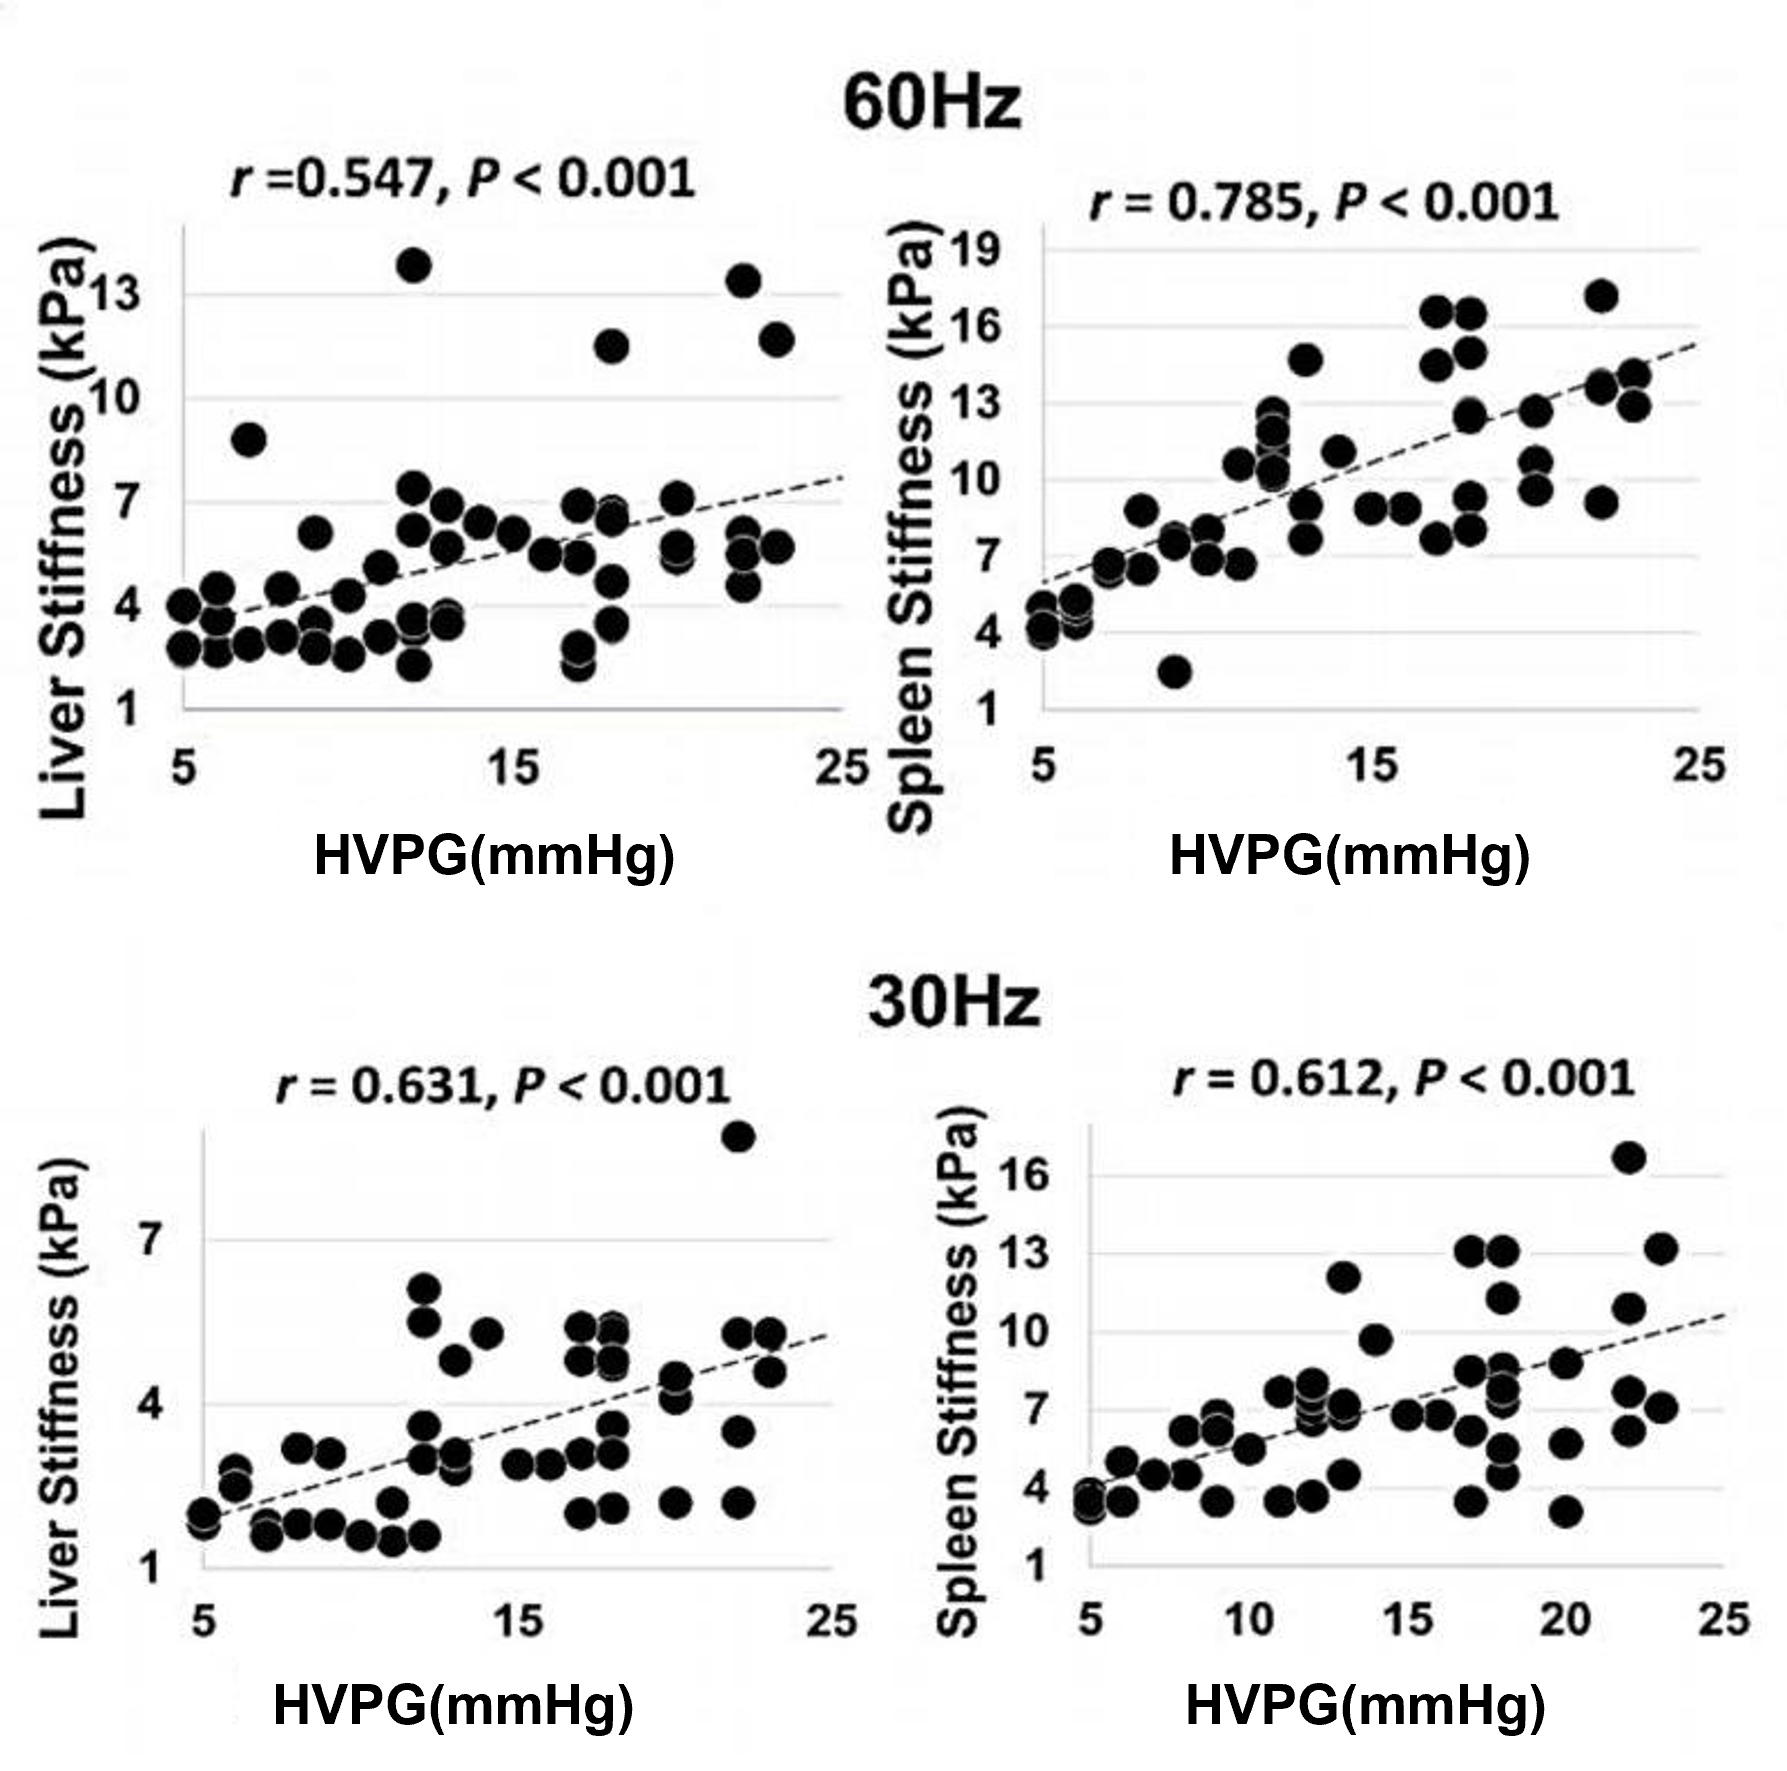
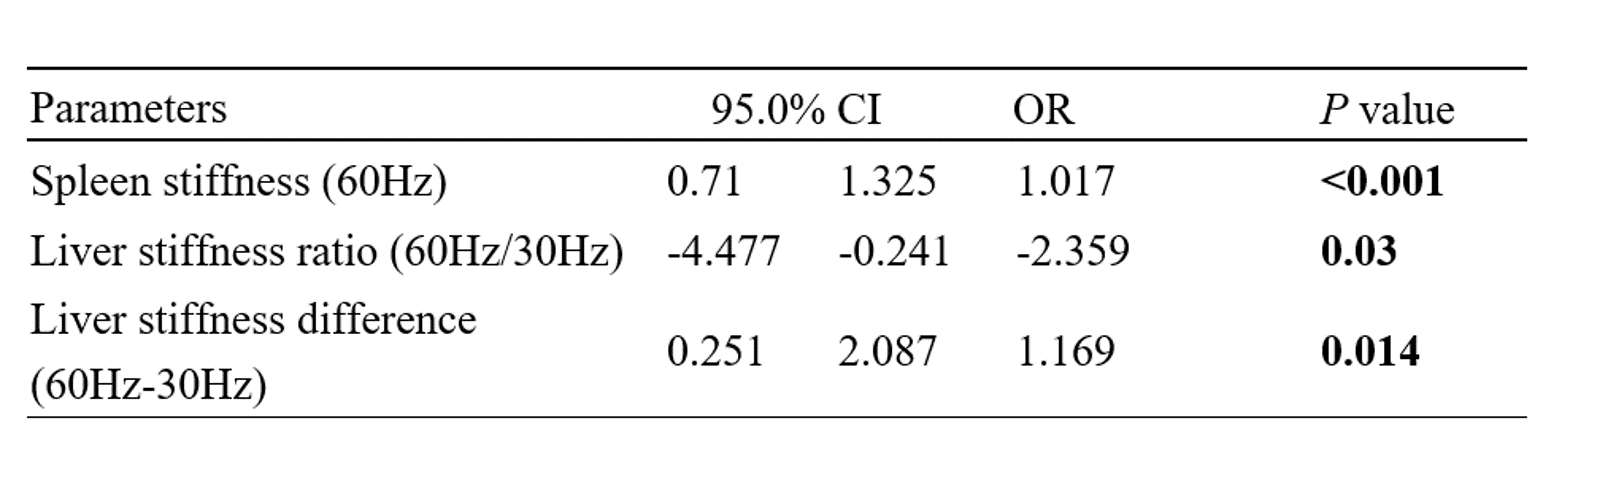
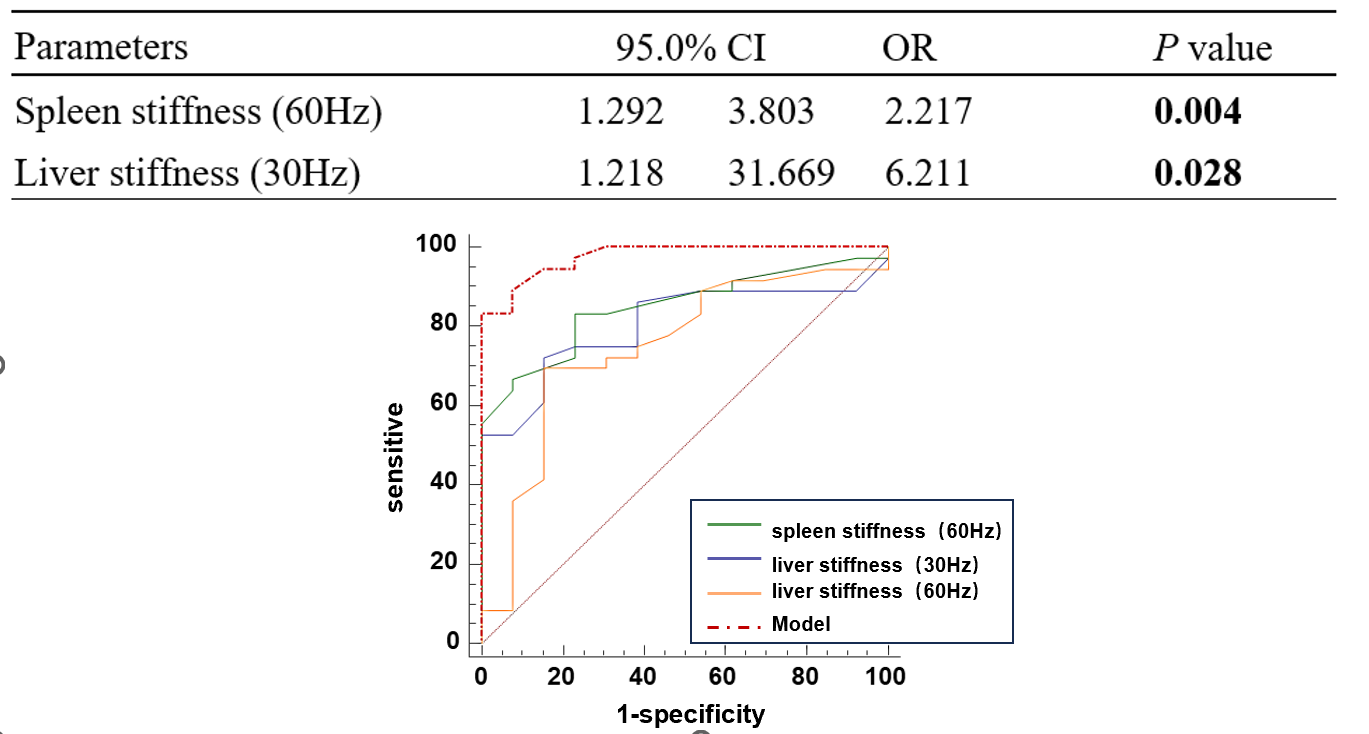
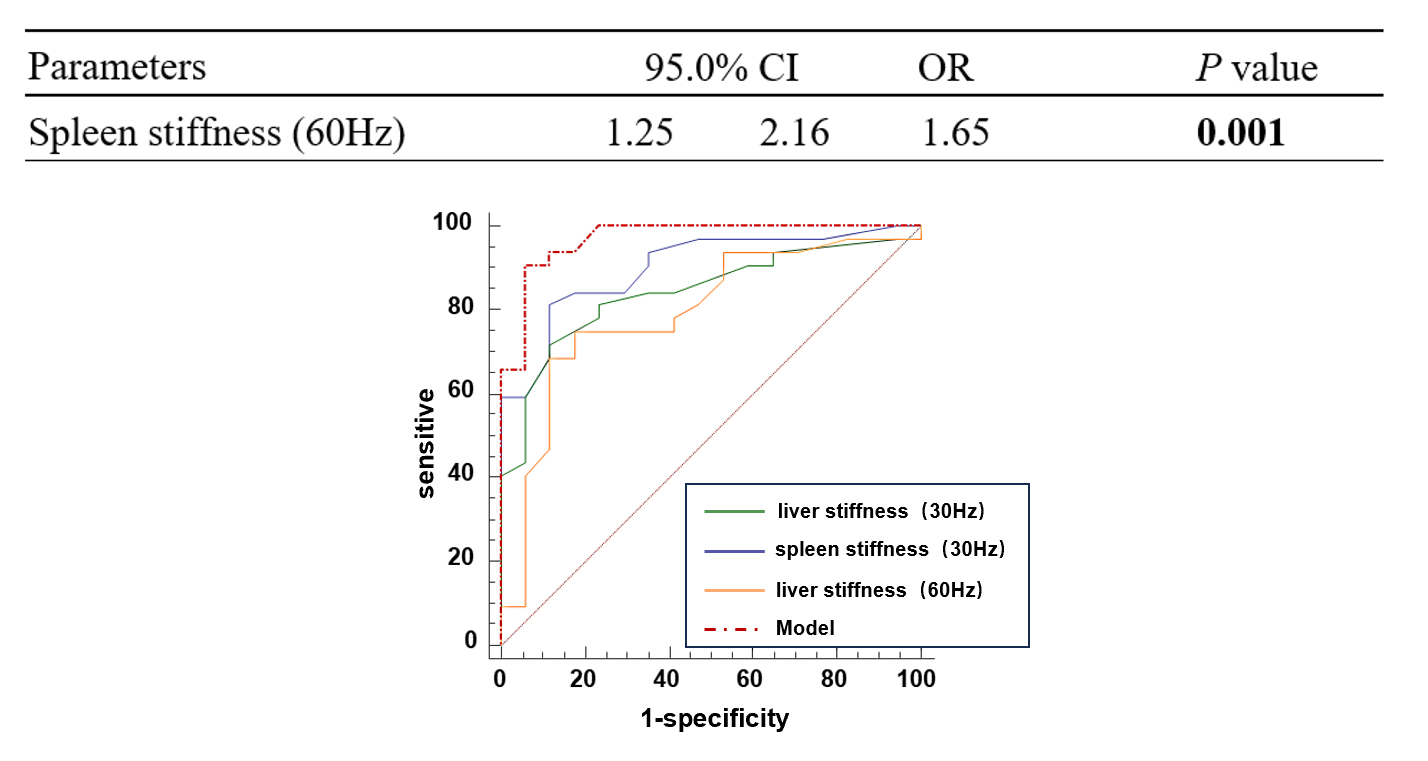
HVPG showed the strongest positive correlation with splenic stiffness at 60Hz (r = 0.785; P < .001), followed by hepatic stiffness at 30Hz (r = 0.631; P < .001), splenic stiffness at 30Hz (r = 0.612; P < .001), hepatic stiffness at 60Hz (r = 0.547; P < .001). Multiple linear regression analysis showed that splenic SS at 60Hz (β = 1.017; 95% CI: 0.71, 1.325; P < .001), liver stiffness ratio (β =-2.359; 95% CI: -4.477, -0.241; P = .03), and liver stiffness difference (β =1.169; 95% CI:0.251,2.087; P = .014) was the independent factors determining HVPG. Approximately 56.5% of the total variability in HVPG was explained by these 3 variables (adjusted R2 = 0.565, P < .001). Logistic regression analysis showed that splenic SS at 60Hz (OR = 2.217 [95% CI:1.292, 3.803]; P = 0.004) and liver SS at 30Hz (OR =6.211 [95% CI: 1.218, 31.669]; P= 0.028) were independently associated with CSPH, establishing a model with excellent performance in diagnosing CSPH (area under the receiver operating characteristic curve [AUC], 0.975 [95% CI: 0.79, 0.99]). As for SPH, it showed that splenic SS at 60Hz (OR = 1.65 [95% CI:1.25,2.16]; P = .001) were independently associated with HVPG, also with better performance (AUC, 0.969 [95% CI: 0.81, 0.98]).Conclusion
3D-MRE with dual frequencies is a very promising method in both predicting HVPG and diagnosing the presence CSPH and SPH. Splenic stiffness at 60Hz, combining liver stiffness ratio (60Hz/30Hz) and differences (60Hz-30Hz), was the independent parameters associating HVPG.Acknowledgements
No acknowledgement found.References
Liver cirrhosis[J/OL]. The Lancet, 2021, 398(10308): 1359-1376. DOI:10.1016/S0140-6736(21)01374-X.
Shi Y, Qi YF, Lan GY, Wu Q, Ma B, Zhang XY, Ji RY, Ma YJ, Hong Y. Three-dimensional MR Elastography Depicts Liver Inflammation, Fibrosis, and Portal Hypertension in Chronic Hepatitis B or C. Radiology. 2021 Oct;301(1):154-162. doi: 10.1148/radiol.2021202804. Epub 2021 Aug 10. PMID: 34374594; PMCID: PMC8475654.
Shin SU, Lee JM, Yu MH, Yoon JH, Han JK, Choi BI, Glaser KJ, Ehman RL. Prediction of esophageal varices in patients with cirrhosis: usefulness of three-dimensional MR elastography with echo-planar imaging technique. Radiology. 2014 Jul;272(1):143-53. doi: 10.1148/radiol.14130916. Epub 2014 Mar 9. PMID: 24620910; PMCID: PMC4263640.
Qi X, Berzigotti A, Cardenas A, Sarin SK. Emerging non-invasive approaches for diagnosis and monitoring of portal hypertension. Lancet Gastroenterol Hepatol. 2018 Oct;3(10):708-719. doi: 10.1016/S2468-1253(18)30232-2. PMID: 30215362.
de Franchis R, Bosch J, Garcia-Tsao G, Reiberger T, Ripoll C; Baveno VII Faculty. Baveno VII - Renewing consensus in portal hypertension. J Hepatol. 2022 Apr;76(4):959-974. doi: 10.1016/j.jhep.2021.12.022. Epub 2021 Dec 30. Erratum in: J Hepatol. 2022 Apr 14;: PMID: 35120736.
Figures