0193
Multi-b values DWI-based Virtual High-resolution MR Elastography and Validation on Liver Fibrosis and Inflammation Prediction1Human Phenome Institute, Fudan university, Shanghai, China, 2Shanghai Jiao Tong University School of Medicine, Shanghai, China, 3Institute of Science and Technology for Brain-Inspired Intelligence, Fudan University, Shanghai, China, 4Simens Healthineers Ltd, Shanghai, China
Synopsis
Keywords: Liver, Liver, DWI, MRE, Liver fibrosis, RegGAN, CBAM
Motivation: Liver biopsy is the standard clinical approach for diagnosing liver fibrosis. However, its invasiveness and possibility of sampling errors impose inherent limitations.
Goal(s): To evaluate the reproducibility and reliability of the virtual MRE based on DWI and compare it with MRE to assess its efficiency in diagnosing liver fibrosis.
Approach: RegGAN was employed to forecast MRE and rectify the outcomes. And CBAM was utilized to quantify the influence of diverse b-values in DWI.
Results: RegGAN-CBAM demonstrates favorable performance in both image and stiffness prediction of MRE. The liver fibrosis grading based on stiffness predictions demonstrates a high level of accuracy and sensitivity.
Impact: The prediction methodology of 3D MRE based on DWI exhibits a notable level of diagnostic efficiency and reliability. This approach serves as a non-invasive method with practical applicability in the clinical assessment of liver fibrosis.
Introduction
Chronic liver diseases (CLD) could progress to severe fibrosis without early and effective treatment [1]. There is an urgent need to develop non-invasive methods for staging liver fibrosis and inflammation [2].Up to date, several alternative imaging techniques have been widely developed, especially Magnetic Resonance elastography (MRE), which reflected the property of tissues in different facets [3]. MRE demonstrates substantial clinical significance in the assessment of fibrosis [4]. However, the limited accessibility of MRE equipment necessitates the development of virtual MRE techniques [5].
In this regard, we propose a registration-based generative adversarial network (RegGAN-CBAM) [6,7] to assess the reproducibility and reliability of the multi-b-value DWI-based 3D MRE approach.
Methods
Study PopulationThis retrospective study was approved by the institutional review board. Furthermore, the informed consent requirement was waived for this retrospective study. Between June 2020 and February 2022, a total of 258 consecutive CLD patients (≥18 years) who simultaneously underwent MRI in the abdomen, including DWI and MRE sequences were enrolled in this study.
DWI and MRE Acquisition
DWI and MRE sequences were performed at 1.5 T scanner (Magnetom Aera, Siemens, Erlangen, Germany). All patients were fasted for a minimum of 4 hours prior to MRE examination. DWI and MRE were acquired using a single-shot, spin-echo echo-planar imaging sequence with flow-compensated motion-encoding gradients (MEGs).
RegGAN-CBAM model
Figure.1 shows the flowchart of model. The datasets were randomized into 2 independent groups for model development (70%) and testing (30%). The development group was further divided into training (60%) and validation (10%) datasets. Deep learning models were blinded to the test group. The model training parameters were set with epoch = 200 and learning rate = 0.0001. Additionally, the registration module functions as a label noise model to refine the generated results. And CBAM outputs weights for the 13 channels (corresponding to the 13 b-values: 0, 10, 20, 40, 80, 120, 200, 400, 600, 800, 1200, 1600, 2000 s/mm2), enabling the calculation of the influence of different b-values in DWI.
Model Evaluation
The virtual MRE is evaluated using three metrics: mean absolute error (MAE), peak signal-to-noise ratio (PSNR), and structural similarity index (SSIM). Statistical analysis was conducted to measure liver stiffness using native MRE and virtual MRE (Figure.3). Spearman's correlation test was applied to assess the correlation of liver regions (Figure.3a). A Bland-Altman plot was constructed to assess the consistency of liver stiffness between native and virtual MRE (Figure.3b). Moreover, in order to provide a visual representation of the liver stiffness, box plots were constructed, as well as the predicted fibrosis grading outcomes (F0-3 and F4) (Figure.3c and 3d).
Results
Image comparisonFigure.2 presents the comparative results of DWI, virtual MRE (epoch = 80), and native MRE. The colorbar visualizes the numerical range corresponding to virtual and native MRE. It is evident that virtual and native MRE exhibit a remarkable level of concordance in terms of their enhancement values.
Model score
The comprehensive scores are presented in Table.1, including training set, validation set, and test set. Particularly, in the test set, the MAE was 0.055, the PSNR reached 31.395, and the SSIM reached 0.556.
Statistical analysis
In Figure.3a, a strong positive correlation was observed between native and virtual MRE liver stiffness (r = 0.843, p < 0.01). In Figure.3b, the mean difference line represented an average deviation of 0.314 between the two liver stiffness. The upper and lower limit lines, corresponding to the 96% limits of agreement, were 0.948 and -0.320, indicating a strong agreement between the two modalities.
ROC comparative analysis
In the ROC comparative analysis (Figure.3e), the virtual MRE liver stiffness exhibited a higher level of accuracy with an AUC of 0.898, surpassing that of native MRE (0.878). The virtual MRE demonstrated a sensitivity of 71.43% and a specificity of 100%, as presented in Table.2.
Channel weight
Figure.3f presents the channel weight maps associated with 13 b-values utilized in the DWI protocol. Evidently, the b1600 exhibits the most substantial weight, followed by b600 and b400, signifying their pivotal role in the generation of the virtual MRE.
Discussion
This study demonstrates that RegGAN-CBAM performs well in the prediction of 3D MRE. The virtual MRE displays notable similarity to native MRE in images, and their liver stiffness exhibit high correlation and consistency. Moreover, the liver fibrosis grading based on stiffness predictions demonstrates high accuracy and sensitivity. The channel weights in the selection of b-values with significant contributions.Conclusion
The 3D MRE approach based on DWI demonstrates high diagnostic efficiency and reliability, serving as a non-invasive method for diagnosing liver fibrosis with practical application value in clinical setting.Acknowledgements
This study was supported in part by the National Natural Science Foundation of China (No. 62001120, 62331021), The Royal Society (IEC\NSFC\211235) and the Shanghai Sailing Program (No. 20YF1402400, 22YF1409300).The correspondence should be sent to Prof. Chengyan Wang (Email:wangcy@fudan.edu.cn)
References
[1] Kromrey M L, Le Bihan D, Ichikawa S, et al. Diffusion-weighted MRI-based virtual elastography for the assessment of liver fibrosis[J]. Radiology, 2020, 295(1): 127-135.
[2] Pollack B L, Batmanghelich K, Cai S S, et al. Deep learning prediction of voxel-level liver stiffness in patients with nonalcoholic fatty liver disease[J]. Radiology: Artificial Intelligence, 2021, 3(6): e200274.
[3] Pepin K M, Welle C L, Guglielmo F F, et al. Magnetic resonance elastography of the liver: everything you need to know to get started[J]. Abdominal radiology, 2022: 1-21.
[4] Cunha G M, Delgado T I, Middleton M S, et al. Automated CNN–Based Analysis Versus Manual Analysis for MR Elastography in Nonalcoholic Fatty Liver Disease: Intermethod Agreement and Fibrosis Stage Discriminative Performance[J]. American Journal of Roentgenology, 2022, 219(2): 224-232.
[5] Yao Z, Luo T, Dong Y J, et al. Virtual elastography ultrasound via generative adversarial network for breast cancer diagnosis[J]. Nature Communications, 2023, 14(1): 788.
[6] Kong L, Lian C, Huang D, et al. Breaking the dilemma of medical image-to-image translation[J]. Advances in Neural Information Processing Systems, 2021, 34: 1964-1978.
[7]Woo S, Park J, Lee J Y, et al. Cbam: Convolutional block attention module[C]//Proceedings of the European conference on computer vision (ECCV). 2018: 3-19.
Figures
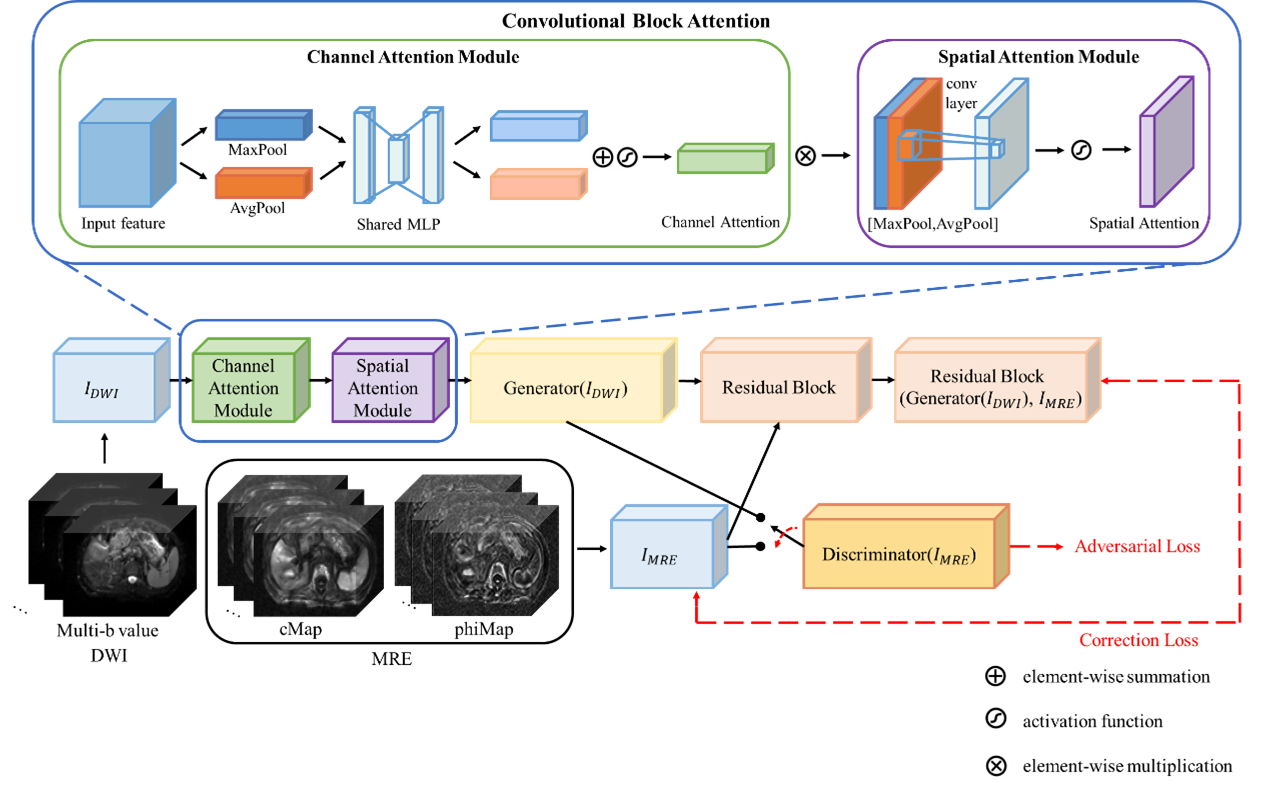
Figure 1.Flowchart of the RegGAN-CBAM model.
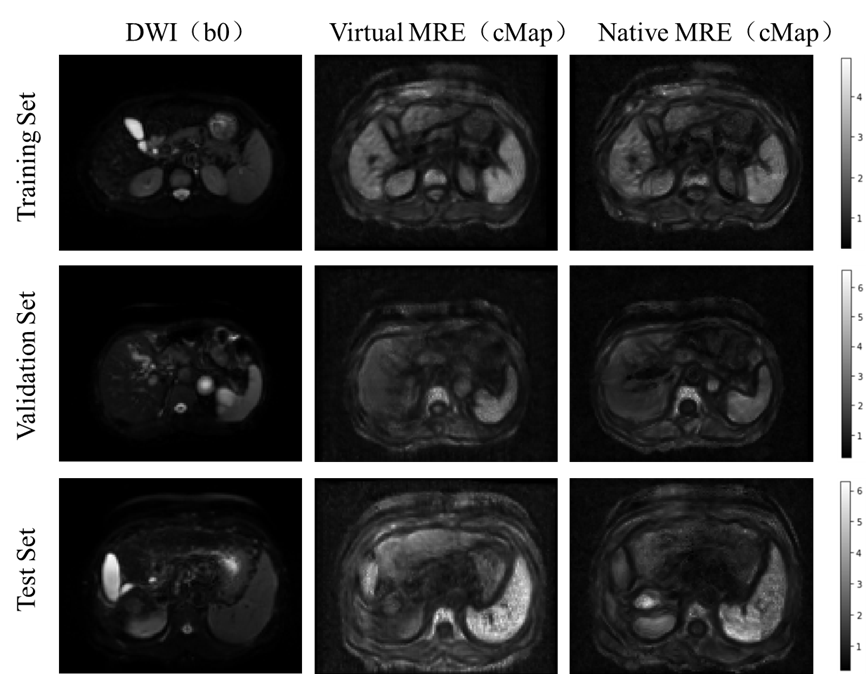
Figure 2. Representative cases of DWI (b0), virtual MRE (cMap), and native MRE (cMap) images in the training set, validation set, and test set.The colorbar is positioned on the right side of the image to represent the numerical range of virtual and native MRE (cMap). It is evident that virtual and native MRE (cMap) demonstrate a high level of consistency in terms of their numerical values.
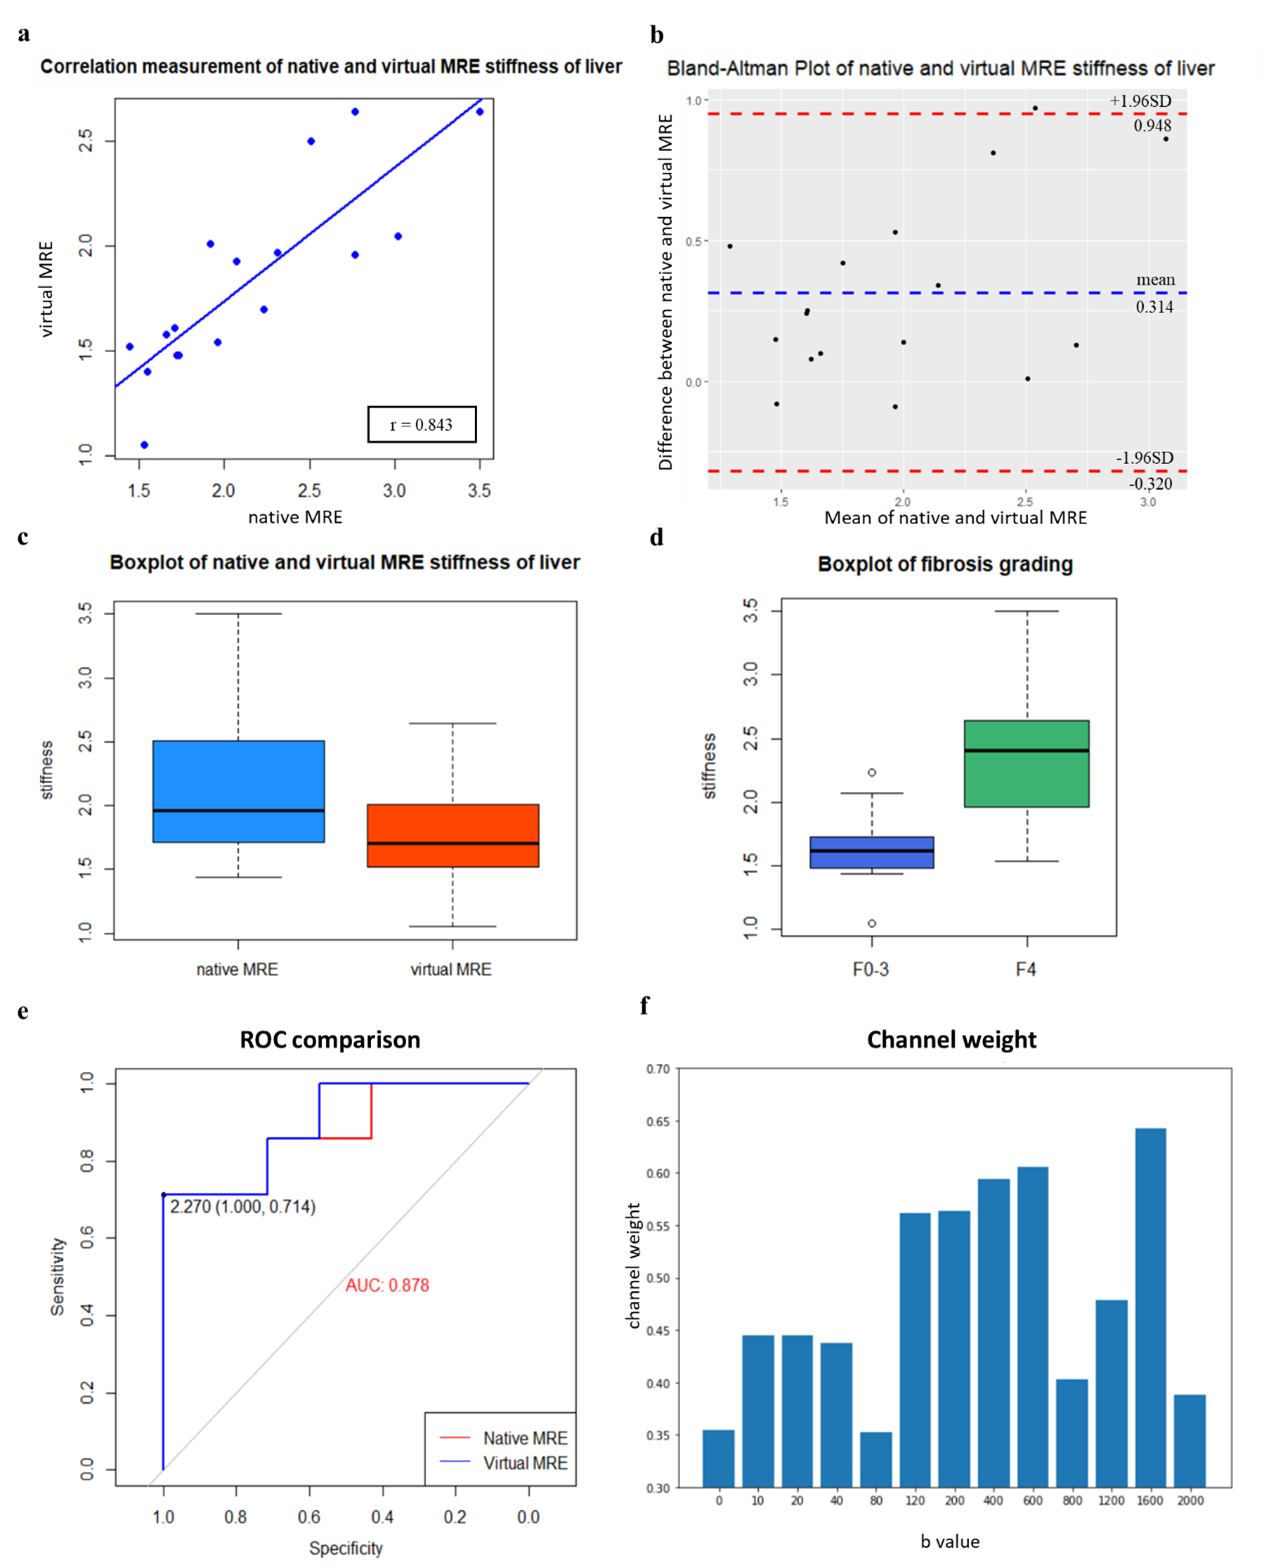
Figure 3. Statistical analysis,including(a) Correlation analysis of native and virtual MRE stiffness of liver, (b) Bland-Altman Plot of native and virtual MRE stiffness of liver, (c) Boxplot of native and virtual MRE stiffness of liver, (d) Boxplot of fibrosis grading, (e) ROC comparison and (f) Channel weight.