0192
Predicting VETC in Hepatocellular Carcinoma Using Radiomic Features from Peritumoral Mechanical Strain Assessed by MR Elastography1Radiology, Mayo Clinic, Rochester, MN, United States, 2The Third Affiliated Hospital of Sun Yat-Sen University, Guangzhou, China, 3Physiology and Biomedical Engineering, Mayo Clinic, Rochester, MN, United States
Synopsis
Keywords: Liver, Liver, MRI, MR Elastography (MRE), HCC, VETC, Radiomics, texture features
Motivation: Vessels encapsulating tumor clusters (VETC) is a powerful indicator of aggressive Hepatocellular carcinoma (HCC) associated with recurrence, which is expected to be noninvasively identified using imaging techniques.
Goal(s): This study aims to develop a potential mechanical biomarker utilizing radiomics features extracted from MR Elastography (MRE)-assesed peritumoral shear strain to predict VETC in HCC.
Approach: Radiomics features were extracted from the tumor boundary on an octahedral shear strain (OSS) map. Feature selection techniques were used to identify relevant features to construct a radiomics score.
Results: Three radiomics features were utilized to construct a radiomics score, demonstrating potential for MRE-based strain analysis in predicting VETC.
Impact: A radiomics score constructed by radiomics features derived from MRE-based strain analysis in the peritumoral region show promise in predicting VETC in HCC patients. This study results show non-invasive VETC prediction potential in HCC, impacting personalized treatment and patient outcomes.
Introduction
Hepatocellular carcinoma (HCC) is a primary liver cancer with a high risk of recurrence1,2. Recent studies have identified a pathological characteristic in HCC known as vessels encapsulating tumor clusters (VETC) of HCC. This vascular growth pattern features endothelium-encapsulated tumor clusters that can be directly released into circulation, potentially affecting patient recurrence rates and survival3,4. However, the assessment of VETC currently relies on pathological evaluation of resected specimens. Non-invasive assessment of VETC using imaging techniques may aid in the development of individual treatment plans for patients with VETC. A shear strain mapping technique based on MR elastography (MRE) has shown promise in evaluating the mechanical properties of HCC and predicting VETC5-7. The potential of radiomics in tissue characterization, cancer diagnosis, staging, and treatment effectiveness evaluation, has been increasingly recognized in liver malignancies8,9. This study aims to develop a potential mechanical biomarker utilizing radiomics features extracted from MRE-assesed peritumoral shear strain to predict VETC in HCC.Methods
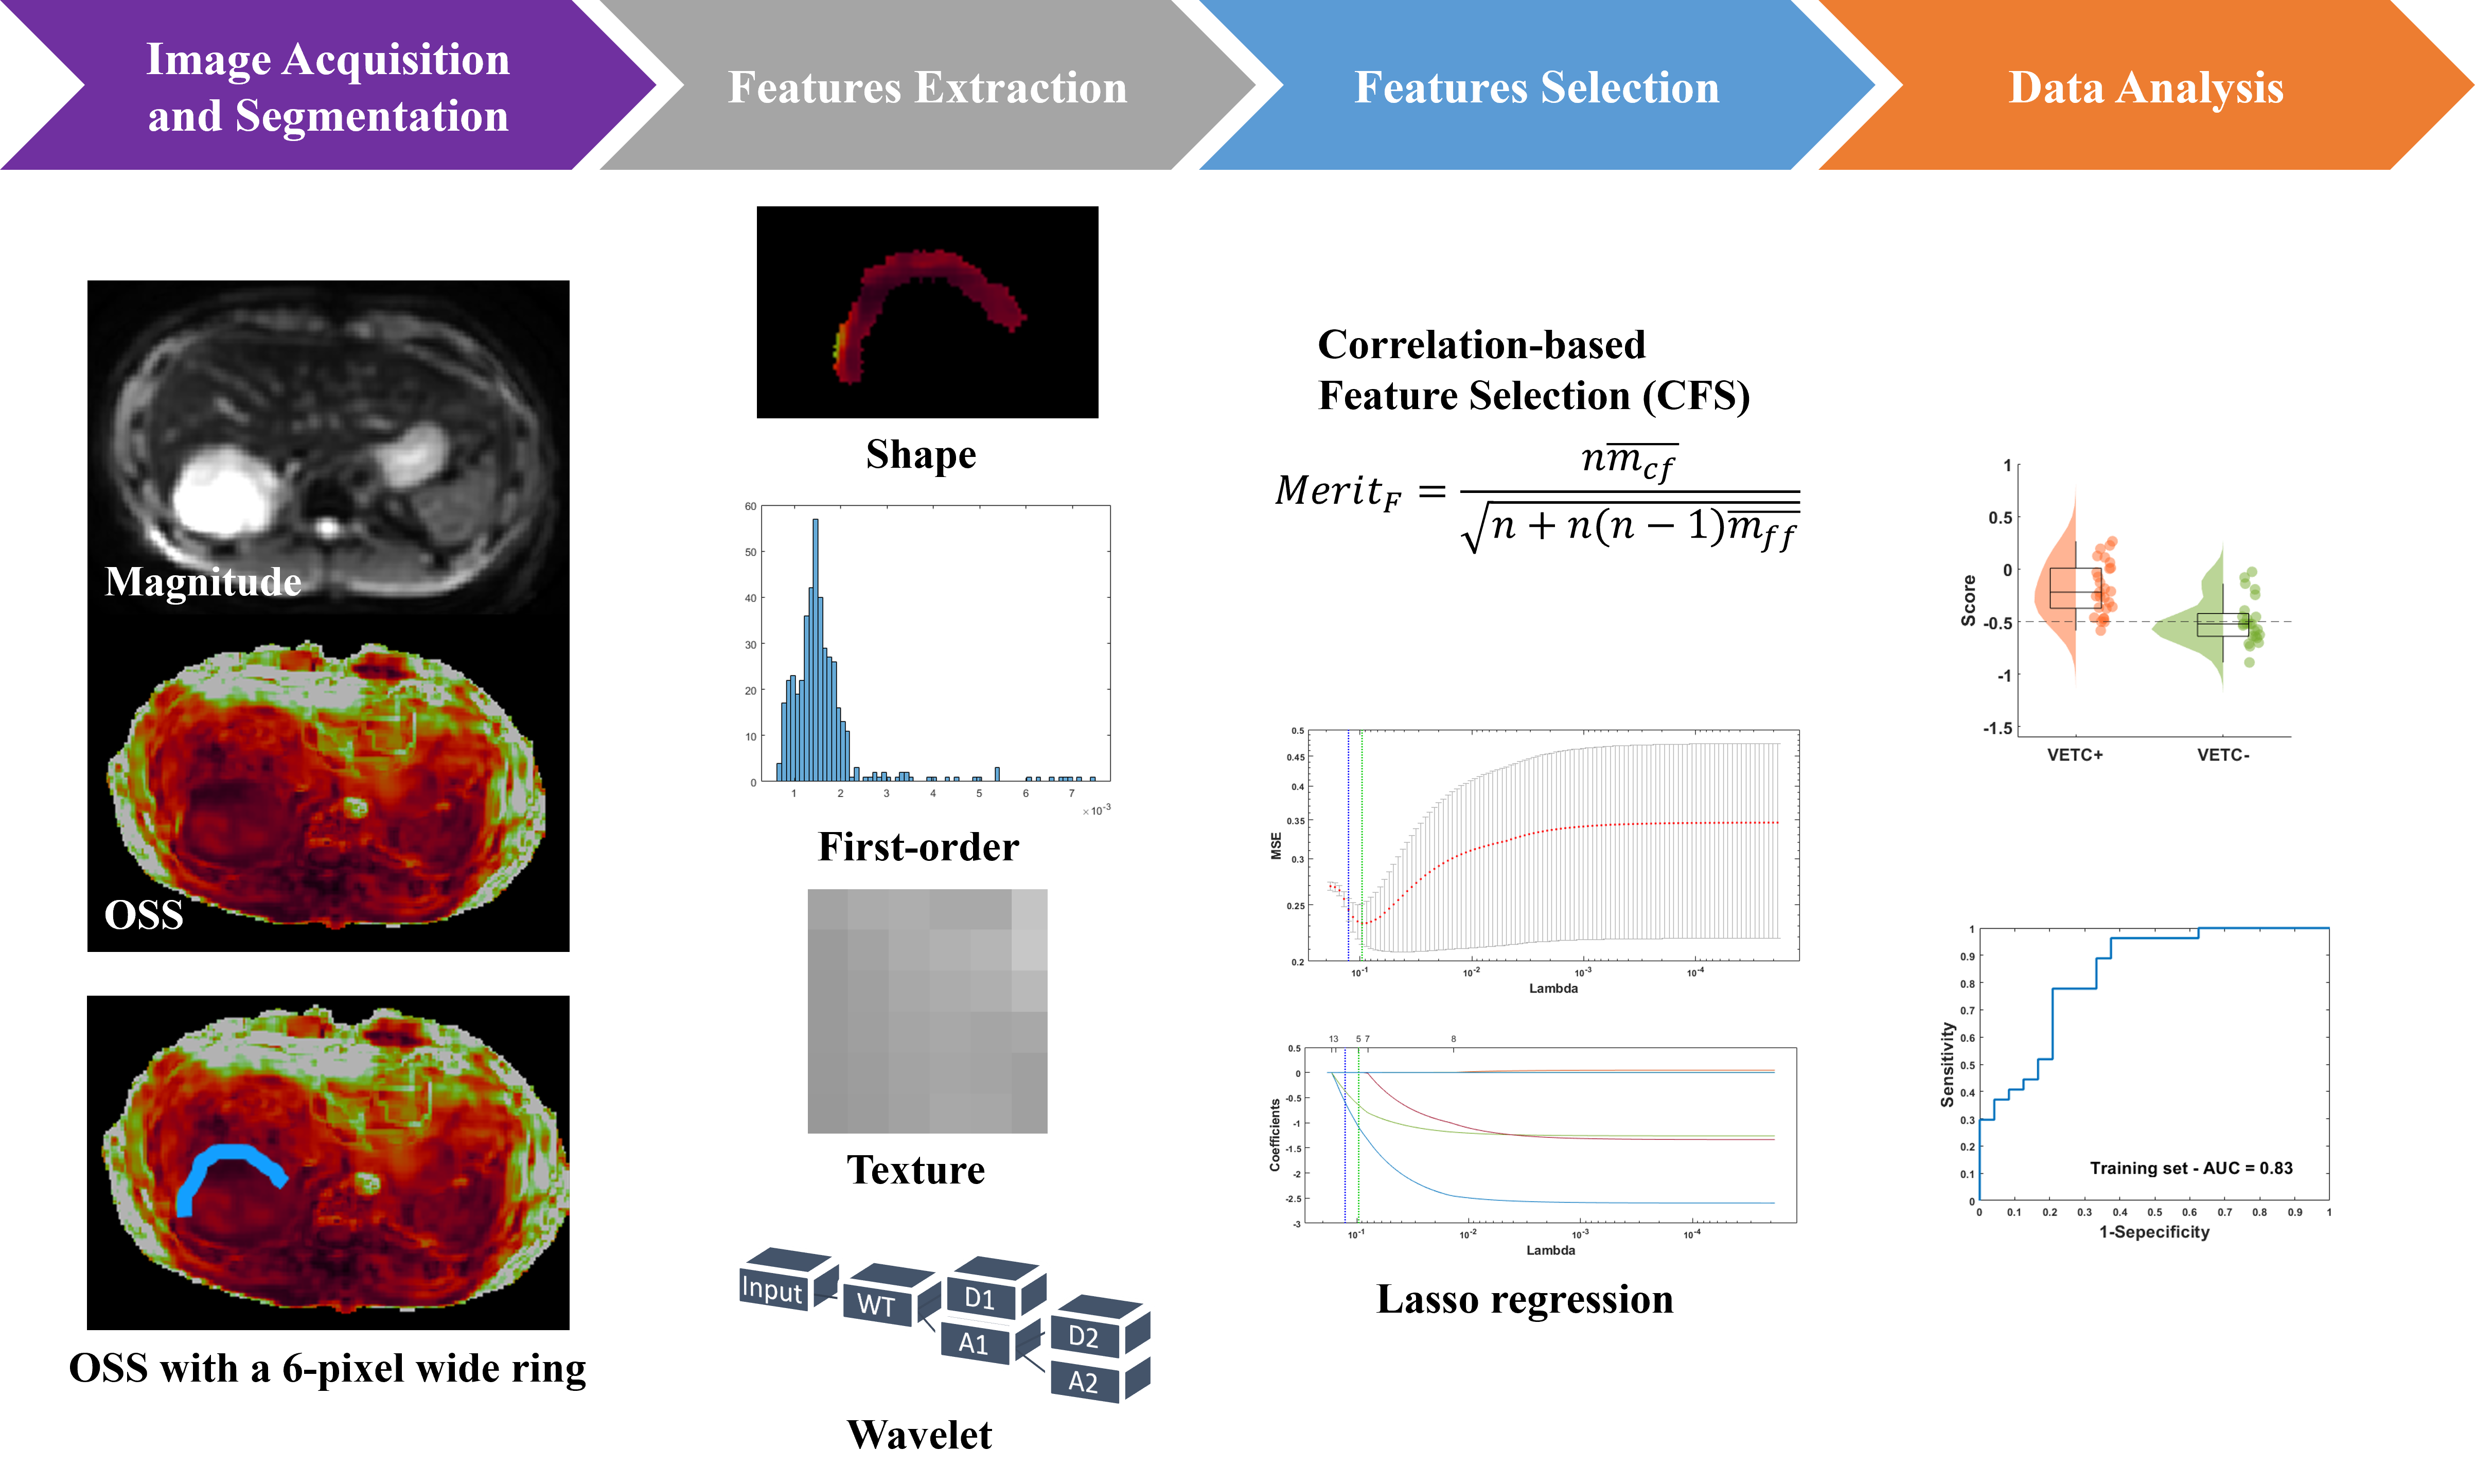
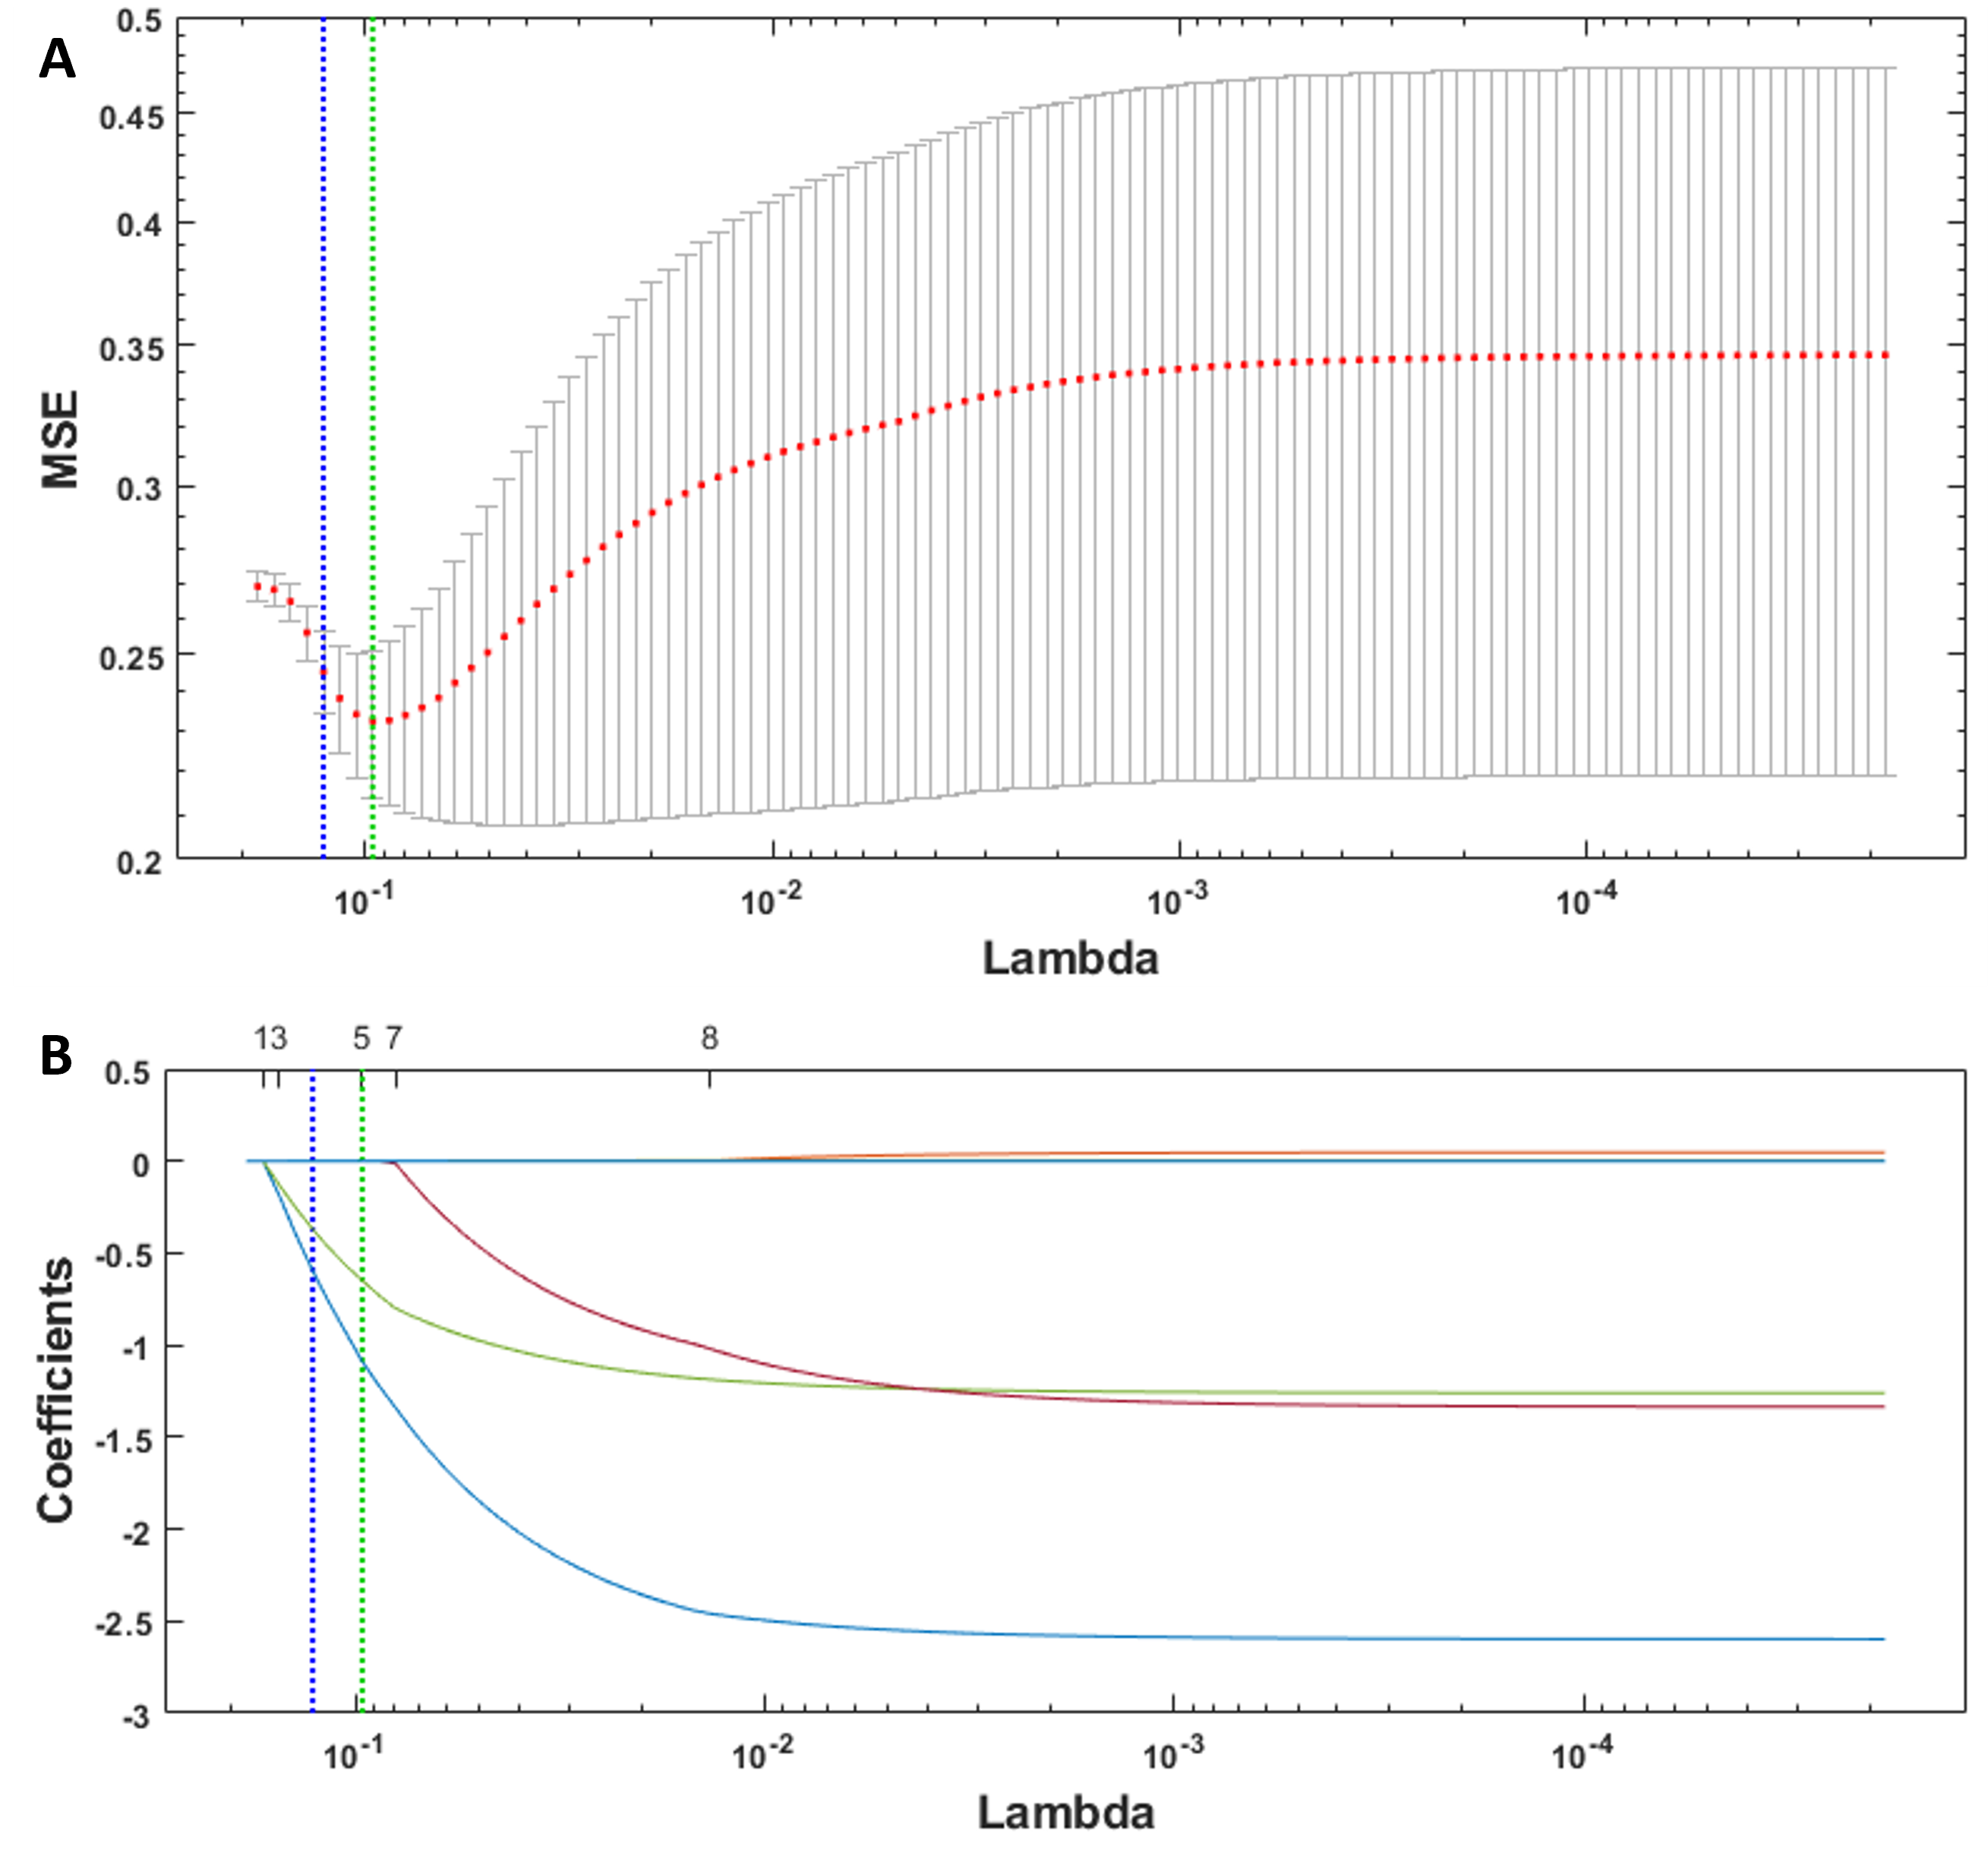
With IRB approval and after obtaining written informed consent, 64 patients meeting these criteria were enrolled in this retrospective study: (1) preoperative 3D MRI/MRE, (2) histopathologically confirmed diagnosis of HCC within one month following MRE, (3) no prior HCC treatment, and (4) tumor size > 2 cm. Histopathological analyses were conducted by an experienced liver pathologist, the VETC pattern was defined as the presence of sinusoidal vessels forming mesh-like networks that encapsulate individual tumor clusters in the entire or partial tumor when imaged with CD34 immunostaining10. Tumor segmentation was performed by an experienced radiologist. Out of 64 patients, 33 were VETC$$$+$$$ and 31 were VETC $$$-$$$ . The patient cohort was split into a 51-patient training set (27 VETC$$$+$$$/24 VETC$$$-$$$) and a 13-patient testing set (6 VETC$$$+$$$/7 VETC$$$-$$$). Tumor ROIs were manually delineated along the tumor contour within the liver on all images. Maps of octahedral shear strain (OSS) were computed according to previously published methods11-13. Boundary ROIs were focused on the region 3 pixels inward and outward from the tumor margin, approximately 5.5-mm in thickness. A total of 913 radiomics features were automatically extracted from each ROI using Pyradiomics, including 14 shape features, 18 first-order features, 75 texture features, and 806 wavelet features. To mitigate potential dimensionality issues and select the most relevant features, we applied Correlation-based Feature Selection (CFS) combined with Best First Search (BF) to the training set, reducing the feature dimensions to 814,15. We then conducted least absolute shrinkage and selection operator (LASSO) analysis to identify three VETC-correlated features through 10-fold cross-validation. Scores were calculated using a linear regression model with the selected features, incorporating their specific LASSO coefficients. Predictive performance of the established radiomics score for VETC was evaluated using AUROC analysis. Internal validation was performed on the testing dataset. Fig.1 illustrates the workflow.Results
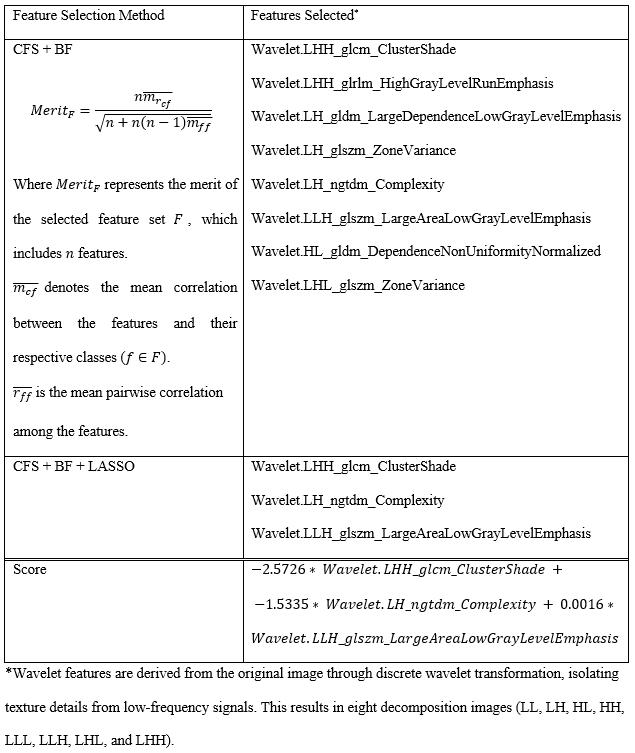
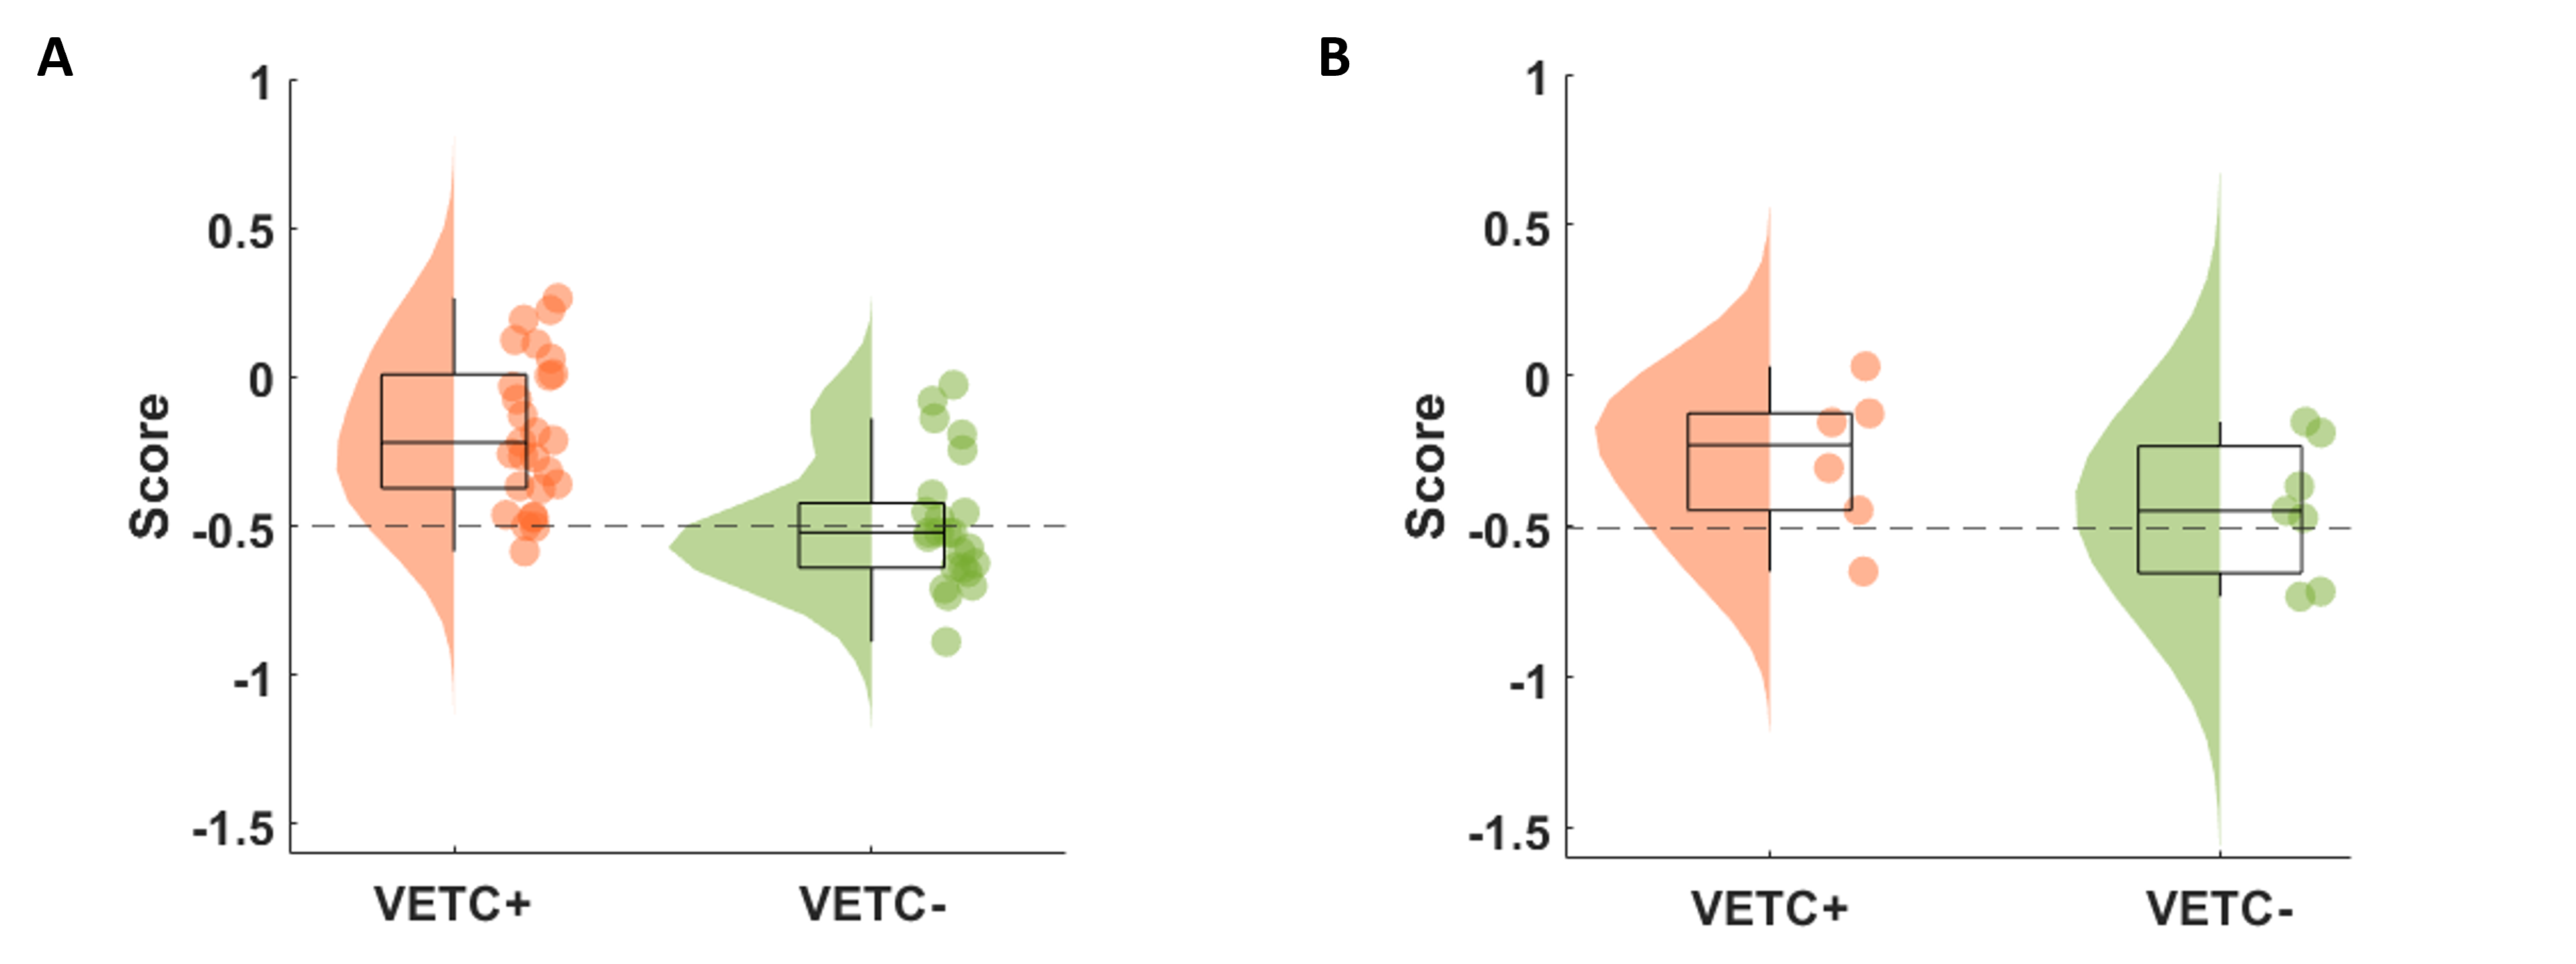
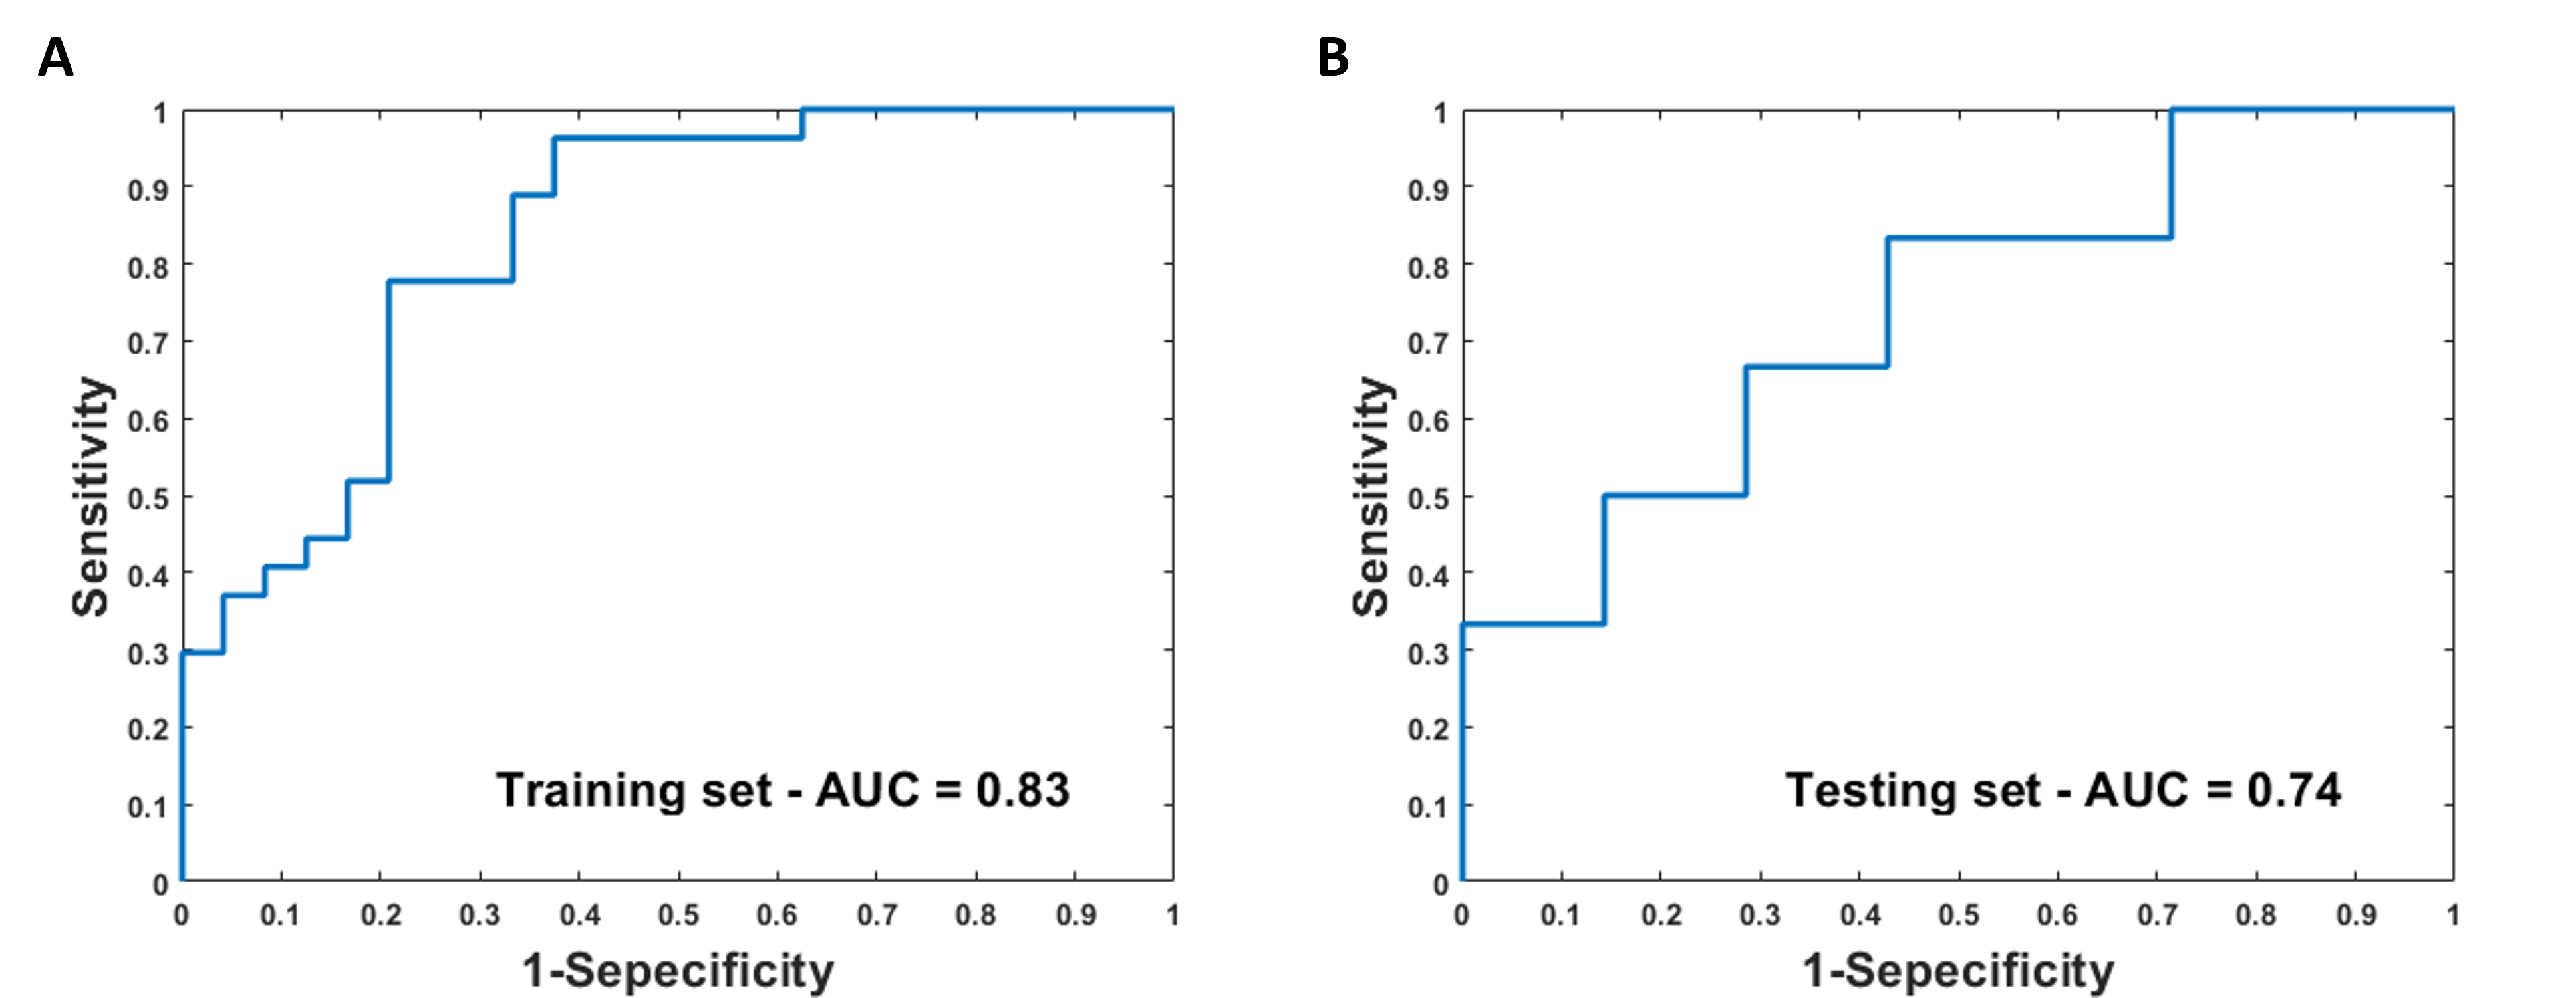
No significant differences in baseline characteristics were observed between VETC$$$+$$$ and VETC$$$-$$$ groups. Eight independent features were identified using the CFS+BF method and retained for further analysis, and LASSO regression was employed to select 3 features (Wavelet.LH, Wavelet.LHH, and Wavelet.LLH texture features) with non-zero coefficients to construct the radiomics score (Table1, Fig.2). The training set demonstrated higher scores in HCC cases with VETC compared to those without VETC, a trend that was further validated in the testing set (Fig.3). An optimal score cutoff value of -0.5 was determined by the maximum Youden index in the training cohort. The selected 3 radiomics features showed predictive potential, with an AUC of 0.83 in the training cohort and 0.74 in the validation cohort (Fig.4).Discussion
The radiomics score proposed in this study, which was constructed by radiomics features extracted from the MRE-assessed OSS map within the peritumoral region, showing predictive potential for preoperative VETC prediction in HCC. This study further supports our previous observation that quantitative evaluation of OSS could serve as a potential biomarker for VETC prediction in HCC7. The radiomics features include three wavelet features associated with texture variations in grayscale levels at different scales: GLCM captured pixel co-occurrence texture information in different directions and frequencies, NGTDM highlighted local texture variations across various frequency scales, and GLSZM analyzed gray-level zone distribution at different scales. Consistent with previous research, these texture features could provide more imaging information related to tumor biology and heterogeneity16,17.Conclusion
A radiomics score constructed by radiomics features derived from MRE-based strain analysis in the peritumoral region show promise in predicting VETC in HCC patients.Acknowledgements
This work was supported by grants from the NIH (R01 NS113760, R61 AT01218, R01 EB001981, and R01 EB010065), and NSFC( 82271973 and 91959118).References
- Beaufrère A, Calderaro J, Paradis V. Combined hepatocellular-cholangiocarcinoma: An update. Journal of hepatology. 2021 May 1;74(5):1212-24.
- Heimbach JK, Kulik LM, Finn RS, Sirlin CB, Abecassis MM, Roberts LR, Zhu AX, Murad MH, Marrero JA. AASLD guidelines for the treatment of hepatocellular carcinoma. Hepatology. 2018 Jan;67(1):358-80.
- Fang JH, Zhou HC, Zhang C, Shang LR, Zhang L, Xu J, Zheng L, Yuan Y, Guo RP, Jia WH, Yun JP. A novel vascular pattern promotes metastasis of hepatocellular carcinoma in an epithelial–mesenchymal transition–independent manner. Hepatology. 2015 Aug;62(2):452-65.
- Renne SL, Woo HY, Allegra S, Rudini N, Yano H, Donadon M, Viganò L, Akiba J, Lee HS, Rhee H, Park YN. Vessels encapsulating tumor clusters (VETC) is a powerful predictor of aggressive hepatocellular carcinoma. Hepatology. 2020 Jan;71(1):183-95.
- Li M, Yin Z, Hu B, Guo N, Zhang L, Zhang L, Zhu J, Chen W, Yin M, Chen J, Ehman RL. MR elastography-based shear strain mapping for assessment of microvascular invasion in hepatocellular carcinoma. European radiology. 2022 Jul;32(7):5024-32.
- Liu W, Rong D, Zhu J, Xiao Y, Zhang L, Deng Y, Chen J, Yin M, Venkatesh SK, Ehman RL, Wang J. Diagnostic accuracy of 3D magnetic resonance elastography for assessing histologic grade of hepatocellular carcinoma: comparison of three methods for positioning region of interest. Abdominal Radiology. 2021 Oct;46(10):4601-9.
- Li M, Zheng K, Yin Z, Zhang L, Zhou J, Zhang D, Chen J, Glaser K, Ehman R, Wang J. 3D MR Elastography-based Prediction of the Histologic VETC Pattern Associated with AggressiveHepatocellular Carcinoma [abstract #1663]. International Society for Magnetic Resonance in Medicine. 2023.
- Wei J, Jiang H, Gu D, Niu M, Fu F, Han Y, Song B, Tian J. Radiomics in liver diseases: Current progress and future opportunities. Liver International. 2020 Sep;40(9):2050-63.
- Dreher C, Linde P, Boda-Heggemann J, Baessler B. Radiomics for liver tumours. Strahlentherapie und Onkologie. 2020 Oct;196:888-99.
- Fang JH, Xu L, Shang LR, Pan CZ, Ding J, Tang YQ, Liu H, Liu CX, Zheng JL, Zhang YJ, Zhou ZG. Vessels that encapsulate tumor clusters (VETC) pattern is a predictor of sorafenib benefit in patients with hepatocellular carcinoma. Hepatology. 2019 Sep;70(3):824-39.
- Yin Z, Glaser KJ, Manduca A, Van Gompel JJ, Link MJ, Hughes JD, Romano A, Ehman RL, Huston III J. Slip interface imaging predicts tumor-brain adhesion in vestibular schwannomas. Radiology. 2015 Nov;277(2):507-17.
- Yin Z, Hughes JD, Glaser KJ, Manduca A, Van Gompel J, Link MJ, Romano A, Ehman RL, Huston III J. Slip interface imaging based on MR‐elastography preoperatively predicts meningioma–brain adhesion. Journal of Magnetic Resonance Imaging. 2017 Oct;46(4):1007-16.
- McGarry MD, Van Houten EE, Perrinez PR, Pattison AJ, Weaver JB, Paulsen KD. An octahedral shear strain-based measure of SNR for 3D MR elastography. Physics in Medicine & Biology. 2011 Jun 8;56(13):N153.
- Zheng K, Makrogiannis S. Bone texture characterization for osteoporosis diagnosis using digital radiography. In2016 38th Annual International Conference of the IEEE Engineering in Medicine and Biology Society (EMBC) 2016 Aug 16 (pp. 1034-1037). IEEE.
- Hall MA. Correlation-based feature selection for machine learning (Doctoral dissertation, The University of Waikato).
- Horvat N, Araujo-Filho JD, Assuncao-Jr AN, Machado FA, Sims JA, Rocha CC, Oliveira BC, Horvat JV, Maccali C, Puga AL, Chagas AL. Radiomic analysis of MRI to predict sustained complete response after radiofrequency ablation in patients with hepatocellular carcinoma-a pilot study. Clinics. 2021 Jul 16;76.
- Xiao D, Zhao Z, Liu J, Wang X, Fu P, Le Grange JM, Wang J, Guo X, Zhao H, Shi J, Yan P. Diagnosis of invasive meningioma based on brain-tumor interface radiomics features on brain MR images: a multicenter study. Frontiers in Oncology. 2021 Aug 20;11:708040.
Figures