0190
Feasibility of susceptibility separation using single-echo gradient-echo and MPRAGE1Department of Radiology and Diagnostic Imaging, University of Alberta, Edmonton, AB, Canada
Synopsis
Keywords: Susceptibility/QSM, Quantitative Susceptibility mapping, Susceptibility separation, R2*, SWI, MPRAGE, single-echo GRE
Motivation: Susceptibility separation enables exploring sub-voxel contributions of iron/myelin but requires multi-echo gradient-echo to calculate the R2* map. Extending its applicability to single-echo measurements such as in SWI-focused studies, would allow wider usage.
Goal(s): To develop and validate at 3T an approach that produces brain para- and diamagnetic maps from SWI with information from MPRAGE images typically collected for structural imaging.
Approach: R2* was estimated from SWI and MPRAGE using Bloch simulations, followed by production of para- and diamagnetic maps using calculated R2* and R2 maps, and SWI phase.
Results: Comparable maps to those produced from multi-echo images were obtained.
Impact: The proposed method enables producing para- and diamagnetic maps from SWI studies, with the possibility of retrospective application if SWI raw phase and T1w images exist.
INTRODUCTION
Susceptibility separation is an emerging postprocessing technique to dismantle paramagnetic and diamagnetic sources at the sub-voxel level.1-4 To perform separation, having multi-echo gradient-echo (ME-GRE) images is essential to compute R2* relaxation and susceptibility induced field shift,1-4 as well as multi-echo spin-echo images to measure the transverse relaxation rate, R2.1,4 However, single-echo GRE imaging is still very common in clinical susceptibility-weighted imaging (SWI) studies with full flow compensation. Here we introduce and validate a method to apply susceptibility separation when ME-GRE images are not available, by utilizing single-echo GRE and T1-weighted images. This enables paramagnetic and diamagnetic maps when T2*-weighted images are available only at one echo time.METHODS
MPRAGE images are GRE-based with short TE, and thus can be used together with any other T2*-weighted images sampled at longer TE, such as SWI, as two points to fit the R2* relaxation rate. The different T1-weighting is accounted for with Bloch simulations to model the two signals and properly estimate the underlying R2* contribution.Imaging Protocol: Data from two different protocols were used for validation. Protocol 1 included MPRAGE and ME-GRE, from which a single echo (at TE: 26.7 ms) was extracted and used for testing. Protocol 2 had MPRAGE and SWI images, as well as ME-GRE. Both protocols included PD-T2 FSE images for R2 mapping, and all images were collected at 3T with informed consent and under the approval of the local ethics committee.
Imaging parameters of Protocol 1 included: A) 3D ME-GRE with 0.6x0.6x2.0 mm3 voxels, TR of 47.0 ms, and TE1/∆TE/TE6 of 5.0/7.1/41.0 ms; B) 3D MPRAGE with 1x1x1 mm3 and TE/TR of 2.2/6.8 ms. For Protocol 2: A) 3D SWI with 0.7x0.8x1.0 mm3 and TE/TR of 20/28 ms; B) 3D MPRAGE with 0.9x0.9x1.0 mm3 and TE/TR of 2.8/7.1 ms; C) 3D ME-GRE with 0.7x0.8x2.0 mm3, TR of 38.0 ms, and TE1/∆TE/TE6 of 3.7/6.1/33.4 ms. R2 mapping in both protocols used 2D PD-T2 FSE with 0.9x0.9x3.5 mm3, TR of 2500 ms, and TE1/TE2 of 10/93 ms; and B1+ mapping with 1.3x1.3x3.0 mm3.
Image Processing: The same processing pipeline was used for both the single-echo GRE/SWI and ME-GRE cases, except the step of R2* estimation as described below:
A) R2 and R2*: R2 maps were obtained by fitting the PD-T2 signal to a decay dictionary computed using Bloch simulations.5,6 R2* maps were obtained by exponential fitting for the ME-GRE data.
In the case of single-echo/SWI, the single-echo GRE and MPRAGE images were first normalized using proton density estimated from PD-T2 data, and then fitted to a dictionary computed using Bloch simulations at typical ranges of T1 and T2*.
B) Susceptibility Separation: Phase images were unwrapped using best-path7, and background field was removed using V-SHARP8. All required images were registered into GRE space and then para- and diamagnetic maps were computed using χ-separation toolbox1,9.
ROIs and Measurement: Segmentations of five deep gray matter (DGM) regions and four white matter (WM) regions based on the FSL MNI152 template10,11 were projected into the native GRE space after nonlinearly registering both spaces and obtaining the transformation matrices.
RESULTS
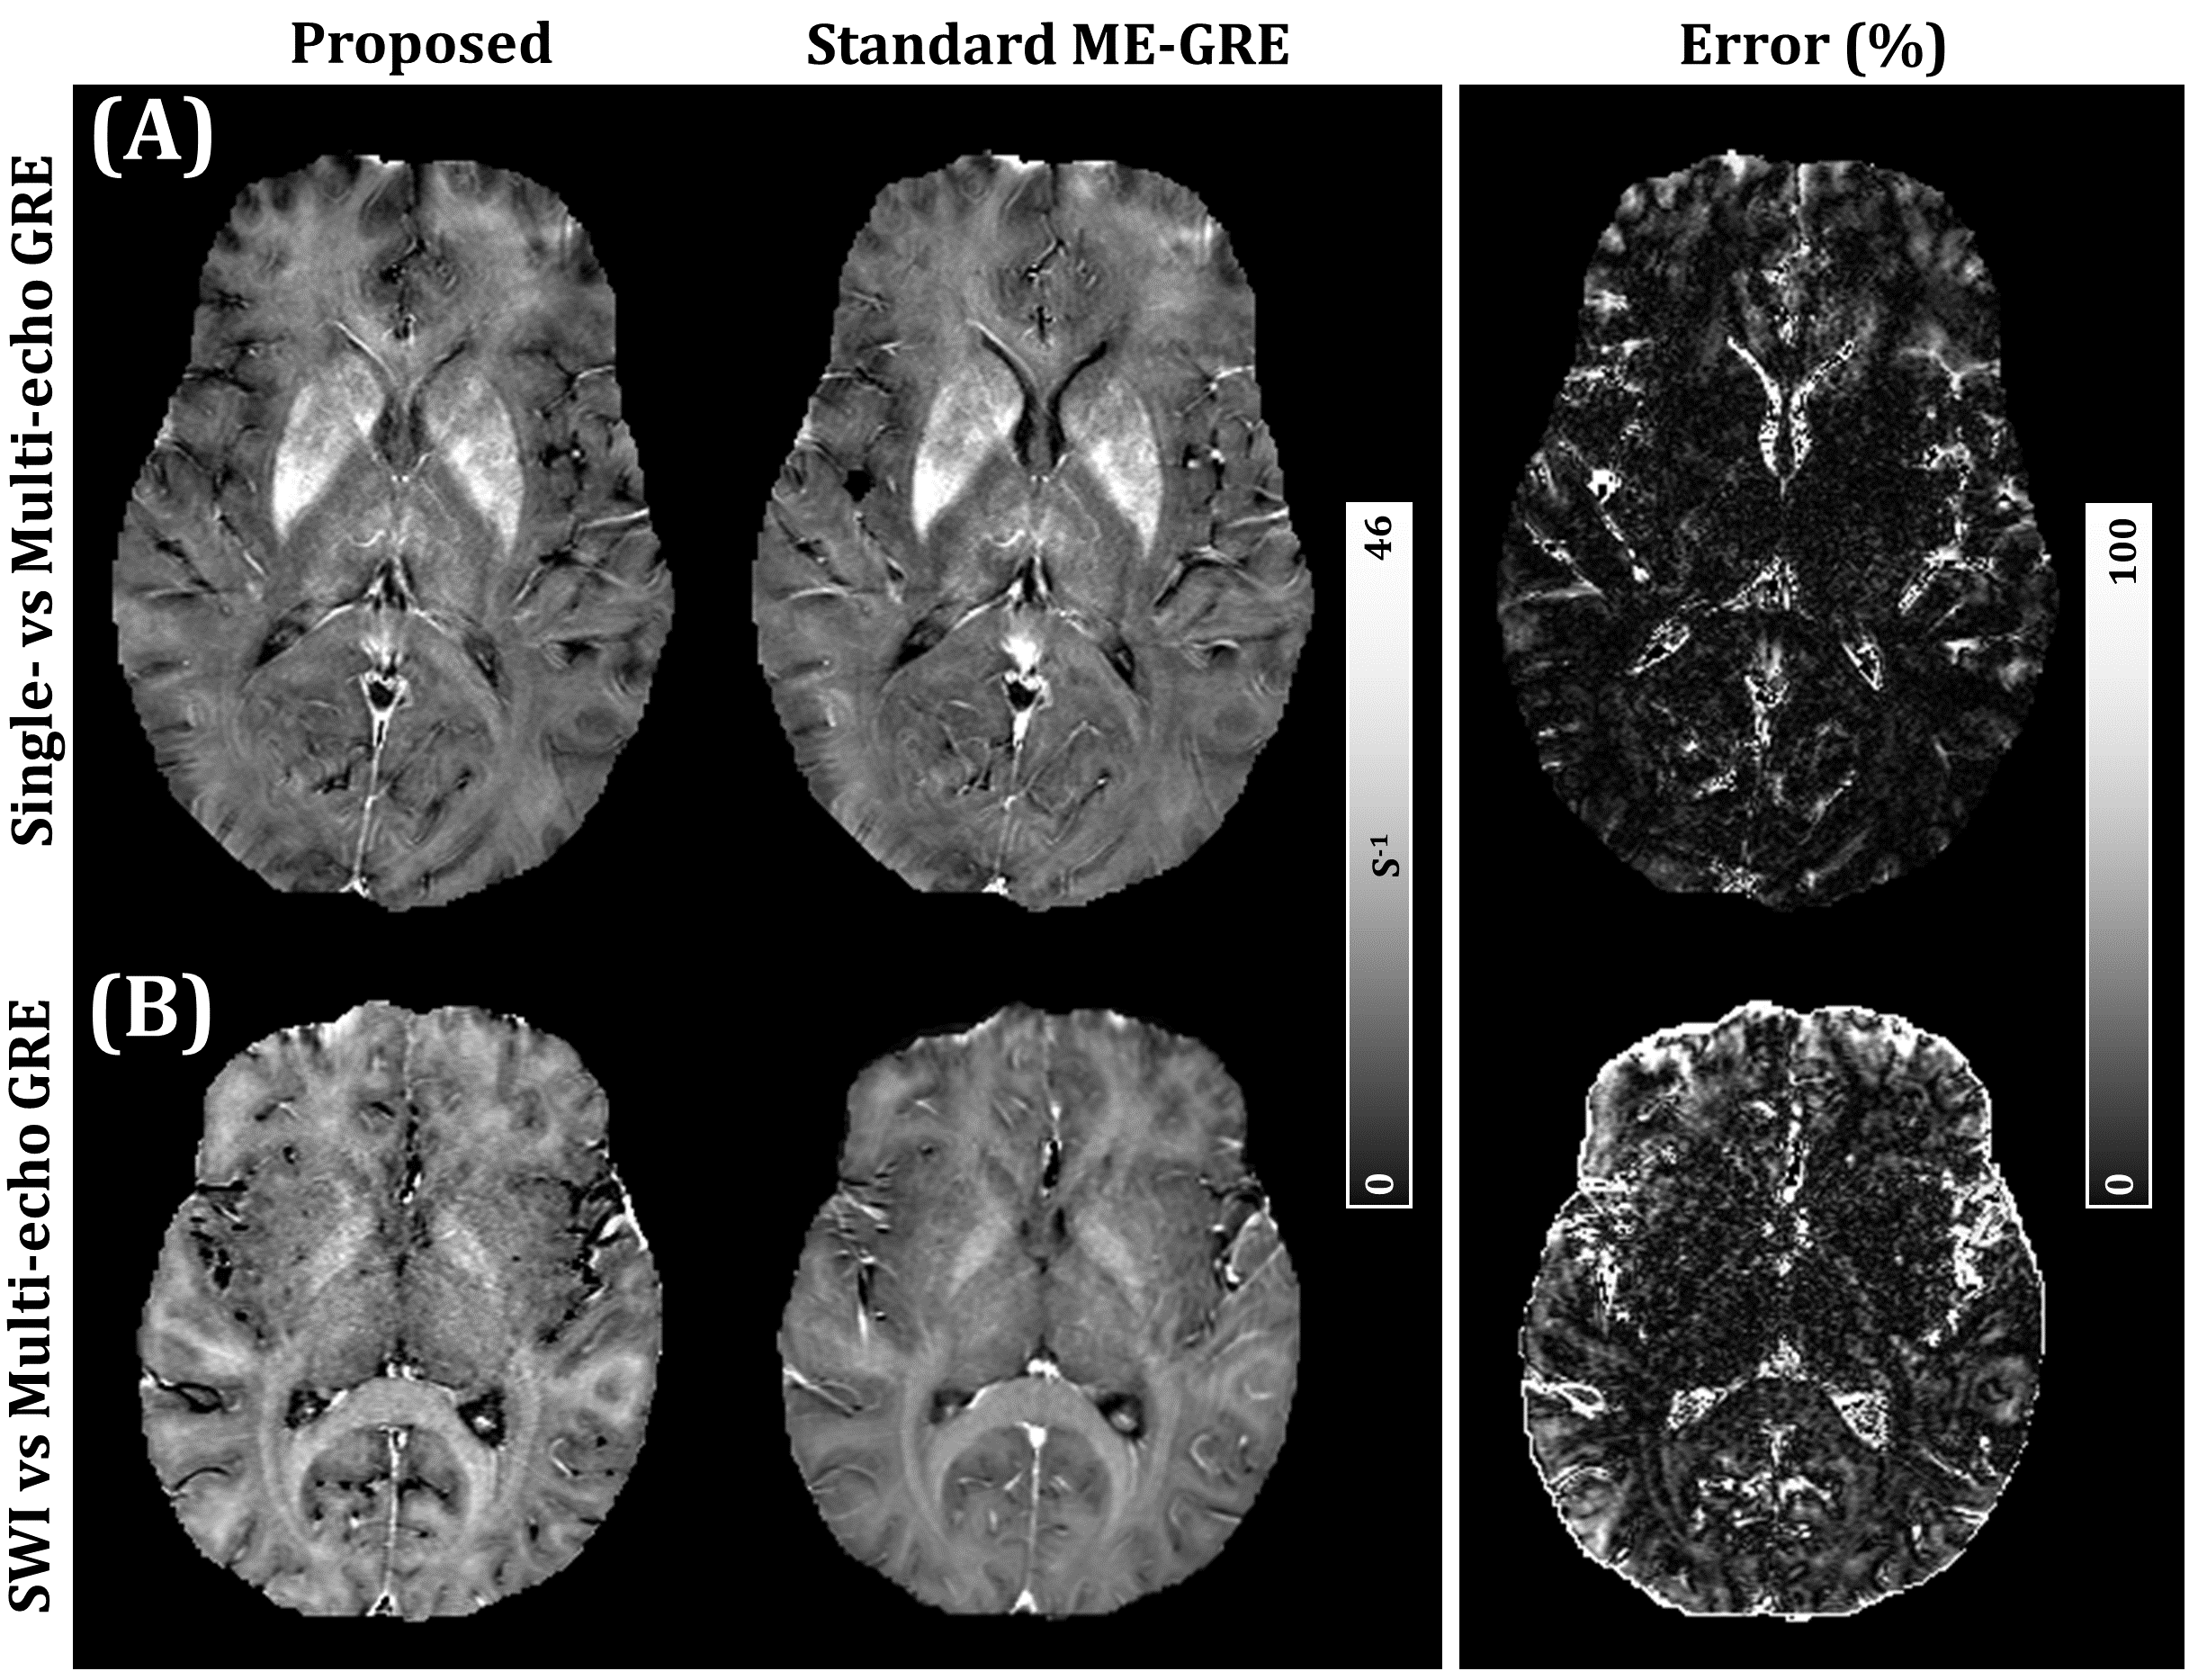
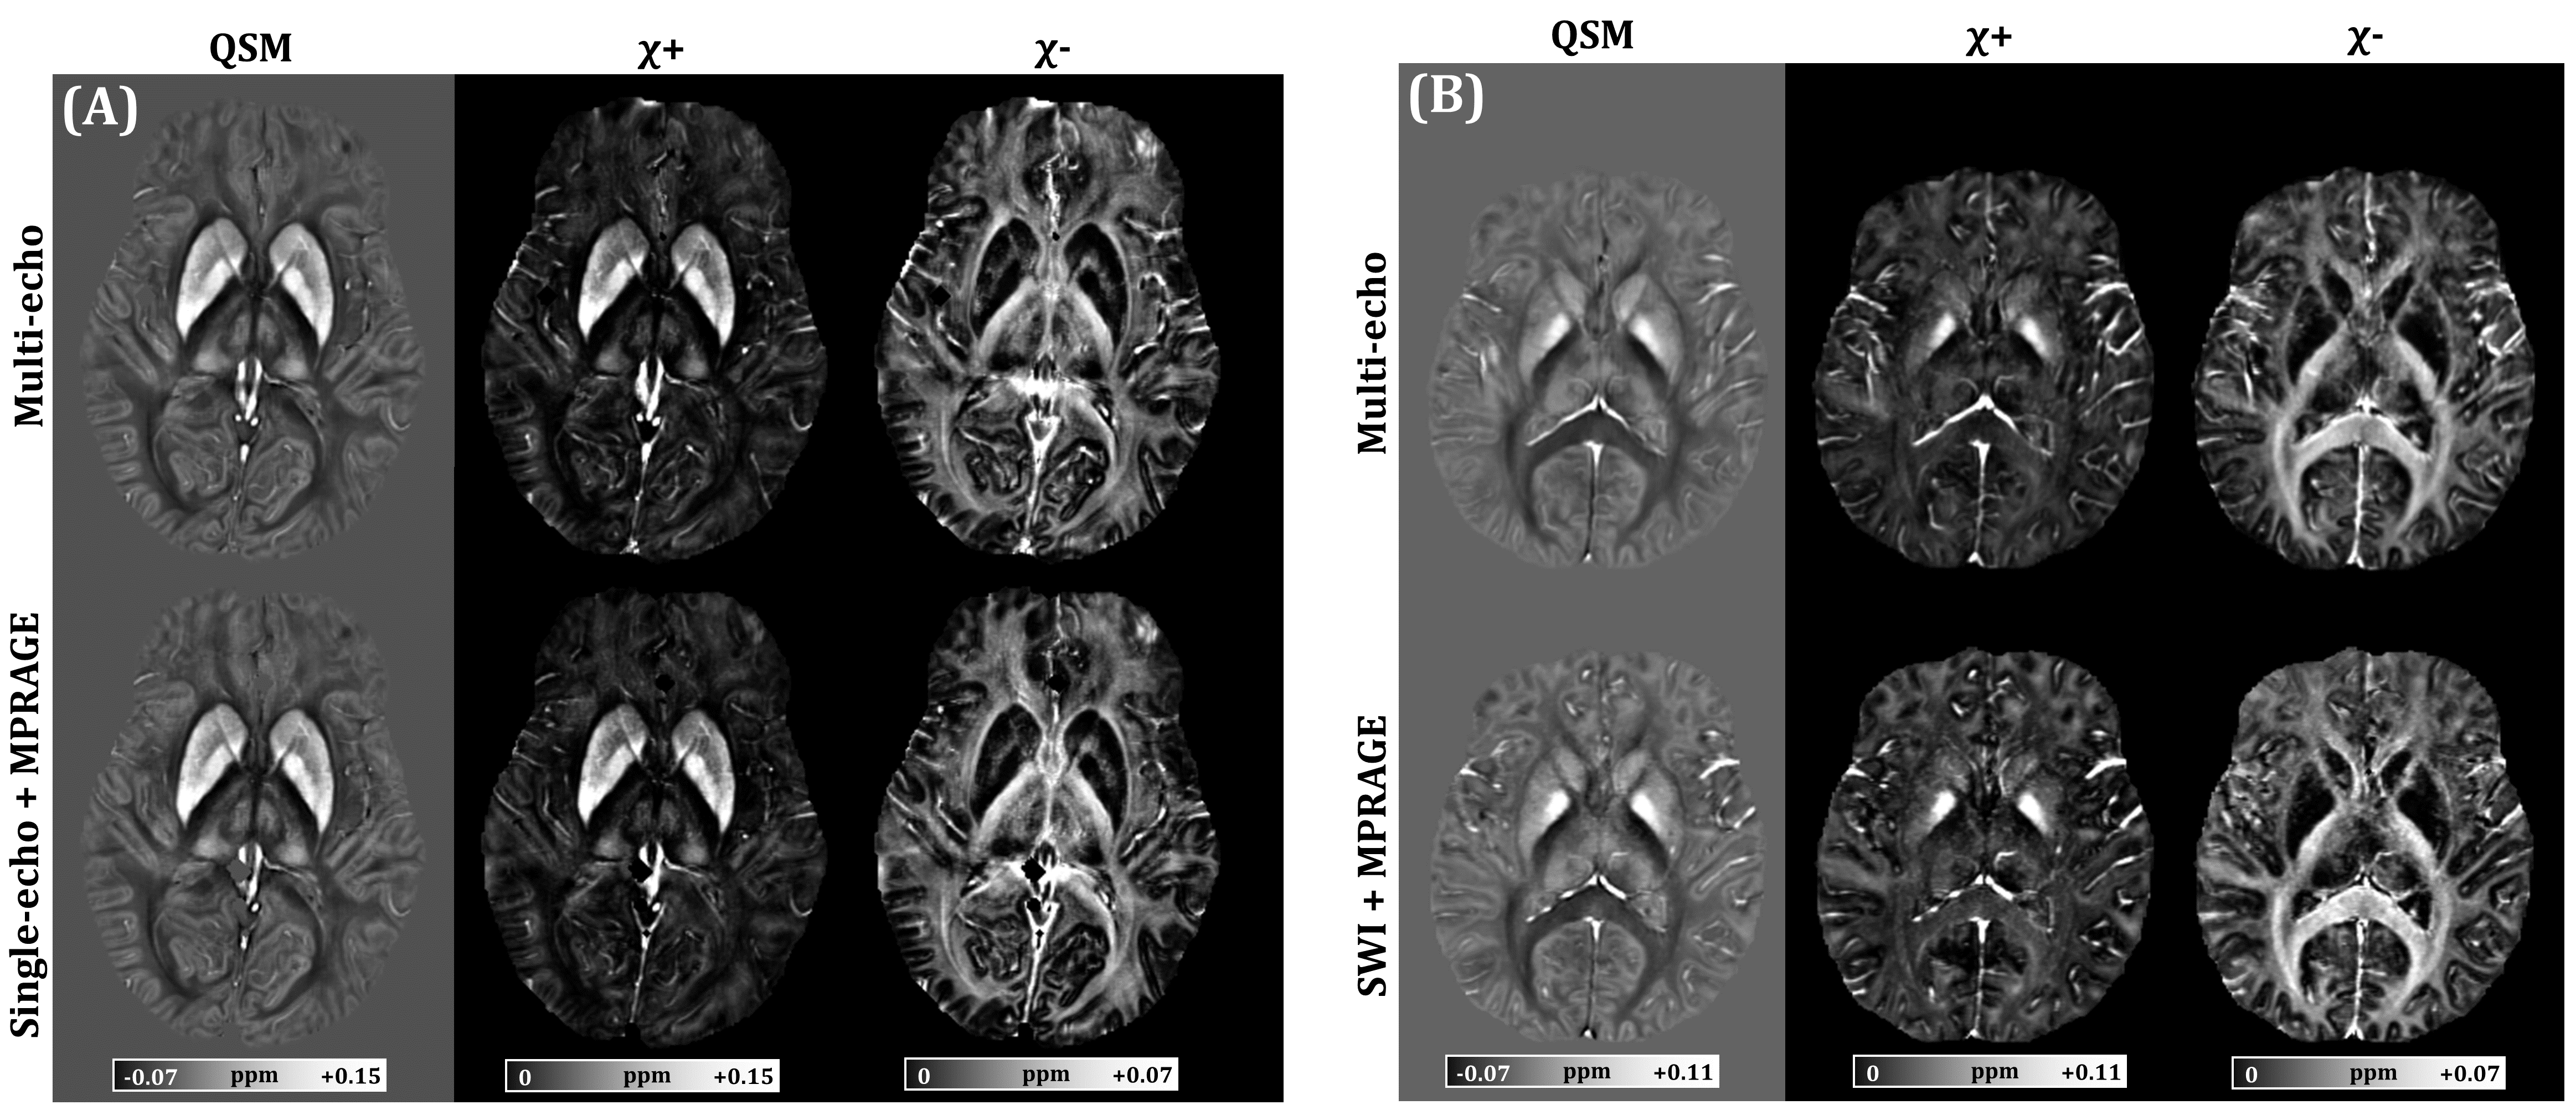
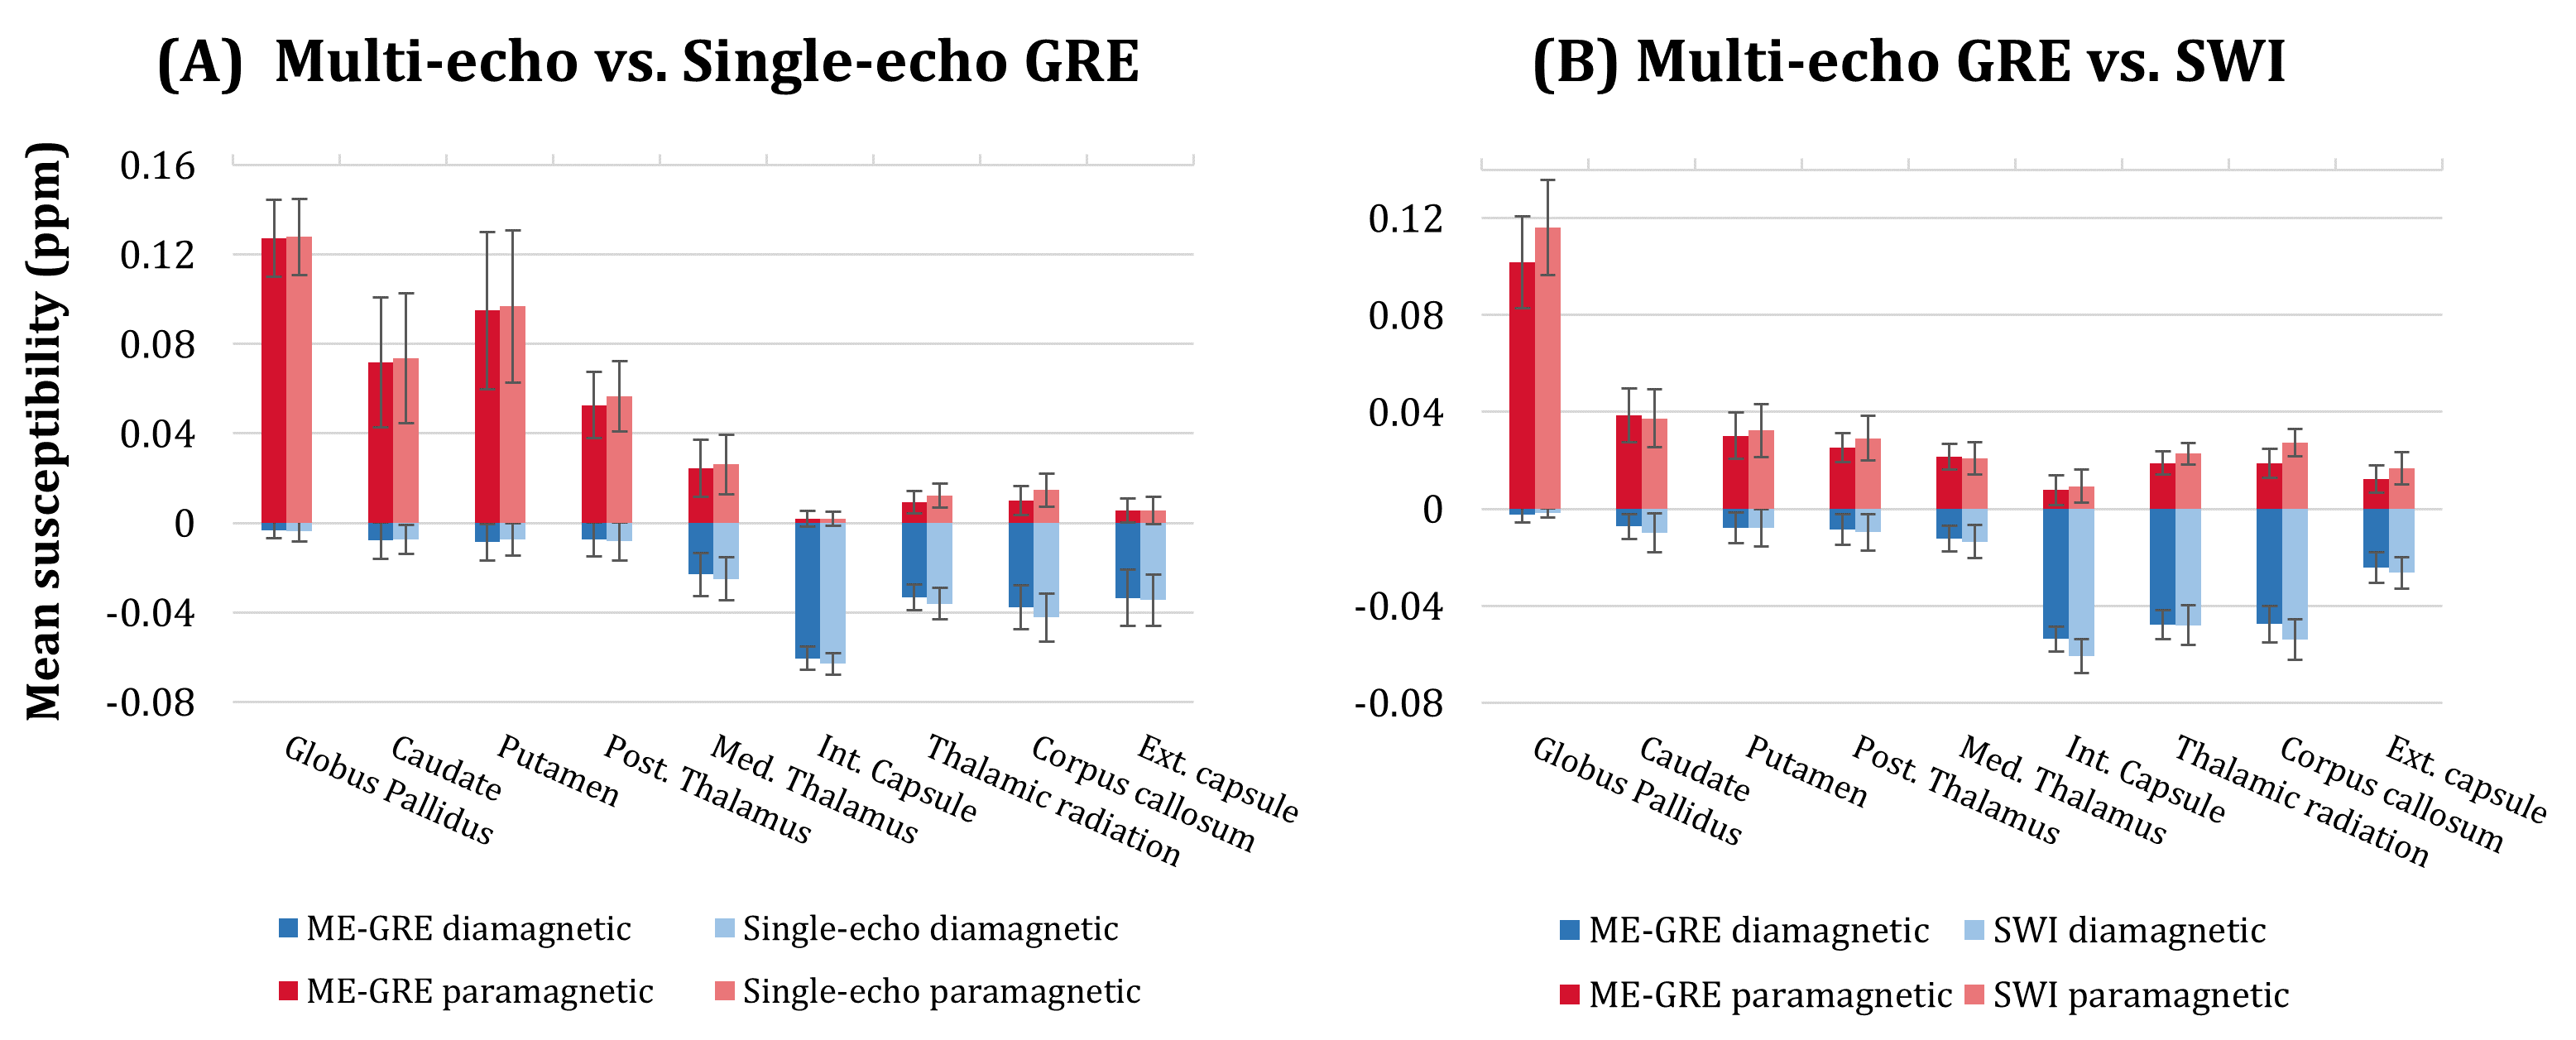
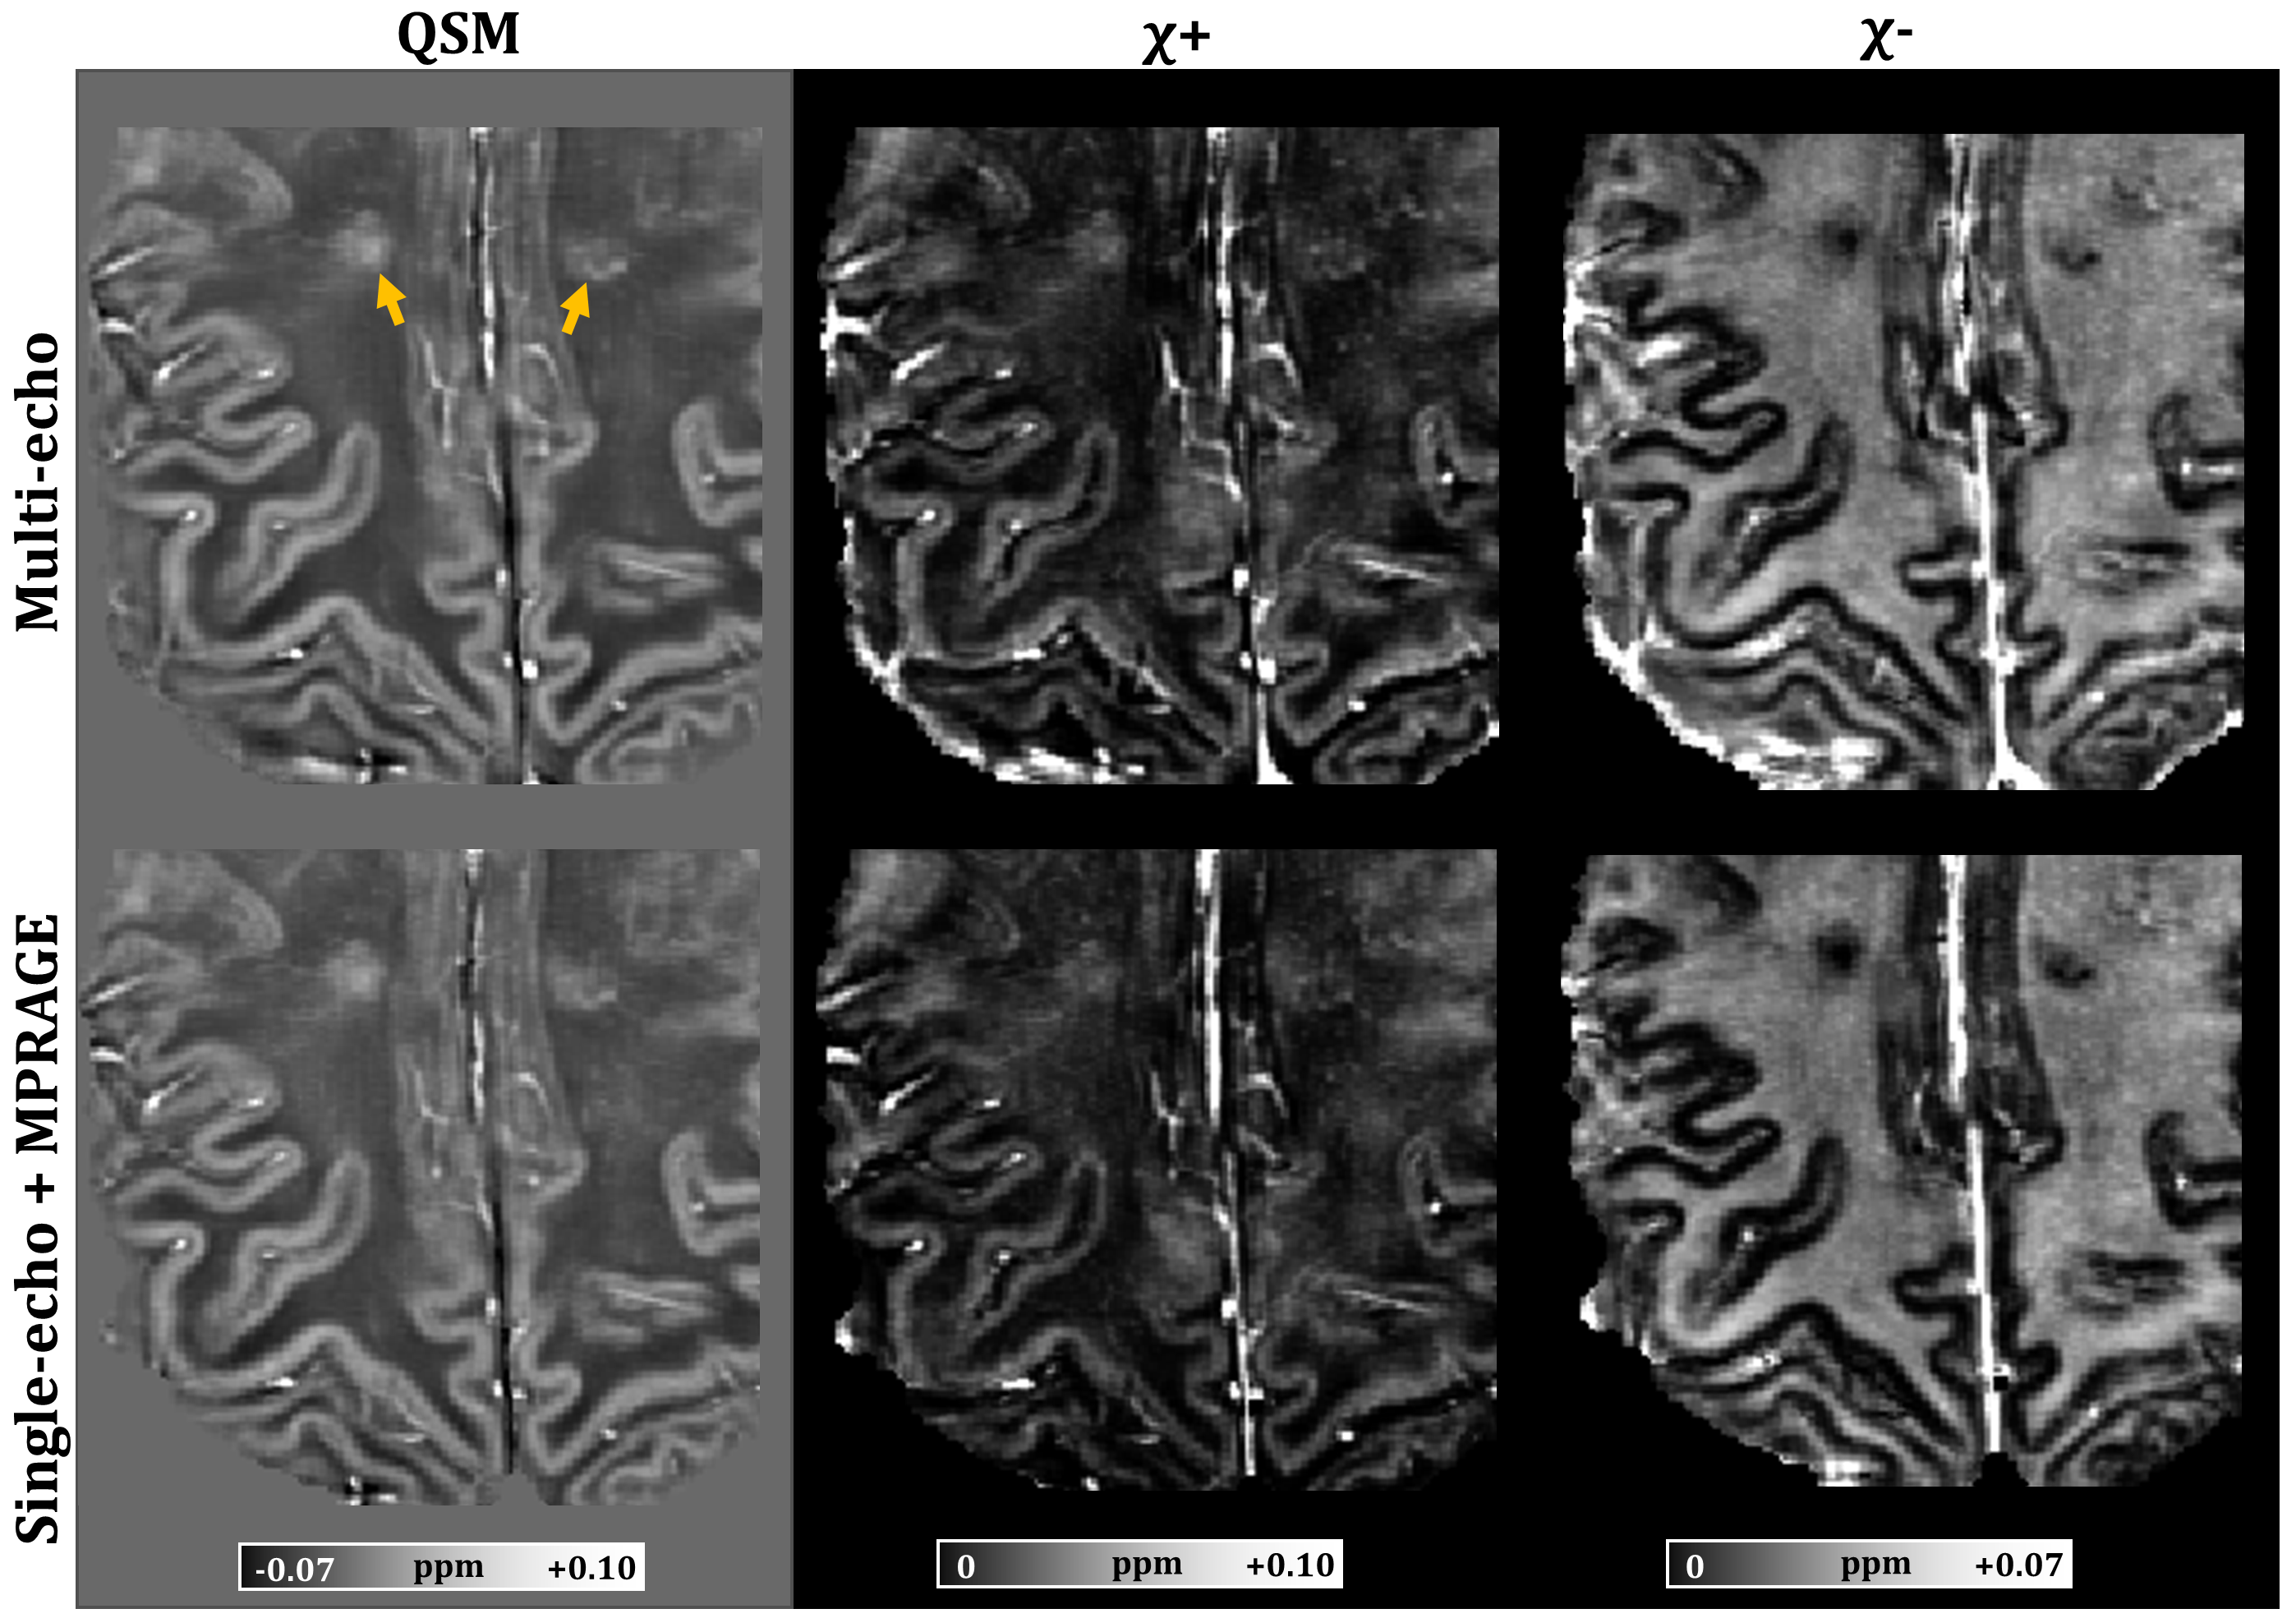
Figure 1 compares R2* images estimated using the proposed approach versus the standard multi-echo fitting. Mean error was around 5% except in CSF in (A) and slightly higher in (B) where the slice thickness differed from ME-GRE. Obtained QSM and separated para-/diamagnetic maps from multi-echo and single-echo were found to be comparable (Figures 2 and 3). Figure 4 demonstrates that similar conspicuity of multiple sclerosis lesions was observed in the separation results obtained from multi-echo versus single-echo gradient-echo images.DISCUSSION
We proposed a method to enable susceptibility separation in studies that included single-echo T2* weighted images such as SWI, given that raw phase images and T1w images exist. An R2* map is computed using MPRAGE and single-echo GRE images as both contain T2* weighting at different echo times. Then, a typical susceptibility separation processing pipeline can be used to obtain dia-/paramagnetic maps.Obtained maps using the proposed approach had comparable but slightly higher values when compared with those obtained from ME-GRE, which could be related to the differences in spatial resolution and/or ∆TE between MPRAGE and GRE images, an inherent limitation when combining two independent set of images. However, the differences were small, and the resultant separated maps provided similar visual depiction.
CONCLUSION
Susceptibility separation from single-echo GRE is feasible with aid from MPRAGE images, which allows extending its application to single echo SWI focused studies.Acknowledgements
This work was supported by the Natural Sciences and Engineering Research Council of Canada and the Canadian Institutes of Health Research.References
1. Shin HG, Lee J, Yun YH, Yoo SH, Jang J, Oh SH, Nam Y, Jung S, Kim S, Fukunaga M, Kim W. χ-separation: Magnetic susceptibility source separation toward iron and myelin mapping in the brain. Neuroimage. 2021;240:118371.
2. Chen J, Gong NJ, Chaim KT, Otaduy MC, Liu C. Decompose quantitative susceptibility mapping (QSM) to sub-voxel diamagnetic and paramagnetic components based on gradient-echo MRI data. Neuroimage. 2021;242:118477.
3. Dimov AV, Nguyen TD, Gillen KM, Marcille M, Spincemaille P, Pitt D, Gauthier SA, Wang Y. Susceptibility source separation from gradient echo data using magnitude decay modeling. Journal of Neuroimaging. 2022;32(5):852-859.
4. Li Z, Feng R, Liu Q, Feng J, Lao G, Zhang M, Li J, Zhang Y, Wei H. APART-QSM: an improved sub-voxel quantitative susceptibility mapping for susceptibility source separation using an iterative data fitting method. NeuroImage. 2023;274:120148.
5. McPhee KC, Wilman AH. T2 quantification from only proton density and T2-weighted MRI by modelling actual refocusing angles. Neuroimage. 2015;118:642-650.
6. Snyder J, Seres P, Stobbe RW, Grenier JG, Smyth P, Blevins G, Wilman AH. Inline dual‐echo T2 quantification in brain using a fast mapping reconstruction technique. NMR in Biomedicine. 2023;36(1):e4811.
7. Abdul-Rahman HS, Gdeisat MA, Burton DR, Lalor MJ, Lilley F, Moore CJ. Fast and robust three-dimensional best path phase unwrapping algorithm. Applied optics. 2007;46(26):6623-6635.
8. Li W, Wu B, Liu C. Quantitative susceptibility mapping of human brain reflects spatial variation in tissue composition. Neuroimage. 2011;55(4):1645–1656.
9. chi-separation, https://github.com/SNU-LIST/chi-separation, 2023.
10. Jenkinson M, Beckmann CF, Behrens TE, Woolrich MW, Smith SM. Fsl. Neuroimage. 2012;62(2):782-790.
11. Wakana S, Caprihan A, Panzenboeck MM, Fallon JH, Perry M, Gollub RL, Hua K, Zhang J, Jiang H, Dubey P, Blitz A. Reproducibility of quantitative tractography methods applied to cerebral white matter. Neuroimage. 2007;36(3):630-644.
Figures