0189
Potential of phase-based electrical conductivity in evaluating lumbar intervertebral disc degeneration1Global Center for Biomedical Science and Engineering, Hokkaido University Faculty of Medicine, Sapporo, Japan, 2Laboratory for Biomarker Imaging Science, Hokkaido University Graduate School of Biomedical Science and Engineering, Sapporo, Japan, 3Hokkaido University Graduate School of Biomedical Science and Engineering, Sapporo, Japan, 4Philips Research Laboratories, Hamburg, Germany
Synopsis
Keywords: Electromagnetic Tissue Properties, Electromagnetic Tissue Properties, intervertebral disc, lumbar, degeneration
Motivation: Visual assessment of T2-weighted image constitutes the mainstay in evaluating the severity of intervertebral disc degeneration (IVD) degeneration. Quantitative MRI indices that strongly correlate with the degree of degeneration are lacking.
Goal(s): This study aimed to evaluate if electrical conductivity (σ) derived from phase-based EPT was sensitive to the degenerative changes of lumbar IVD.
Approach: EPT was conducted, along with DWI, T1ρ, and T2* imaging, in 54 patients with lumbar IVD degeneration. The diagnostic performance of σ was compared with that of ADC, T1rho, and T2*.
Results: σ can compliment the other quantitative MRI indices in evaluating lumbar IVD degeneration.
Impact: This is the first study which evaluated the potential clinical usefulness of σ derived from phase-based EPT in evaluating the severity of degeneration of lumbar IVD.
Introduction
Lumbar intervertebral disc (IVD) degeneration is a common health problem associated with chronic and recurrent pain, which further leads to impaired quality of life, frequent hospital visits, and disability1,2. Accurate determination of the severity of degeneration is crucial for disease management. To date, visual assessment of IVD on sagittal T2-weighted images constitutes the mainstay in evaluating the severity of IVD degeneration3. The development of quantitative MRI indices that strongly correlate with the degree of degeneration is desired.Several MRI indices have recently been proposed to have the potential to quantify IVD degeneration. Among these, the apparent diffusion coefficient (ADC) of diffusion-weighted imaging (DWI), T1ρ, and T2* are widely known4-6. In a recent article7, a new MRI index called electrical conductivity (σ), derived from phase-based electric properties tomography (EPT), has been proposed to identify the physiological diurnal changes of IVD so that it may also be sensitive to the degenerative changes of IVD.
This prospective study aimed to evaluate if σ derived from phase-based EPT was sensitive to the degenerative changes of lumbar IVD.
Methods
54 serial patients who consulted at our hospital's Department of Orthopedic Surgery (mean age = 38.03 ± 7.53 years; 32 men) were included. All patients underwent MRI of the lumbar IVDs at 3T (Achieva TX or Ingenia Elition X, Philips Healthcare), including sagittal T2WI (TR/TE = 4000/90 ms), 2D fast spin-echo echo-planar DWI (TR/TE = 3100/71 ms, b = 0, 1000 s/mm2), 3D ultrafast gradient-echo T1ρ imaging (TR/TE = 5.8/0.944 ms, FA = 15°, spin-lock frequency = 500 Hz, TSL = 0, 20, 40, 80 ms), 3D gradient-echo T2* imaging (TR/TE = 5.8/0, 12, 25, 51 ms, FA = 15°), and 2D steady-state free precession EPT (TR/TE = 4.4/2.2 ms, FA = 30°, in-plane resolution = 1.9 mm × 1.9 mm, 40 dynamic scans).ADC, T1ρ, T2*, and σ maps were reconstructed from DWI, T1ρ, T2*, and EPT, respectively. σ maps were reconstructed by applying the second derivative of the Helmholtz equation not in 3D but in 1D along the axis parallel to each IVD to avoid the contamination of the reconstructed σ with boundary effects from the derivative perpendicular to the IVD. The typical noise-enhancing effect of numerical differentiation was counterbalanced with a subsequent bilateral median filter.
The quantitative MRI indices were tested for correlation with Pfirrmann grade (a visual scale used to determine the severity of IVD degeneration)3 using Pearson's product-moment correlation analyses. To better understand the role of σ, its correlation with other quantitative MRI indices was also tested. Finally, ROC analysis was performed to evaluate the diagnostic performance of each index in determining the severity of IVD degeneration and the added value of σ.
Results
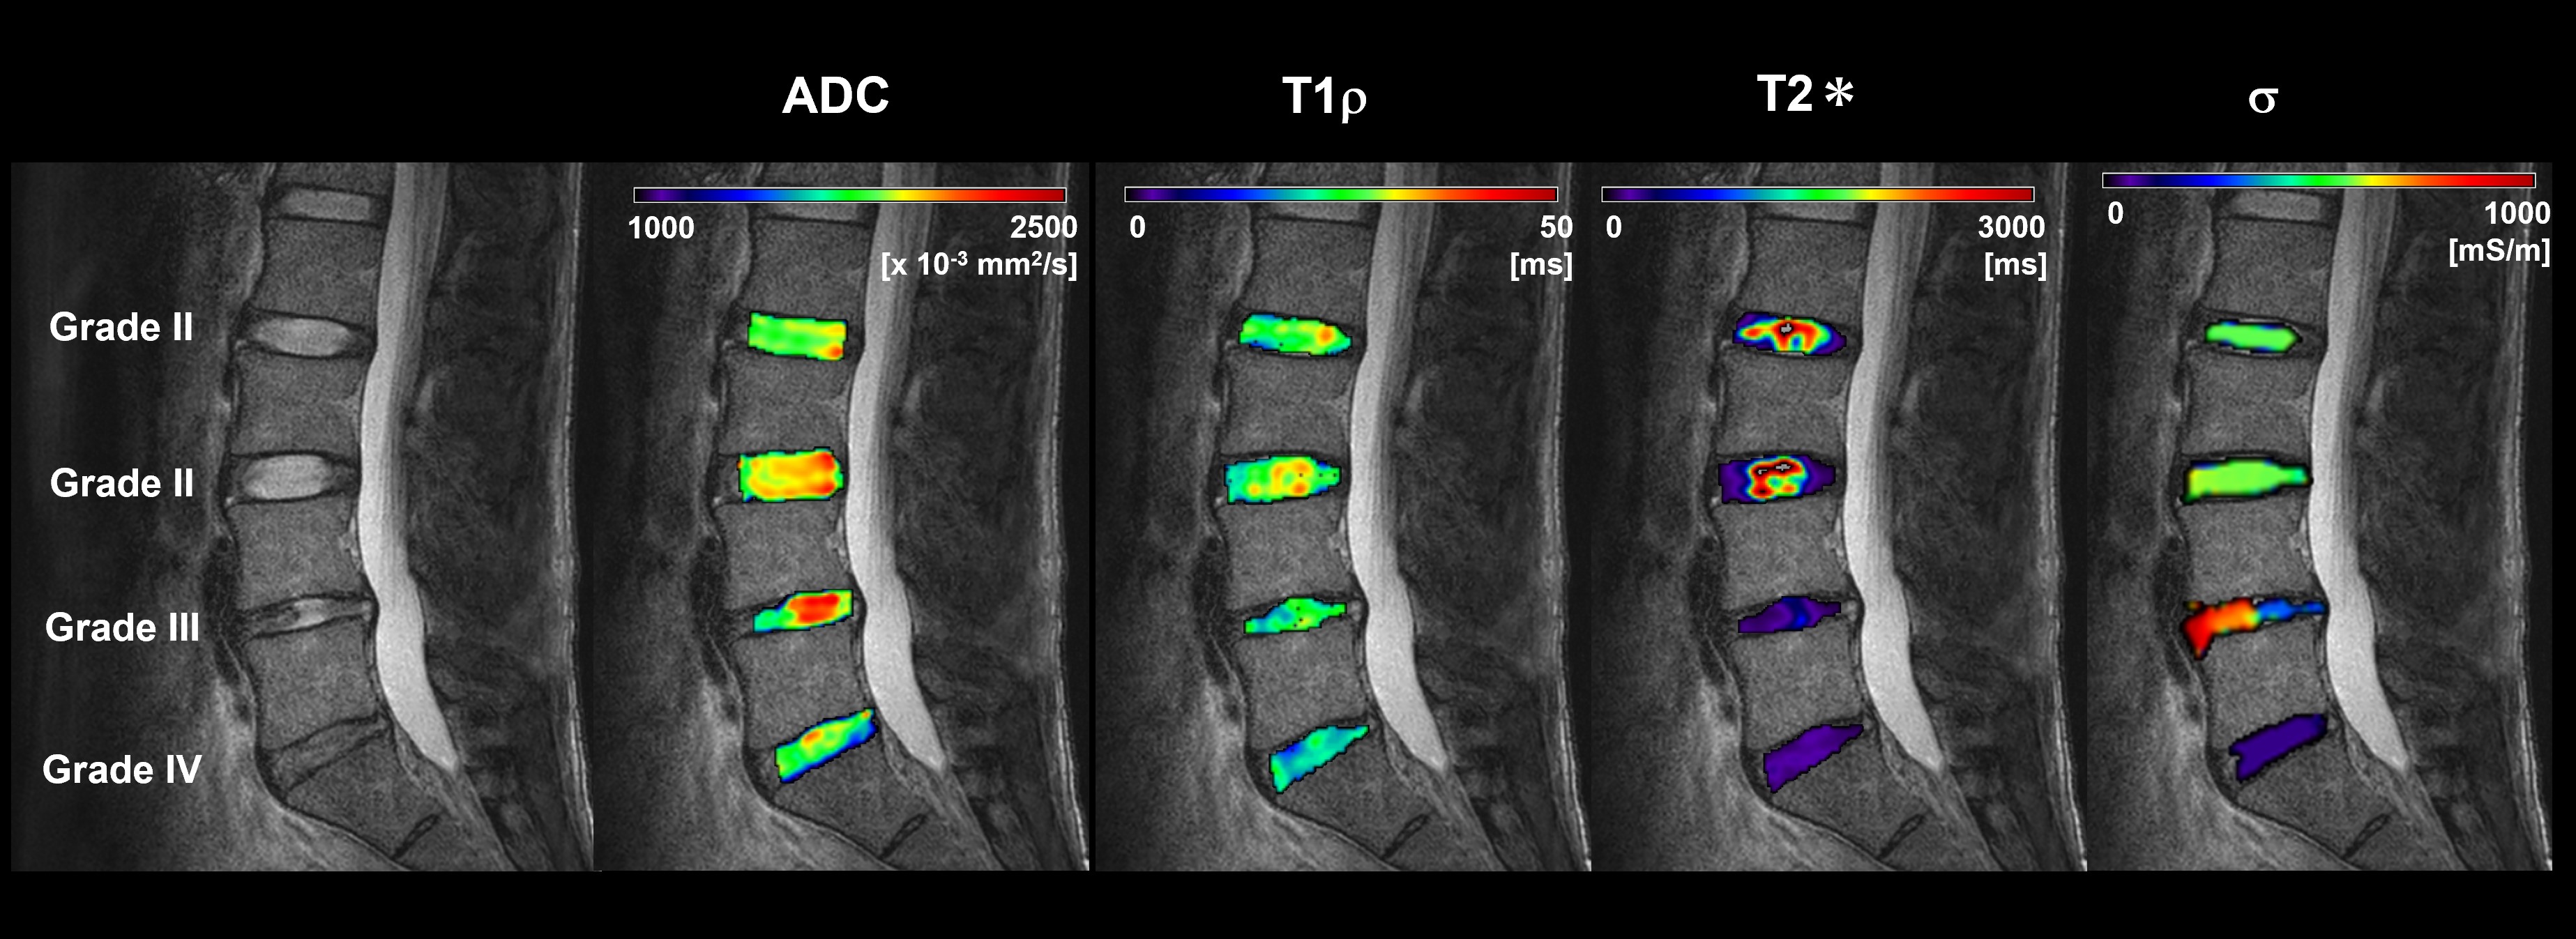
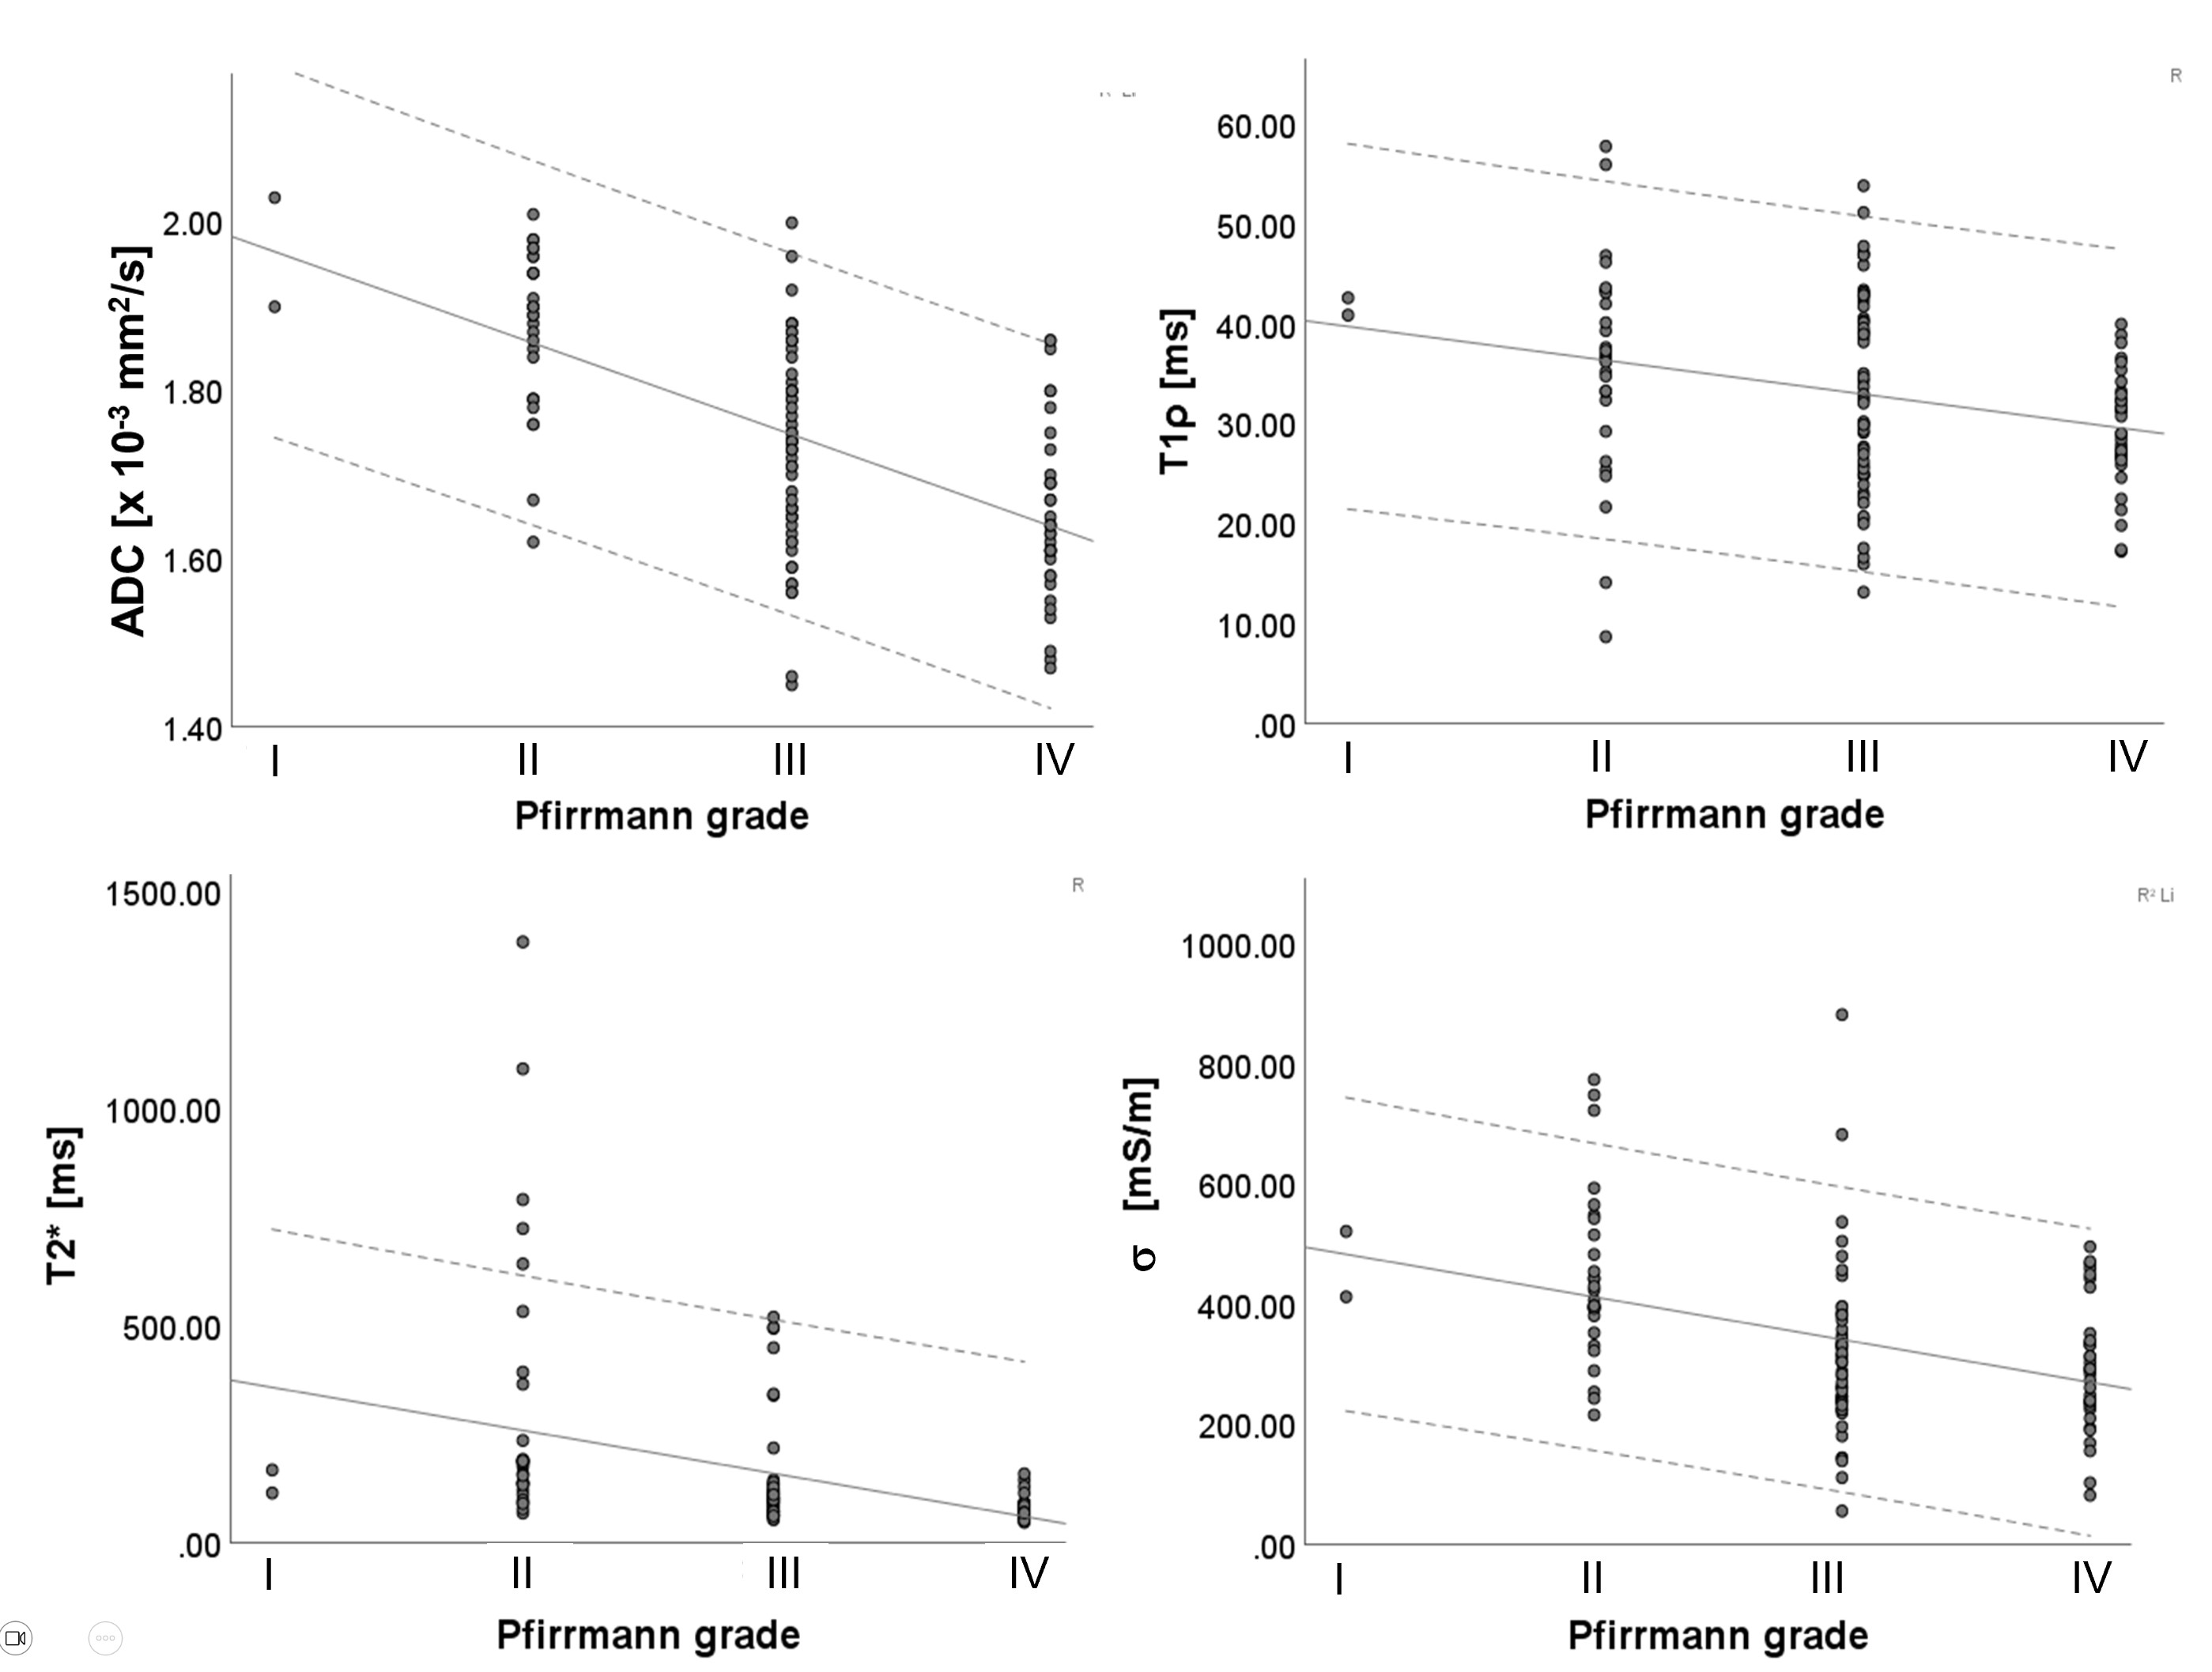
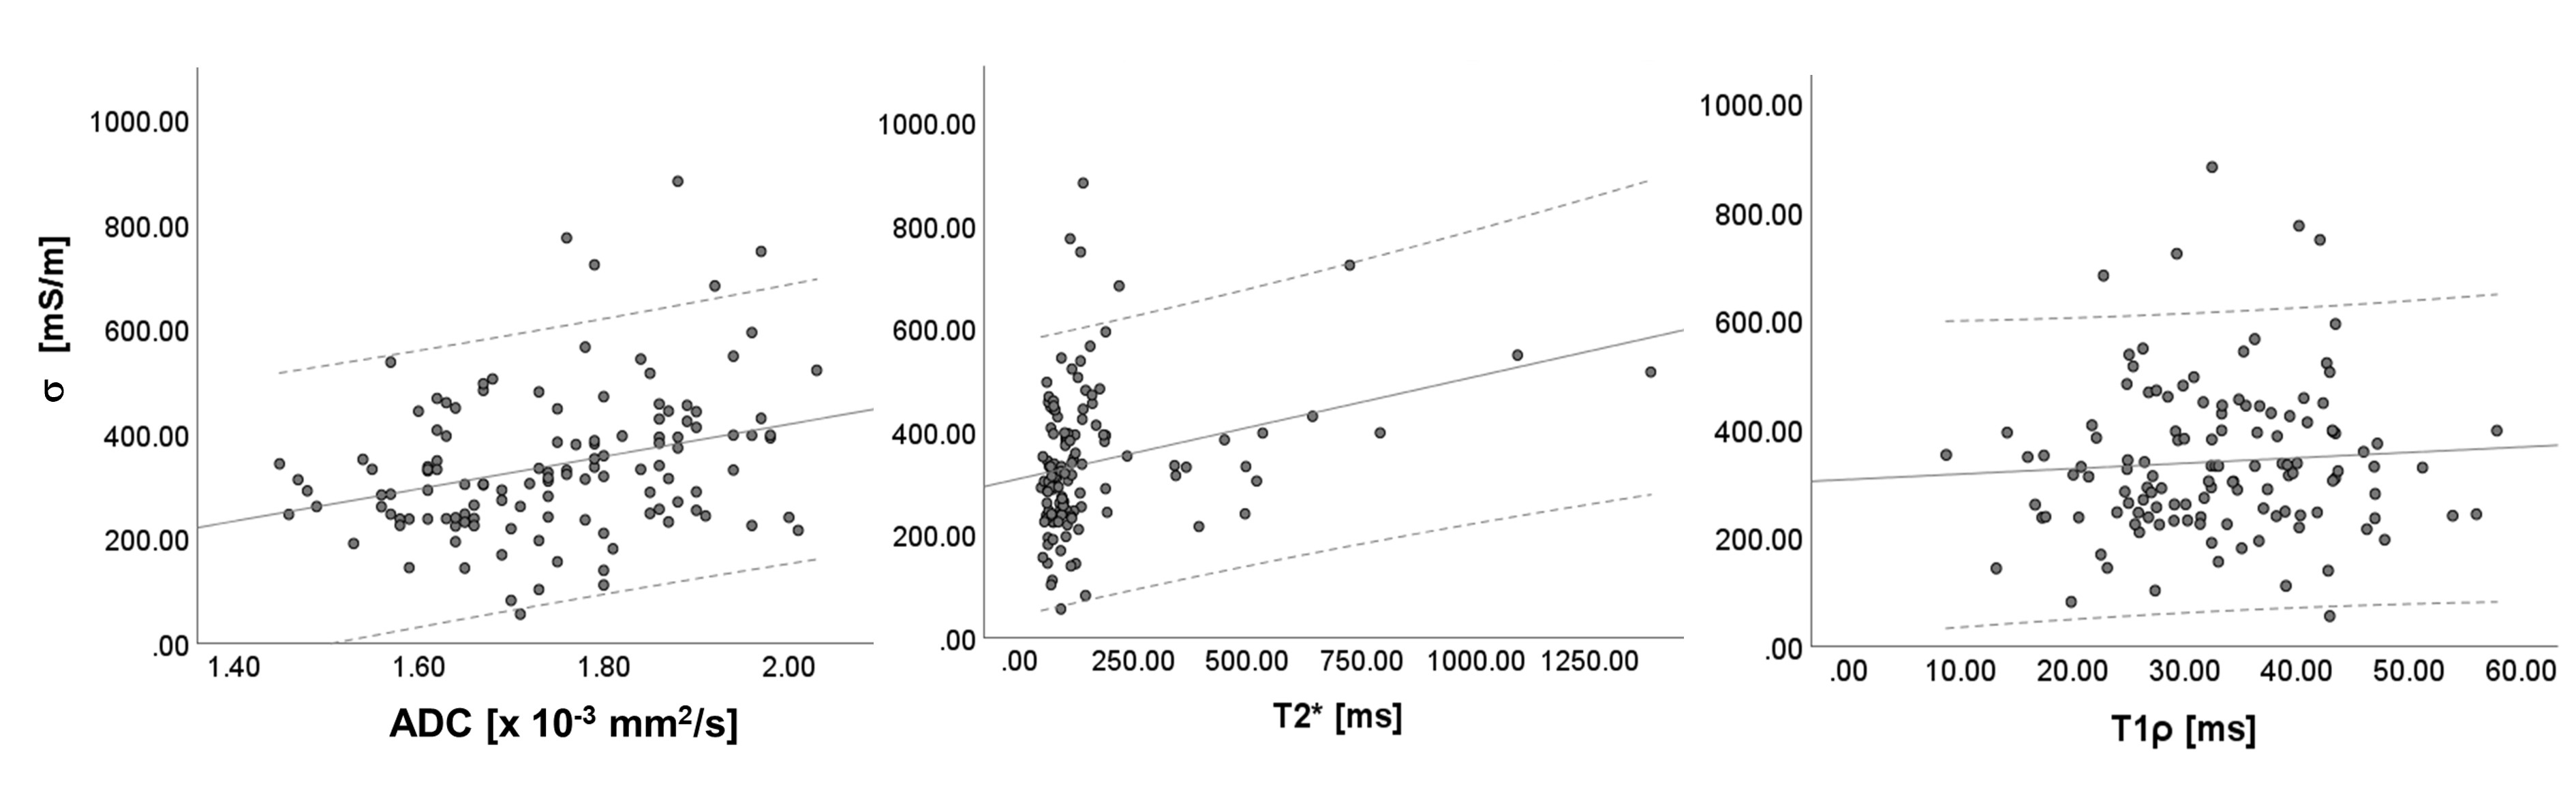
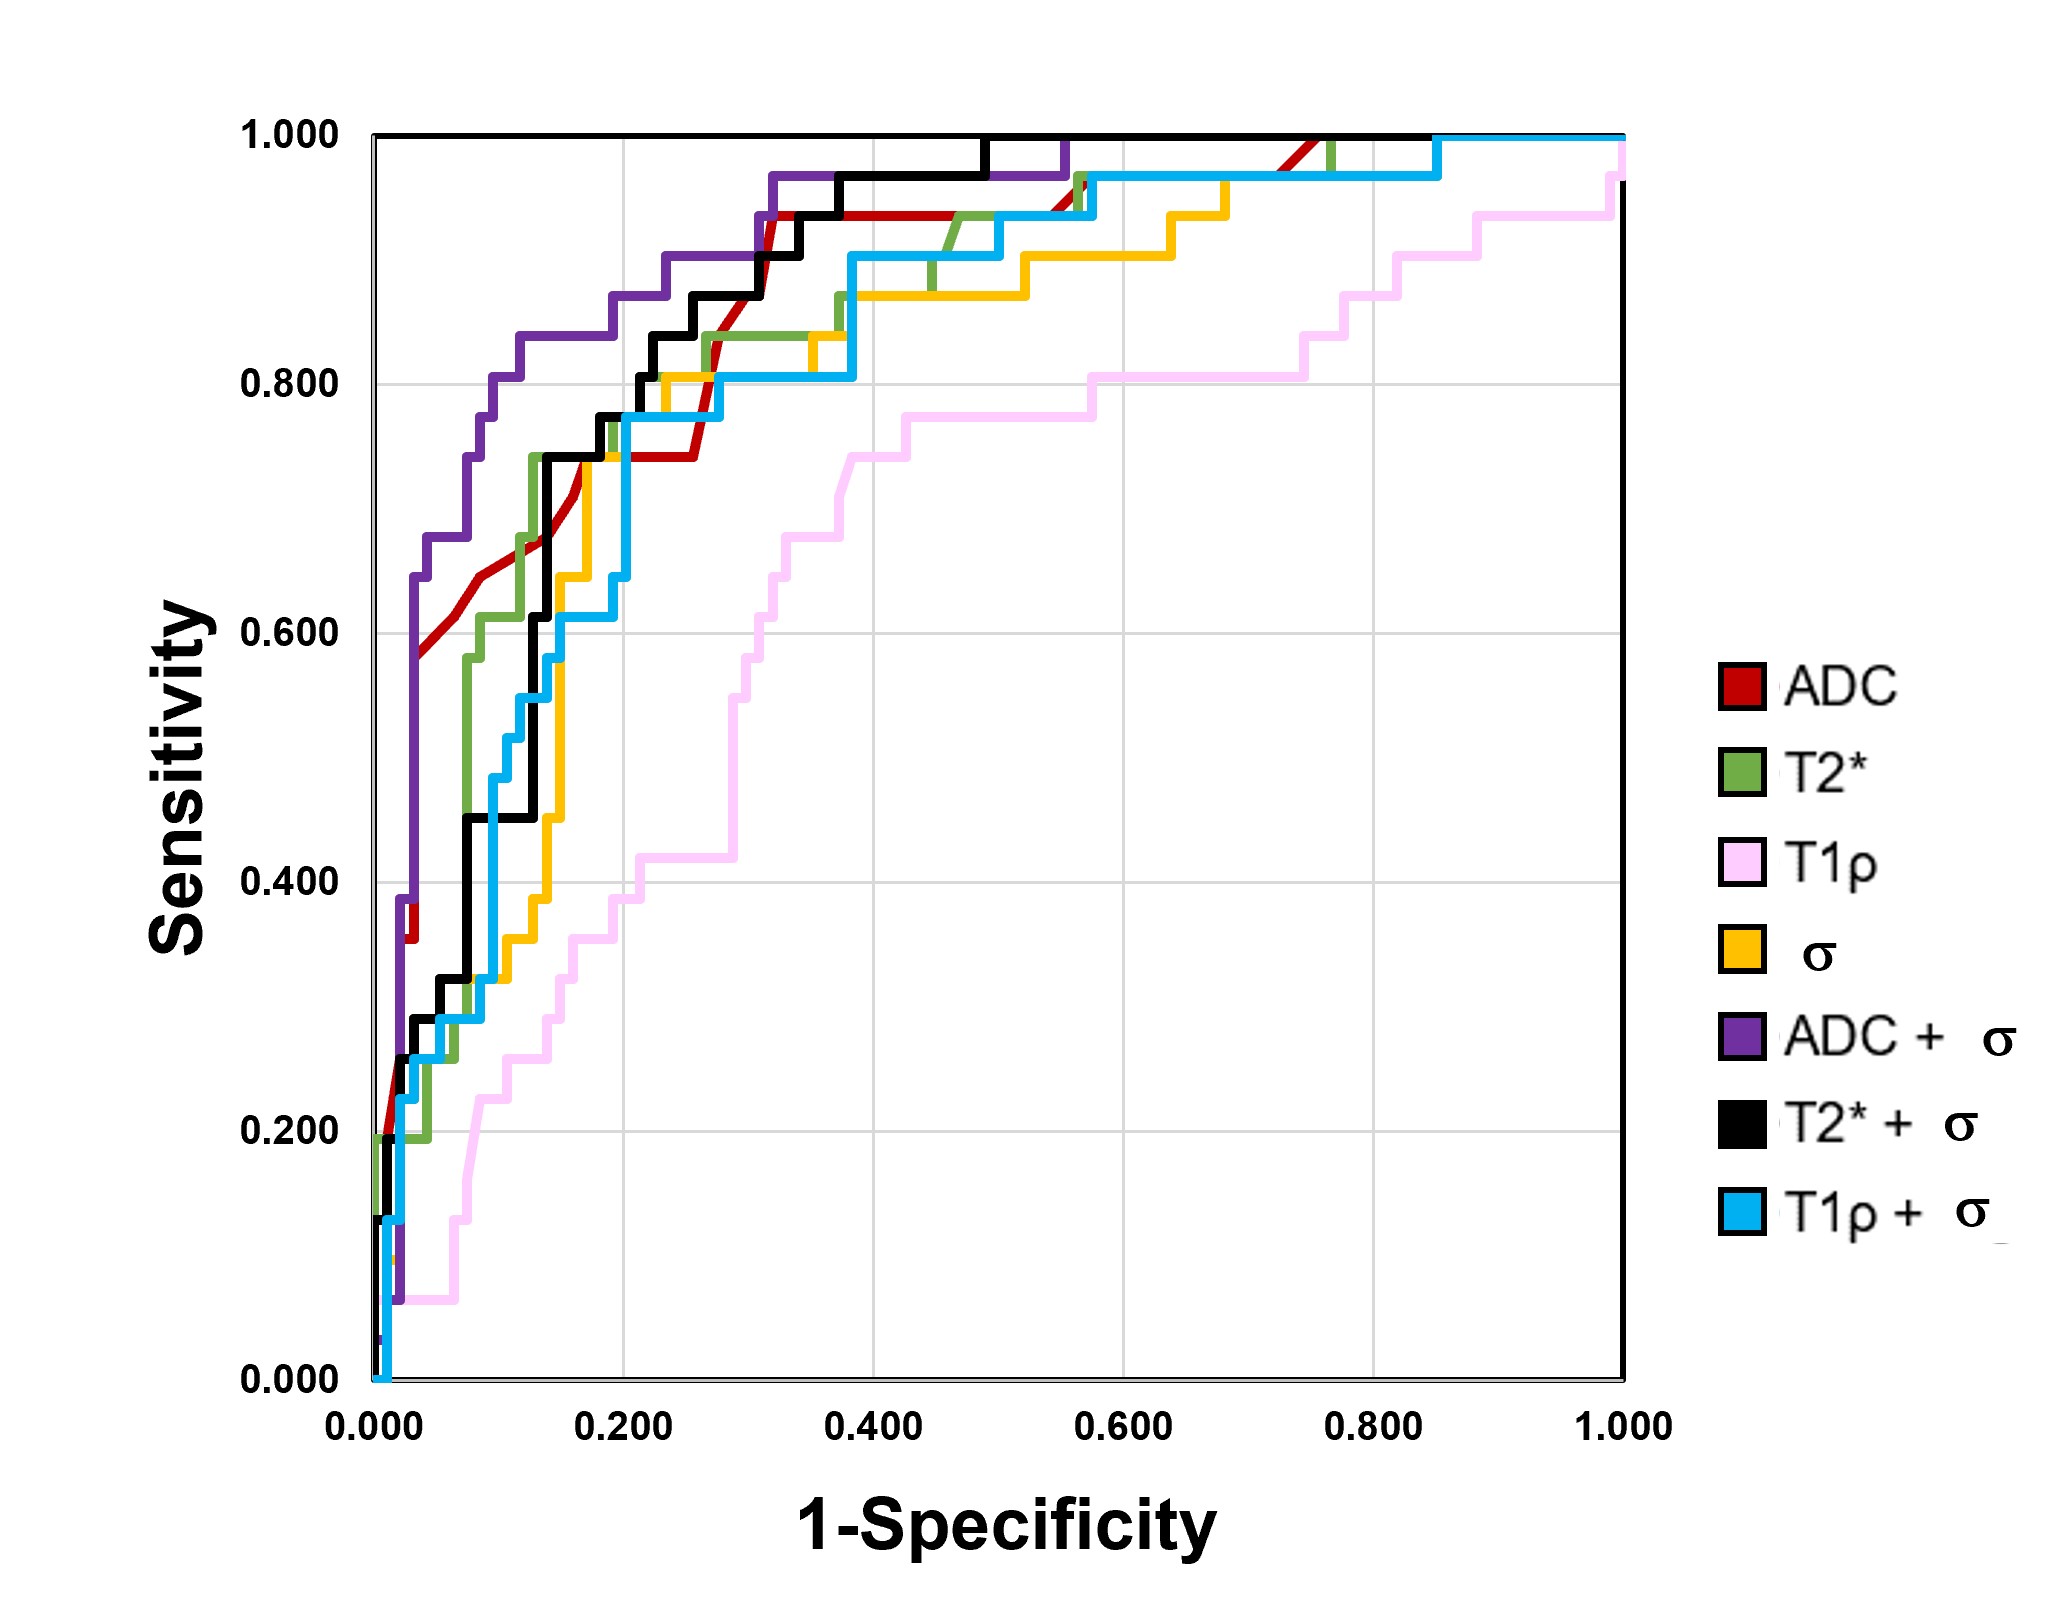
Altogether, 125 IVDs were evaluated. The breakdown for Pfirrmann grades was 2 grade I, 29 grade II, 59 grade III, and 35 grade IV. Table 1 summarizes the mean values of each quantitative MRI index for each Pfirrmann grade.In general, the quantitative MRI indices decreased with increasing severity of degeneration (Fig 1). Correlation analysis revealed a weak to strong negative correlation of quantitative MRI indices with Pfirrmann grade (Fig 2). σ showed a weak positive correlation with ADC (r=0.30) but not with the other two indices (Fig 3). The areas under the curve (AUC) in descending order were ADC (0.87), T2* (0.85), σ (0.81), and T1ρ (0.66). When σ was added to other indices, their diagnostic performance in distinguishing Pfirrmann grade III and IV from I and II increased to 0.92, 0.87, and 0.82 for ADC, T2*, and T1ρ, respectively (Fig 4).
Discussion
Our observation of a decrease in quantitative MRI indices with increasing degeneration severity suggests these indices' potential applicability in quantifying degeneration.The correlation of σ with ADC may be explained by the strong affinity of water to sodium ion concentration or mobility.
Although the diagnostic performance of σ of EPT is slightly inferior to ADC and T2*, the improved performance of these indices upon adding σ suggests that incorporating EPT would be valuable. This is especially true since the estimation of σ by EPT does not need a special coil or intervention, and the scan time lasts only a few seconds.
Conclusion
This study evaluated the role of σ derived from phase-based EPT in detecting the degenerative changes of lumbar IVD. The correlation of σ with the severity of IVD degeneration, its superior diagnostic performance to T1ρ, and the improved diagnostic performance of other quantitative MRI indices upon its addition, suggest that σ derived from phase-based EPT could become a useful quantitative index for evaluating IVD degeneration.Acknowledgements
No acknowledgement found.References
- Staszkiewicz R, Ulasavets U, Dobosz P, Drewniak S, Niewiadomska E, Grabarek BO. Assessment of quality of life, pain level and disability outcomes after lumbar discectomy. Sci Rep 2023; 13: 6009.
- Rigal J, Léglise A, Barnetche T, Cogniet A, Aunoble S, Le Huec JC. Meta-analysis of the effects of genetic polymorphisms on intervertebral disc degeneration. Eur Spine J 2017; 26; 2045–2052.
- Pfirrmann CWA, Metzdorf A, Zanetti M, Hodler J, Boos N. Magnetic Resonance Classification of Lumbar Intervertebral Disc Degeneration. Spine (Phila Pa 1976) 2001; 26: 1873–1878.
- Takashima H, Yoshimoto M, Ogon I, Takebayashi T, Imamura R, Akatsuka Y, Yamashita T. T1rho, T2, and T2* relaxation time based on grading of intervertebral disc degeneration. Acta Radiol 2023; 64: 1116-1121.
- Wáng YXJ, Zhang Q, Li X, Chen W, Ahuja A, Yuan J. T1ρ magnetic resonance: Basic physics principles and applications in knee and intervertebral disc imaging. Quant Imaging Med Surg 2015; 5: 858–885.
- Antoniou J, Demers CN, Beaudoin G, Goswami T, Mwale F, Aebi M, Alini M. Apparent diffusion coefficient of intervertebral discs related to matrix composition and integrity. Magn Reson Imaging 2004; 22: 963–972.
- Hamaguchi H, Kitagawa M, Sakamoto D, Katscher U, Sudo H, Yamada K, Kudo K, Tha KK. Quantitative Assessment of Intervertebral Disc Composition by MRI: Sensitivity to Diurnal Variation.Tomography 2023; 9: 1029-1040.
Figures