0188
Rapid High Resolution Integrated Structural and Functional Susceptibility and Conductivity Mapping in the Human Brain1Department of Medical Physics and Biomedical Engineering, University College London, London, United Kingdom, 2Neuroradiological Academic Unit, UCL Queen Square Institute of Neurology, University College London, London, United Kingdom, 3Lysholm Department of Neuroradiology, National Hospital for Neurology and Neurosurgery, London, United Kingdom
Synopsis
Keywords: Susceptibility/QSM, Quantitative Susceptibility mapping, Electrical Properties Tomography, EPT, fMRI, fQSM, fQCM
Motivation: Quantitative susceptibility mapping (QSM), electrical conductivity mapping (EPT) and fMRI show promise in characterising neurodegenerative diseases but each currently needs a separate time-consuming acquisition.
Goal(s): To develop a single, rapid acquisition for simultaneous structural and functional QSM and EPT, providing multi-modal contrasts to facilitate development of biomarkers for neurological diseases.
Approach: We developed a multi-echo 2D EPI sequence with 1.3 mm isotropic resolution and 4.02 s TR enabling acquisition of 70 timepoints in 6 min 15 s. We optimised QSM, EPT and fQSM reconstruction pipelines.
Results: We obtained high-quality structural QSM and EPT, alongside fMRI and fQSM activations from a visual stimulus.
Impact: Demonstrating that this efficient multi-echo EPI acquisition rapidly produces high-quality simultaneous QSM, fQSM and EPT reconstructions alongside conventional T2*-weighted, SWI and fMRI contrasts in 6 min 15 s will allow it to be incorporated into clinical studies of neurodegenerative diseases.
Introduction
Quantitative susceptibility mapping (QSM), electrical conductivity mapping (EPT) and fMRI show promise in characterising neurodegenerative diseases1–7 but each currently needs a separate ~5-minute acquisition. Therefore, we aimed to develop a rapid acquisition for simultaneous structural and functional QSM and EPT to facilitate clinical investigations and biomarker development. QSM and EPT can be performed simultaneously using multi-echo 3D gradient echo (GRE)8. However, QSM can be acquired using echo planar imaging (EPI) in a matter of seconds9–11, allowing functional analysis but typically with a single echo and at lower resolution than 3D-GRE. Multi-echo EPI provides more accurate QSM12,13, and enables EPT8. Here, we present an optimised high resolution multi-echo EPI acquisition, and processing pipelines, that provide structural and functional QSM and EPT alongside fMRI and other conventional contrasts at 1.3 mm isotropic resolution with a 4s TR, allowing acquisition of 70 volumes in ~6 minutes.Methods
AcquisitionTo demonstrate the optimised acquisition parameters, a healthy volunteer was scanned on a Siemens Prisma 3T MR system using a 32-channel head coil with a single-shot axial 2D-EPI sequence14 with 1.3 mm isotropic resolution; GRAPPA=4; MB=3; partial Fourier 6/8; TE=15.6, 41.6, 67.6 ms; TR=4023 ms; TA = 6 min 15 s and 70 timepoints.
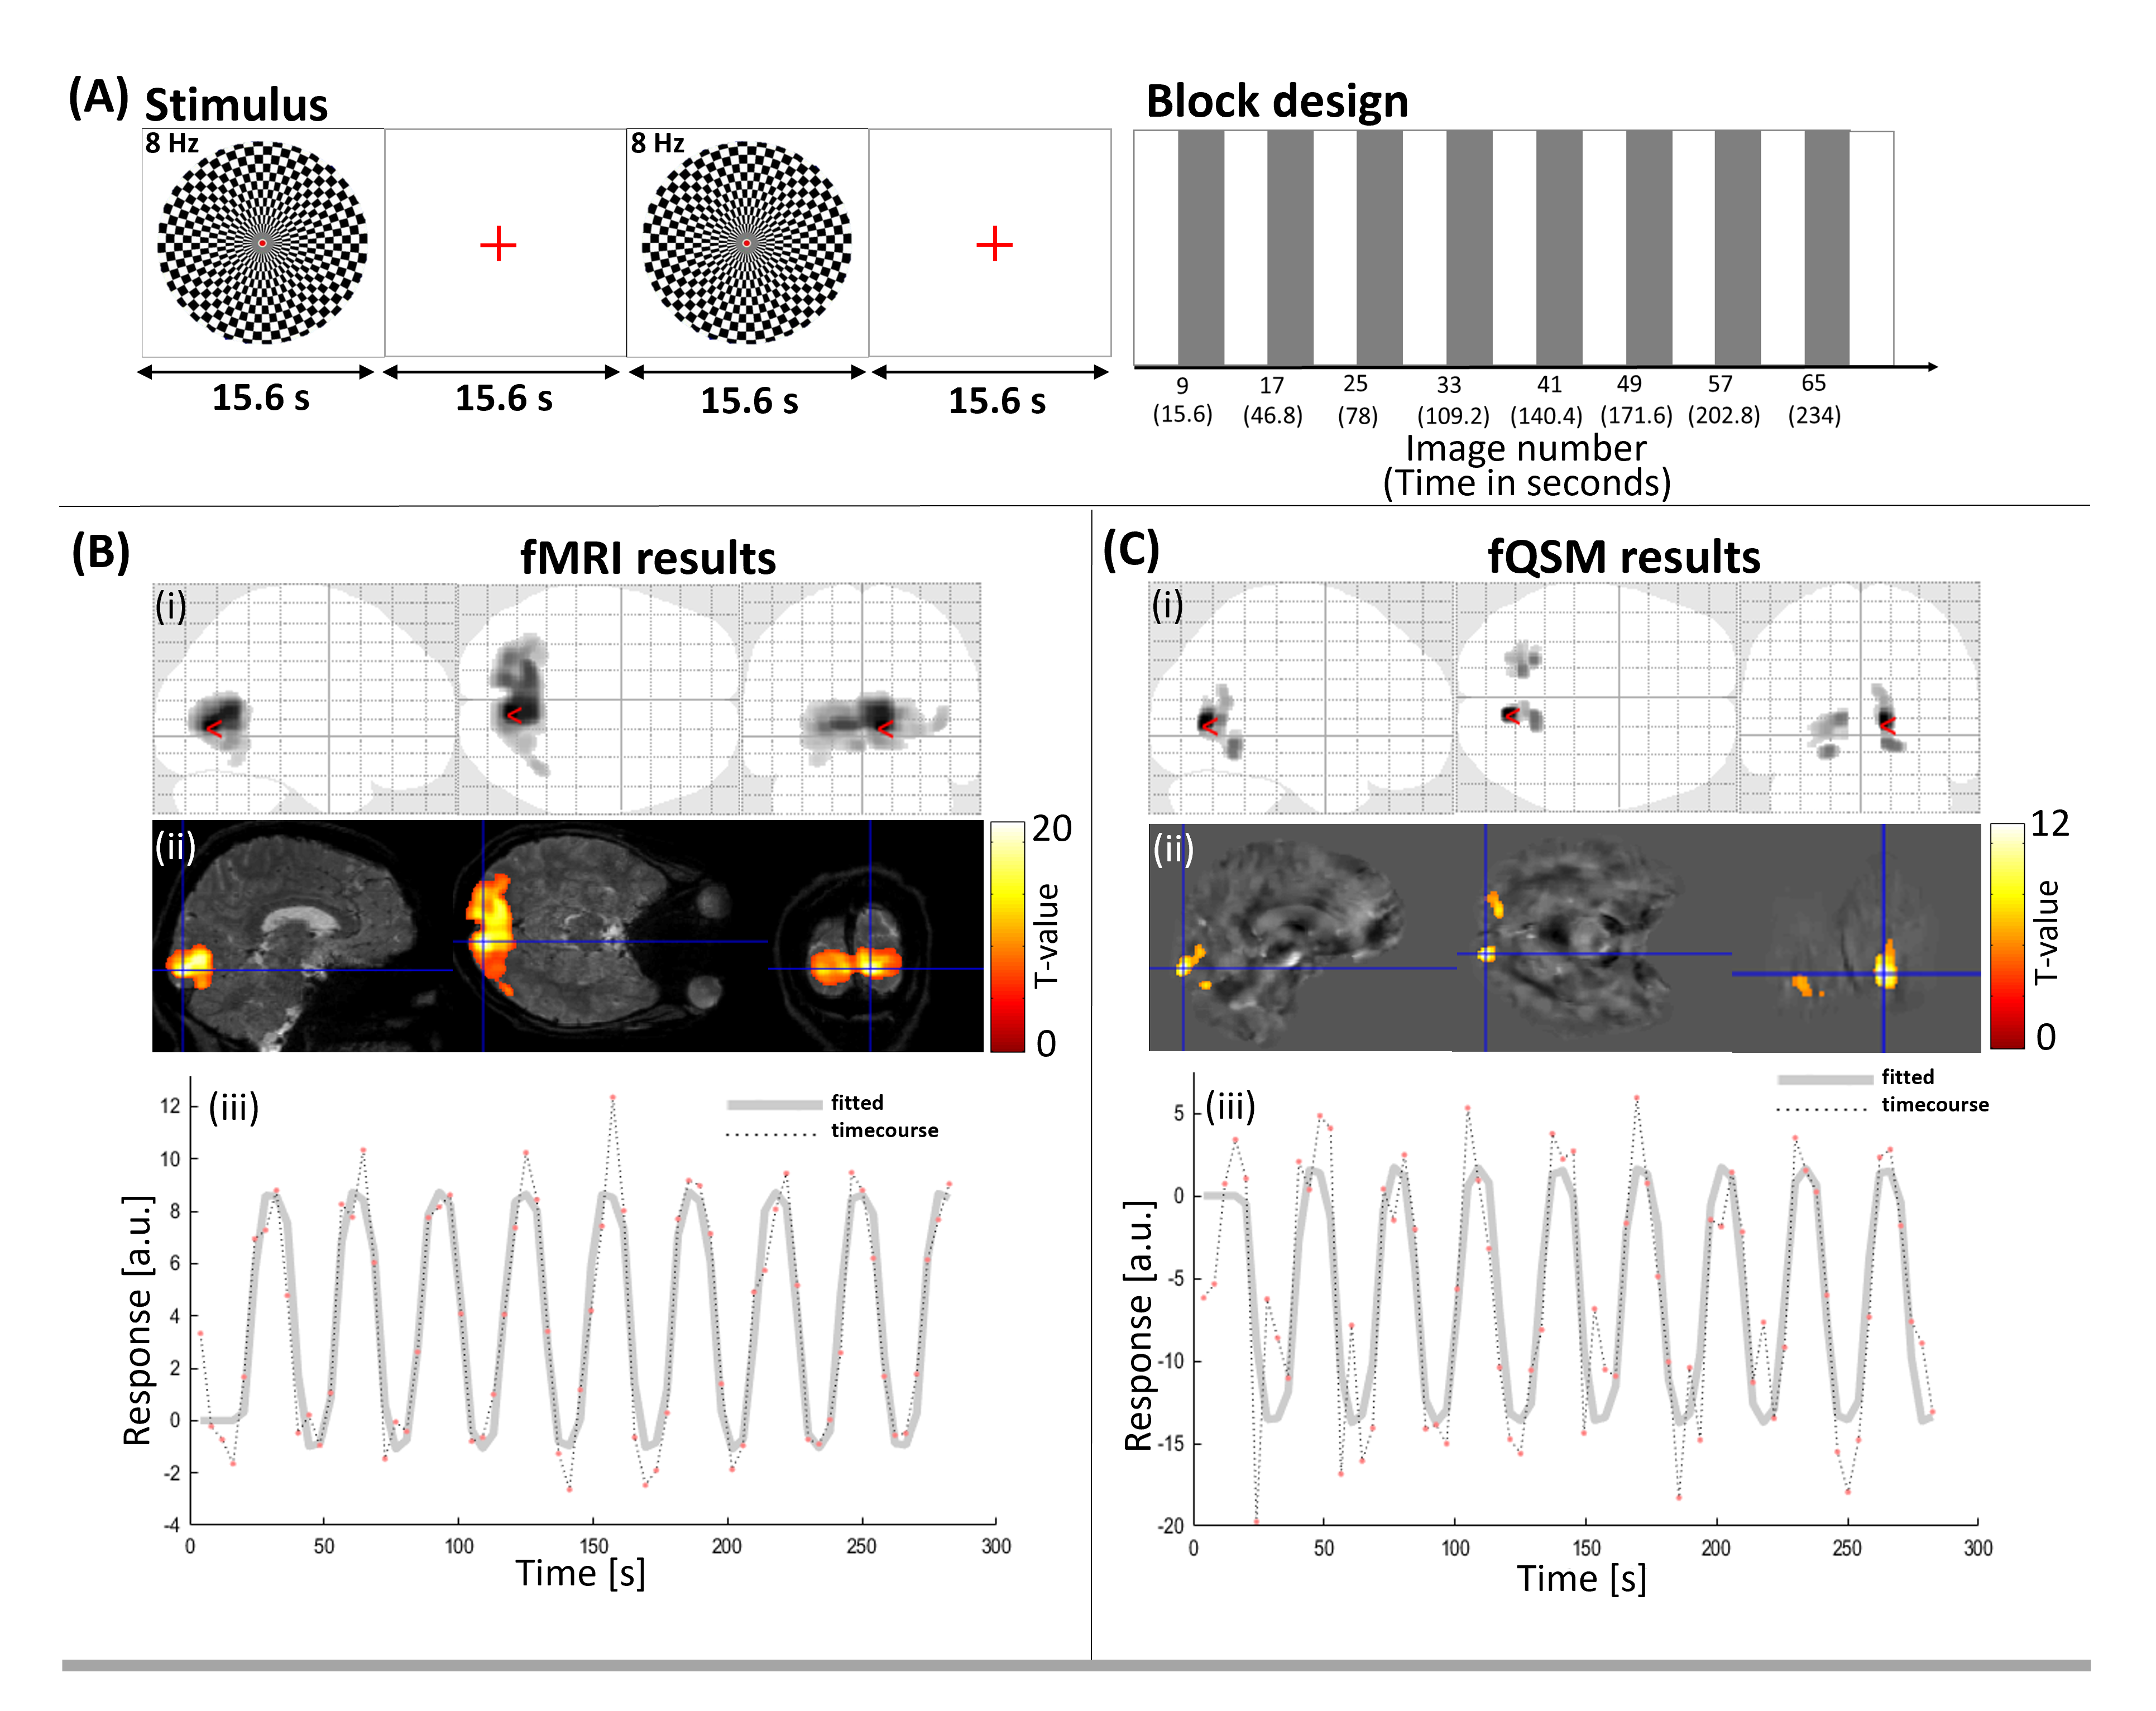
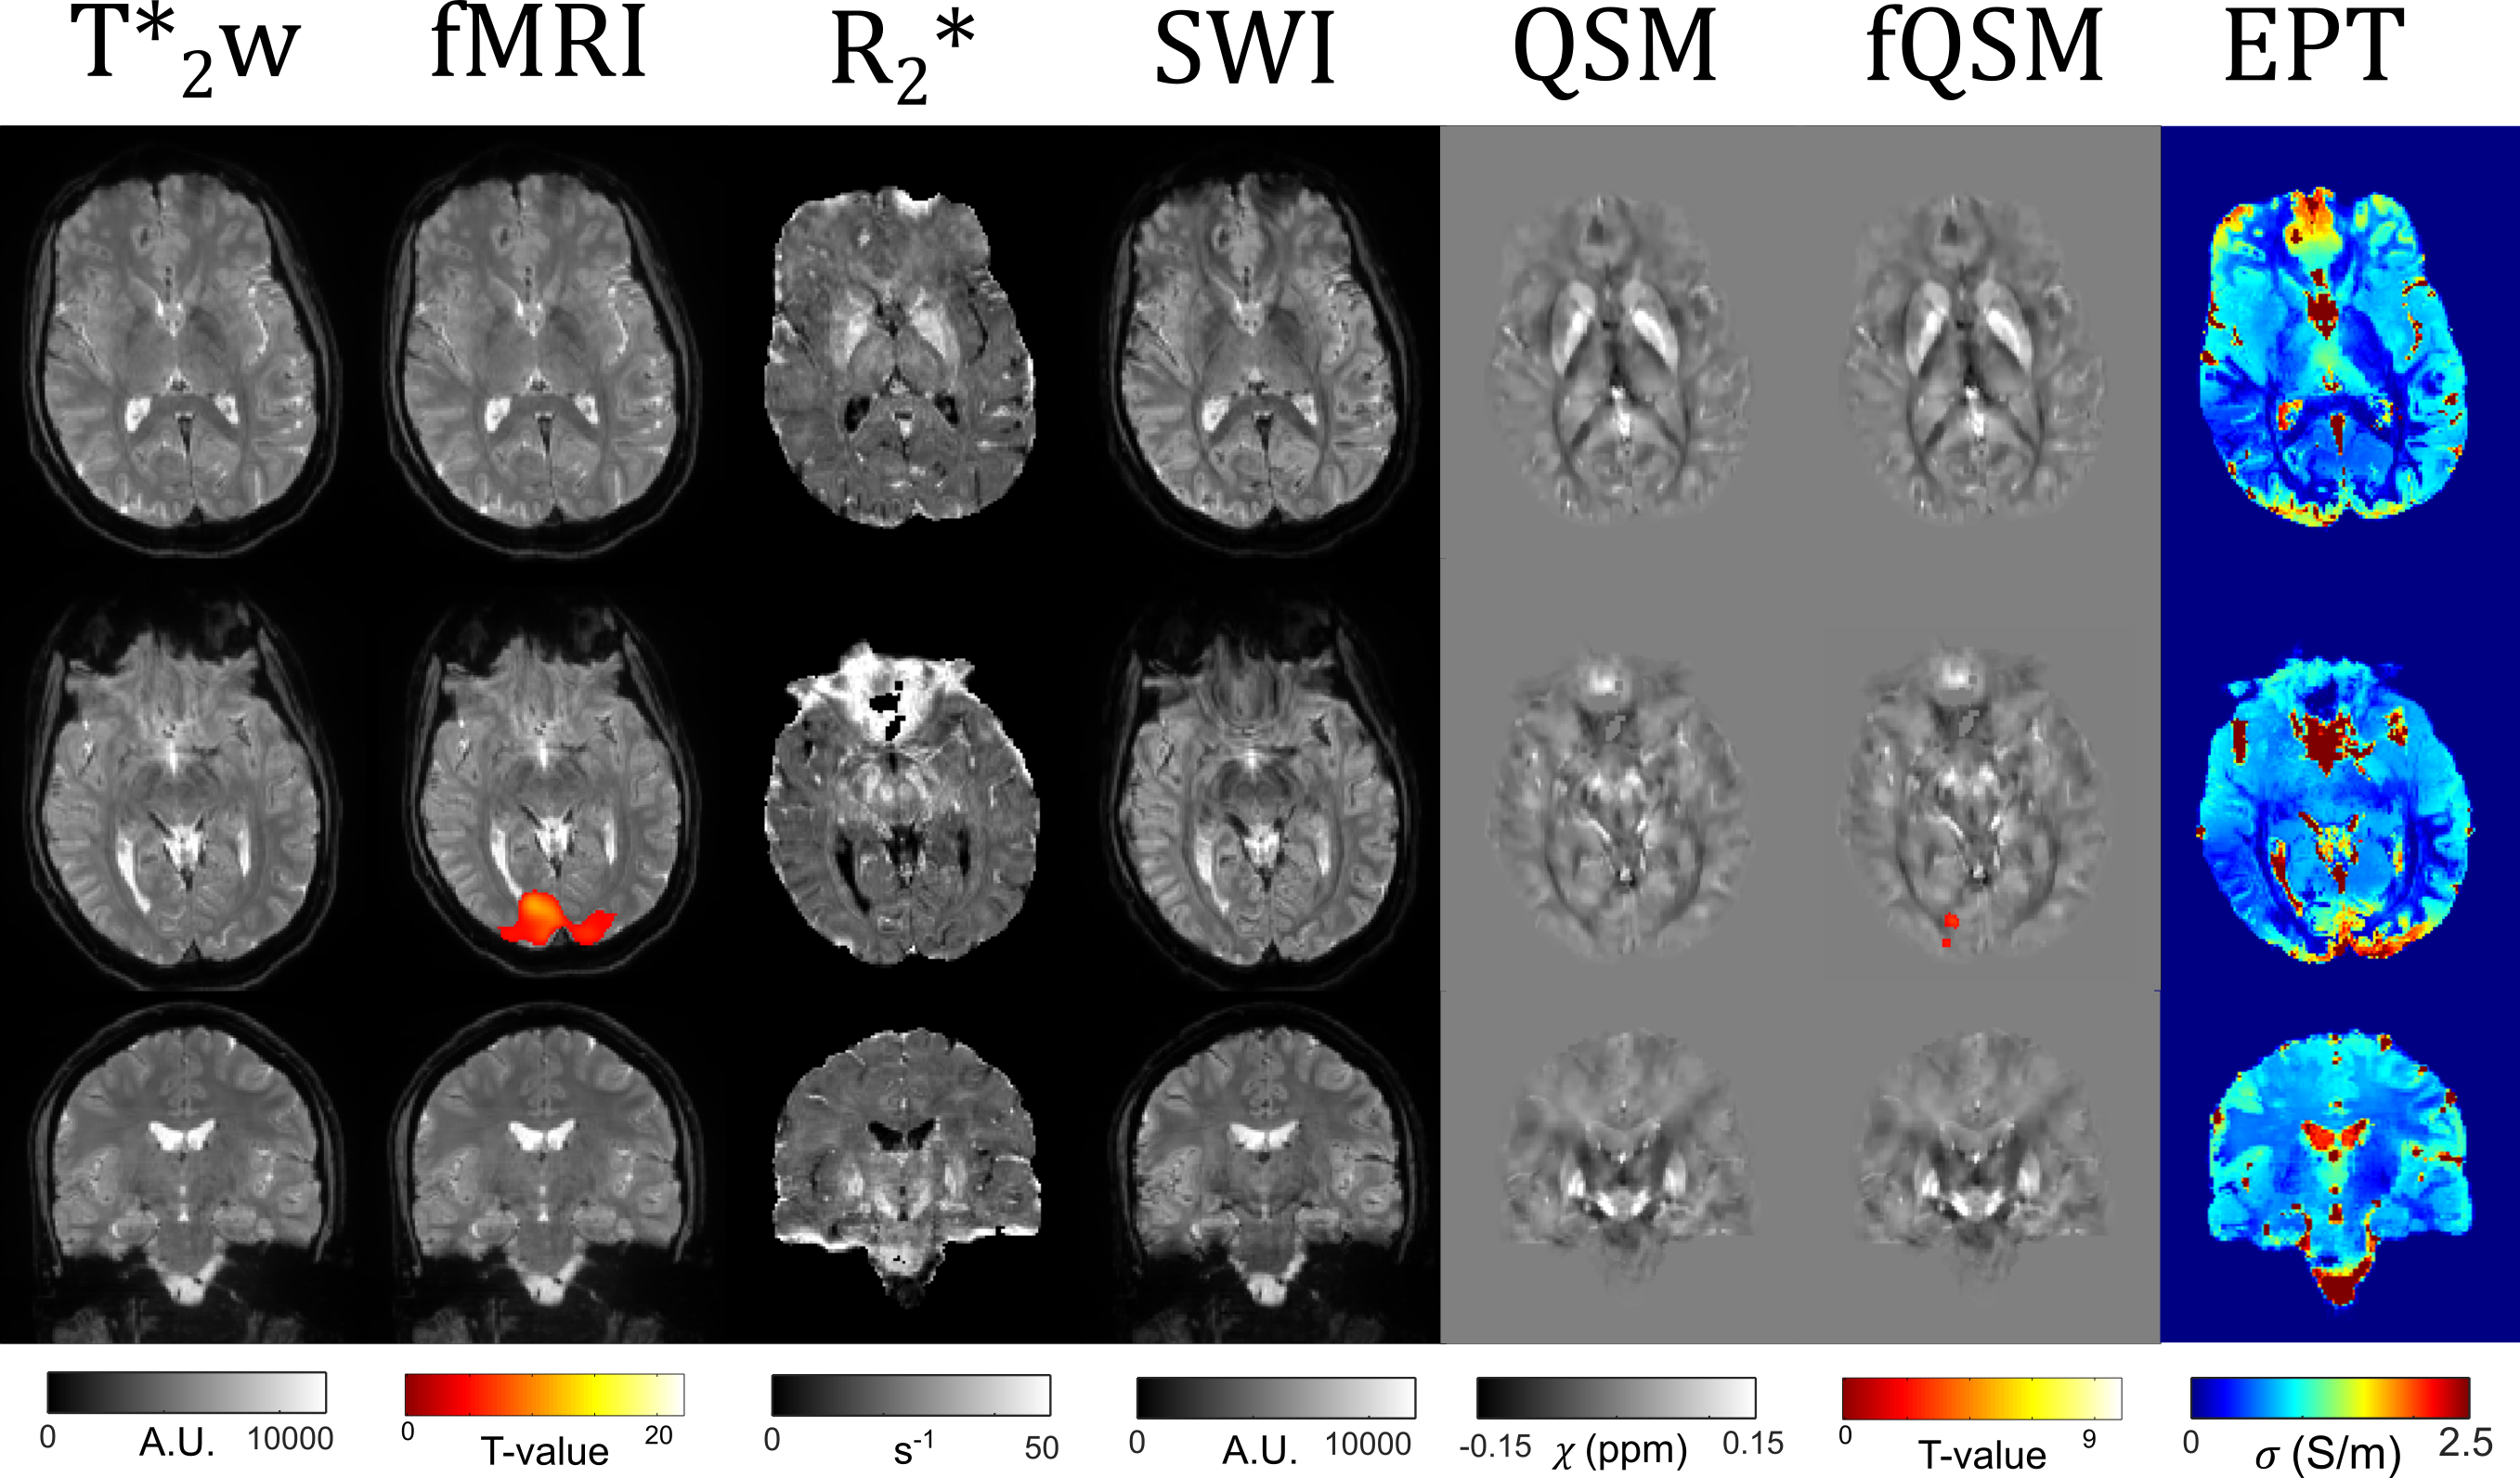
For comparison, 1mm-isotropic 3D-GRE was also acquired with GRAPPA=3; partial Fourier PE1,PE2 = 7/8; TE=4.92, 9.84, 14.76, 19.68, 24.6 ms; TR=30ms; TA=5min38s. A visual stimulus was used to maximise functional activation with a conventional block design (Figure 3A), which consisted of a black and white checkerboard flickering at 8 Hz for 15.6 s, alternating with a rest block of 15.6 s.
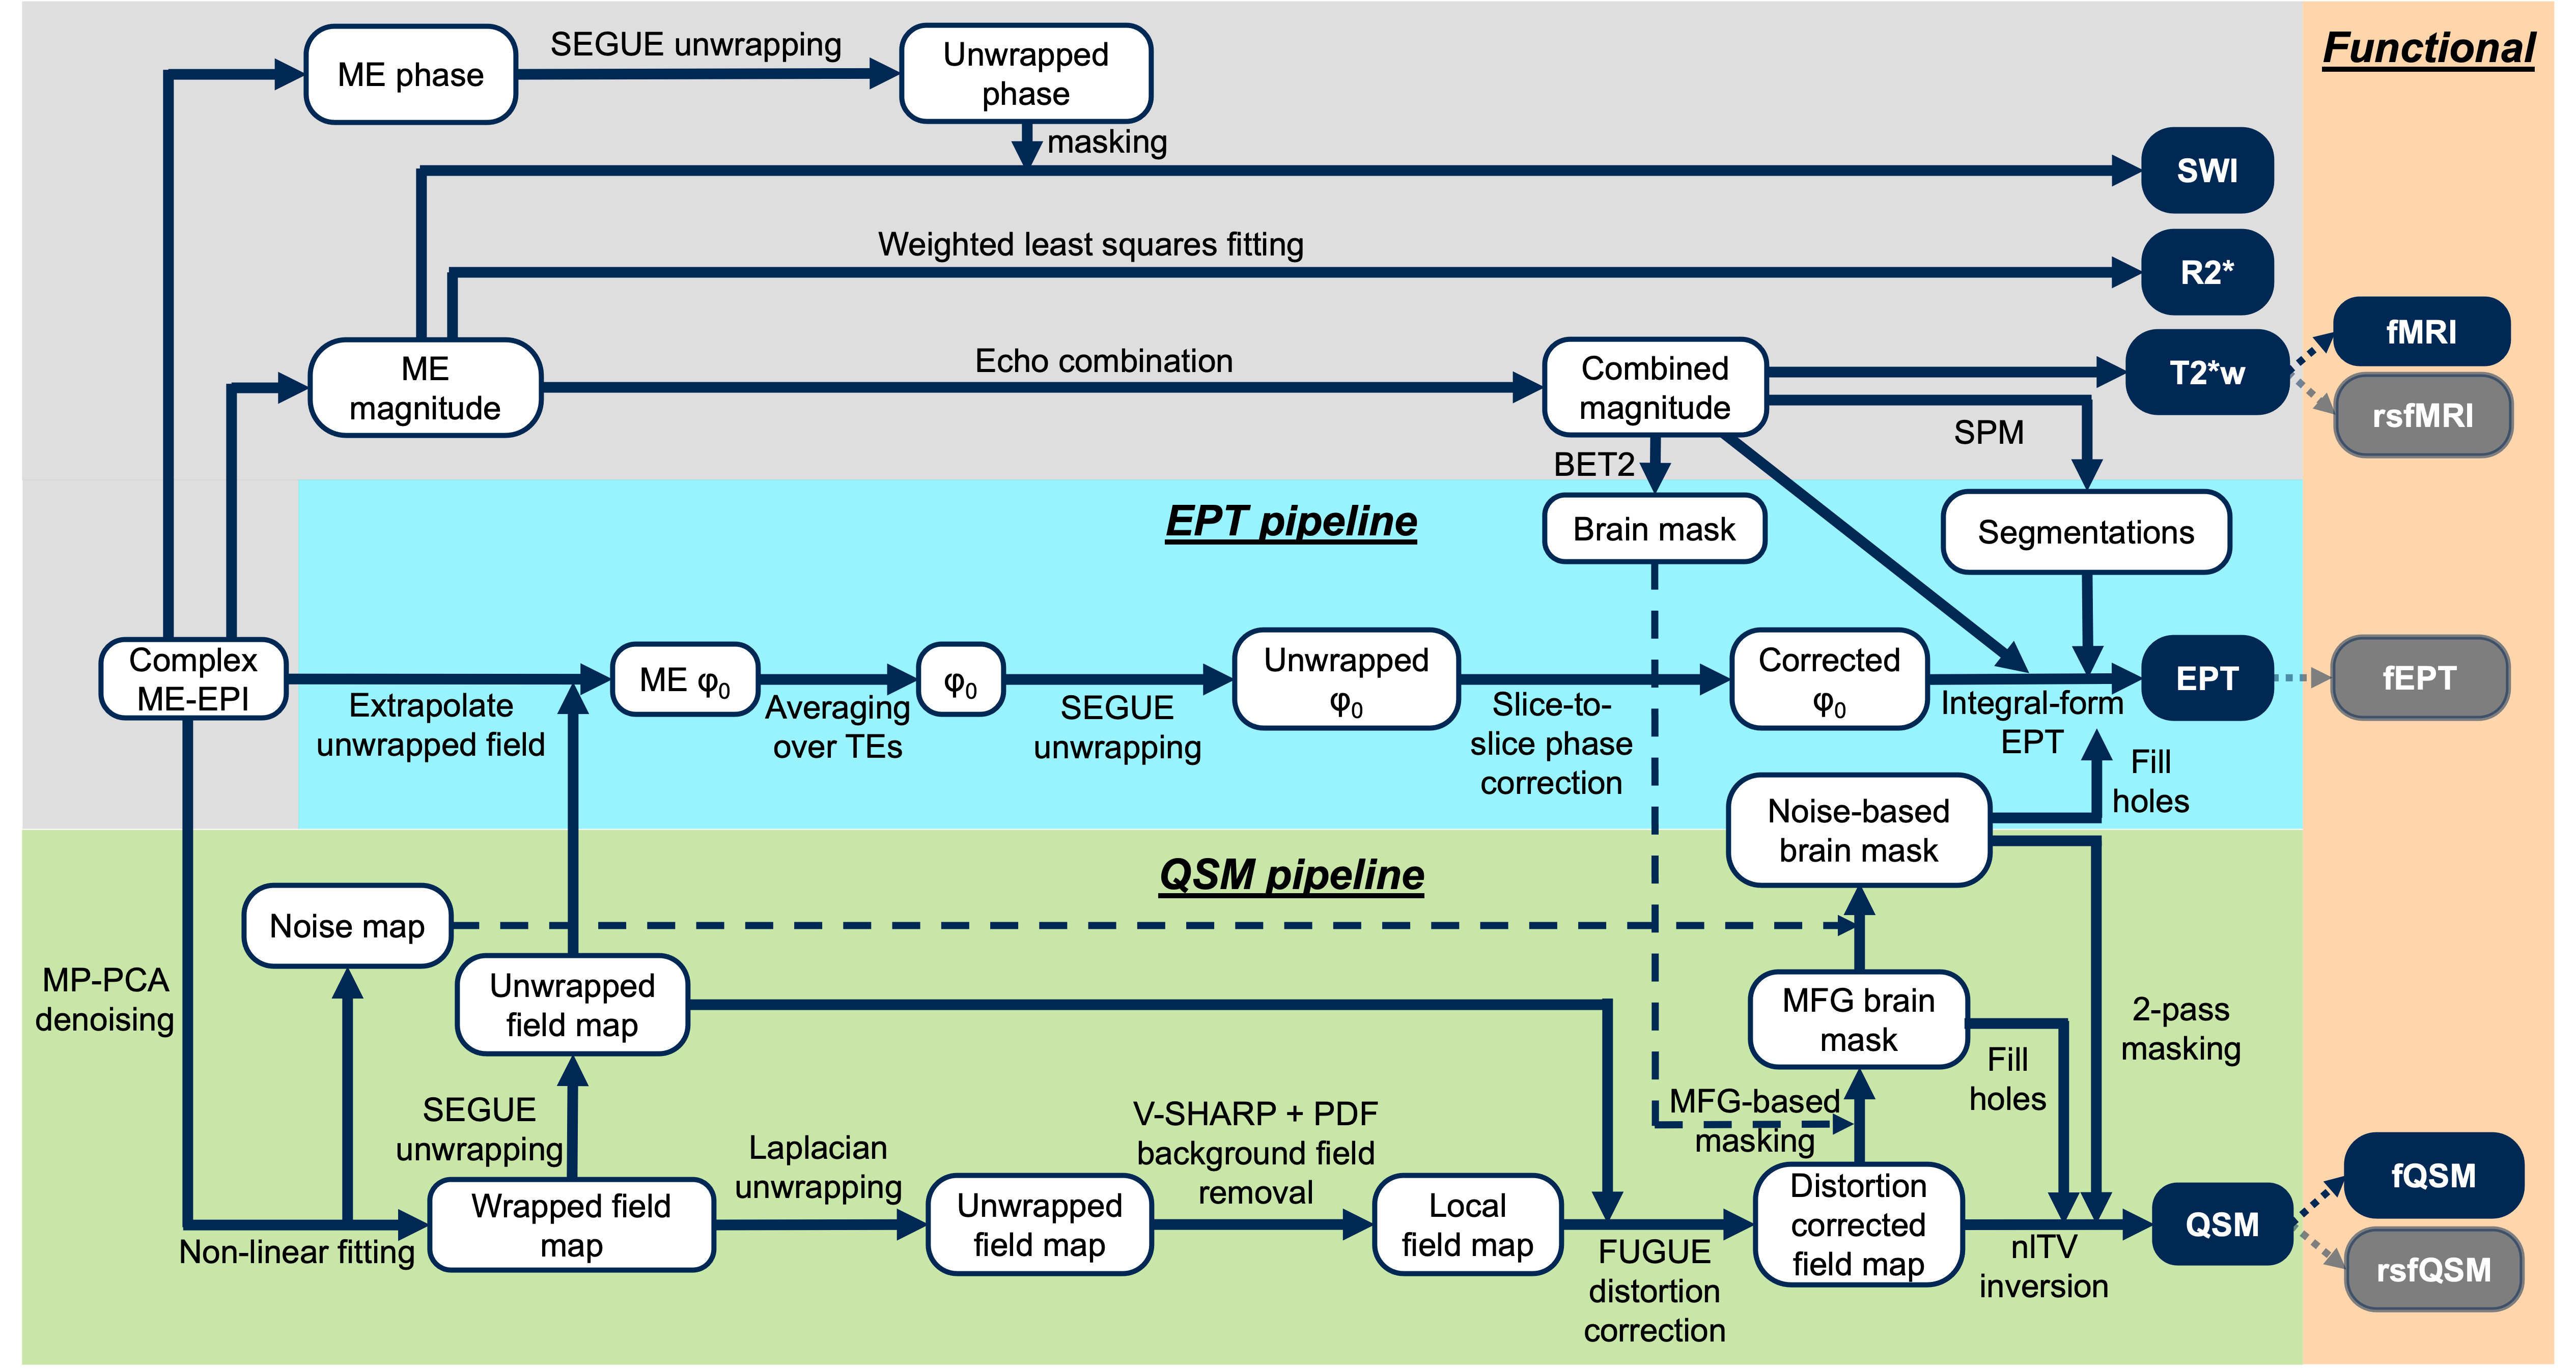
Figure 1 shows a flow chart of all processing pipelines which used MATLAB (Natick, MA, USA).
QSM
For all EPI timepoints, a total field map and a noise map were calculated from a non-linear fit15 of the MP-PCA denoised16–18 complex data over all TEs followed by Laplacian phase unwrapping19, 2D+3D V-SHARP20,21 plus PDF22 to remove residual background fields. Dynamic distortion correction23 used the total field map (unwrapped with SEGUE24) to correct each timepoint’s local field map using FSL FUGUE25. Susceptibility calculation used non-linear total variation (TV)26,27 with (L-curve optimised) regularisation parameter α=2.4×10⁻⁴ and two-pass masking28–30. A temporal-average structural QSM was calculated by averaging QSM reconstructions across all co-registered timepoints. ROIs were segmented using MRICloud31.
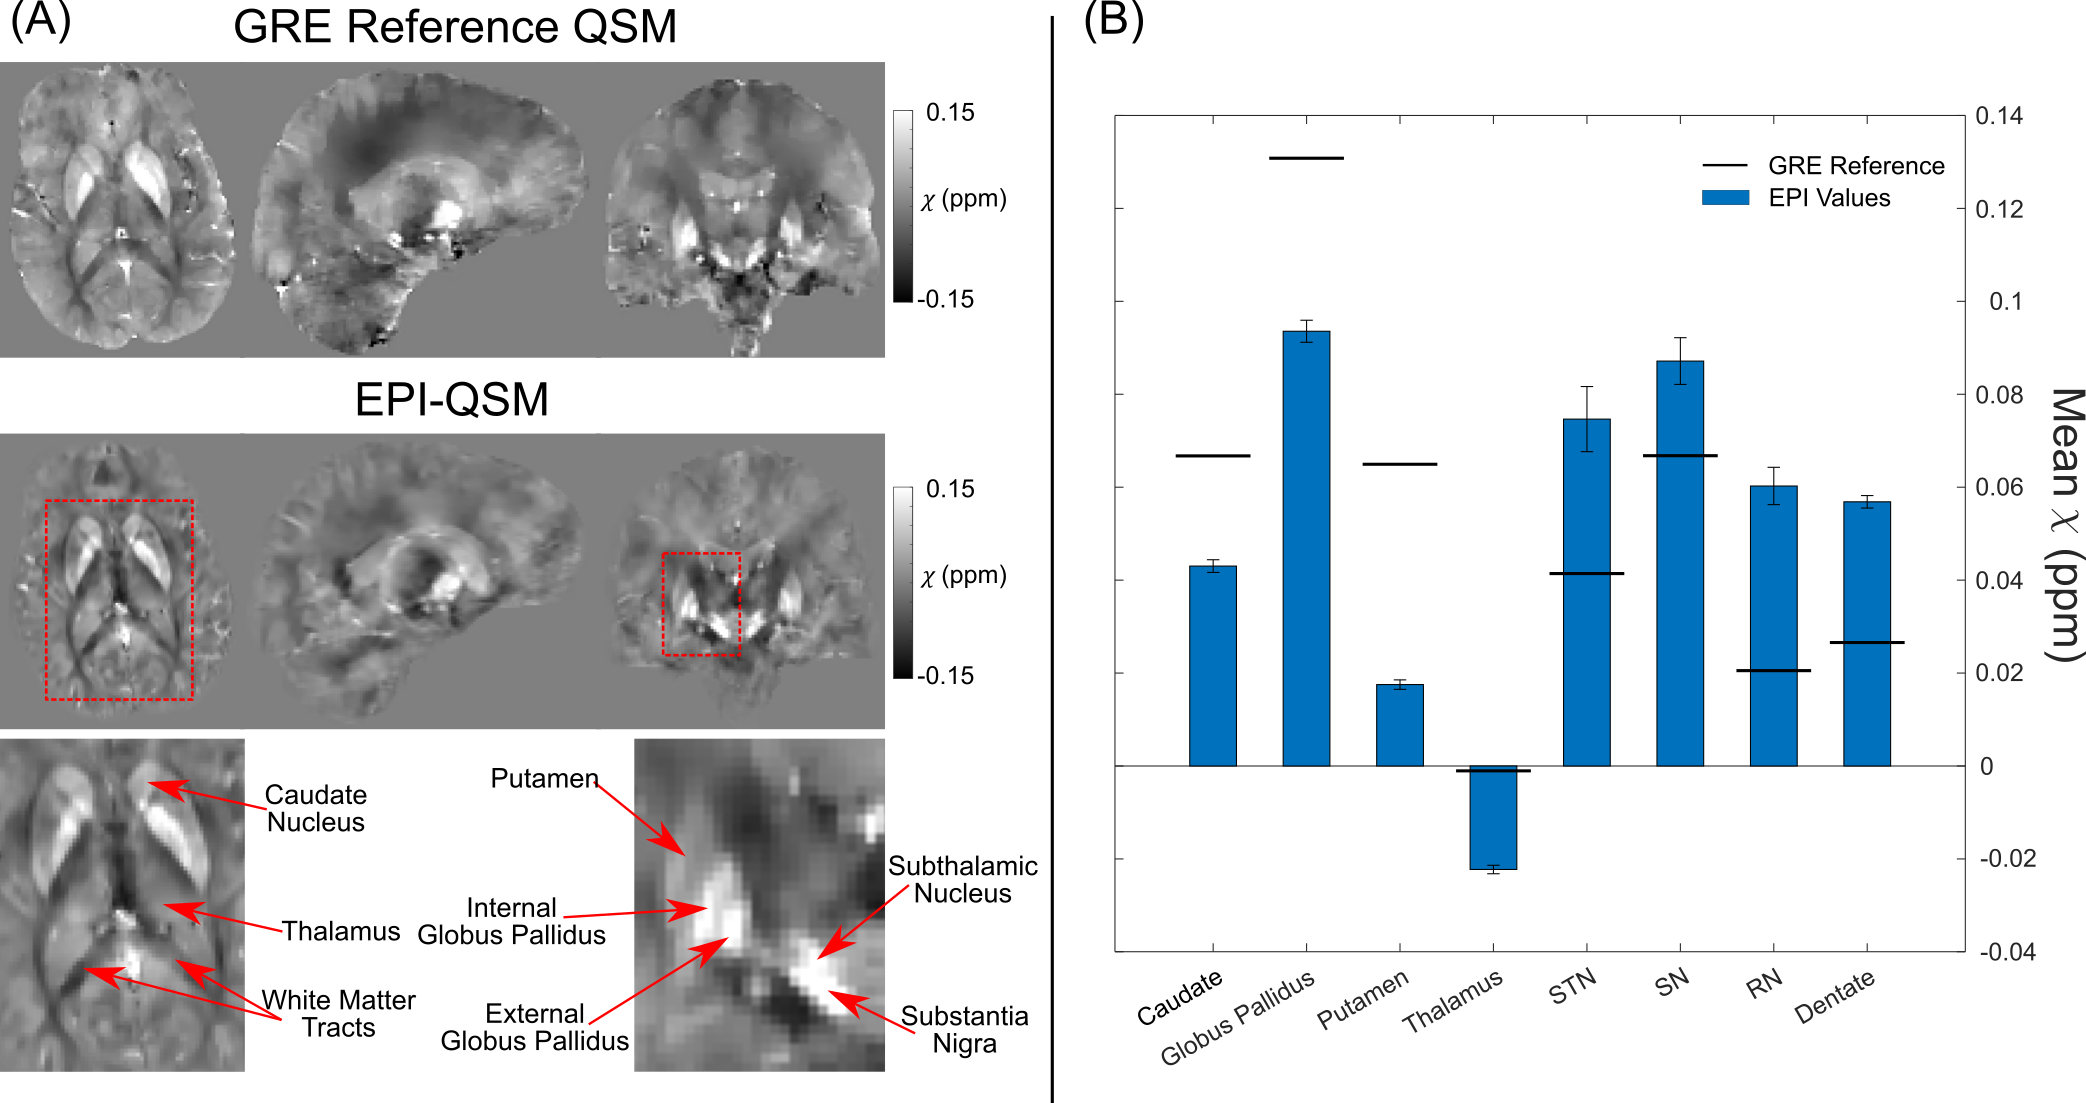
A reference GRE-QSM was calculated using Laplacian phase unwrapping19, PDF background field removal22 and non-linear TV26,27 (α=2×10⁻⁵).
fMRI and fQSM
Using SPM1232,33, normalisation (co-registration) and spatial smoothing with an 8-mm FWHM Gaussian filter was applied to the echo-combined magnitude images34 (for fMRI) and the absolute QSM images35 (for fQSM). SPM default settings for task-based fMRI were used. Significant fMRI and fQSM activations were identified by thresholding t-score maps at p<0.05 with FWE correction and no minimum cluster size.
EPT
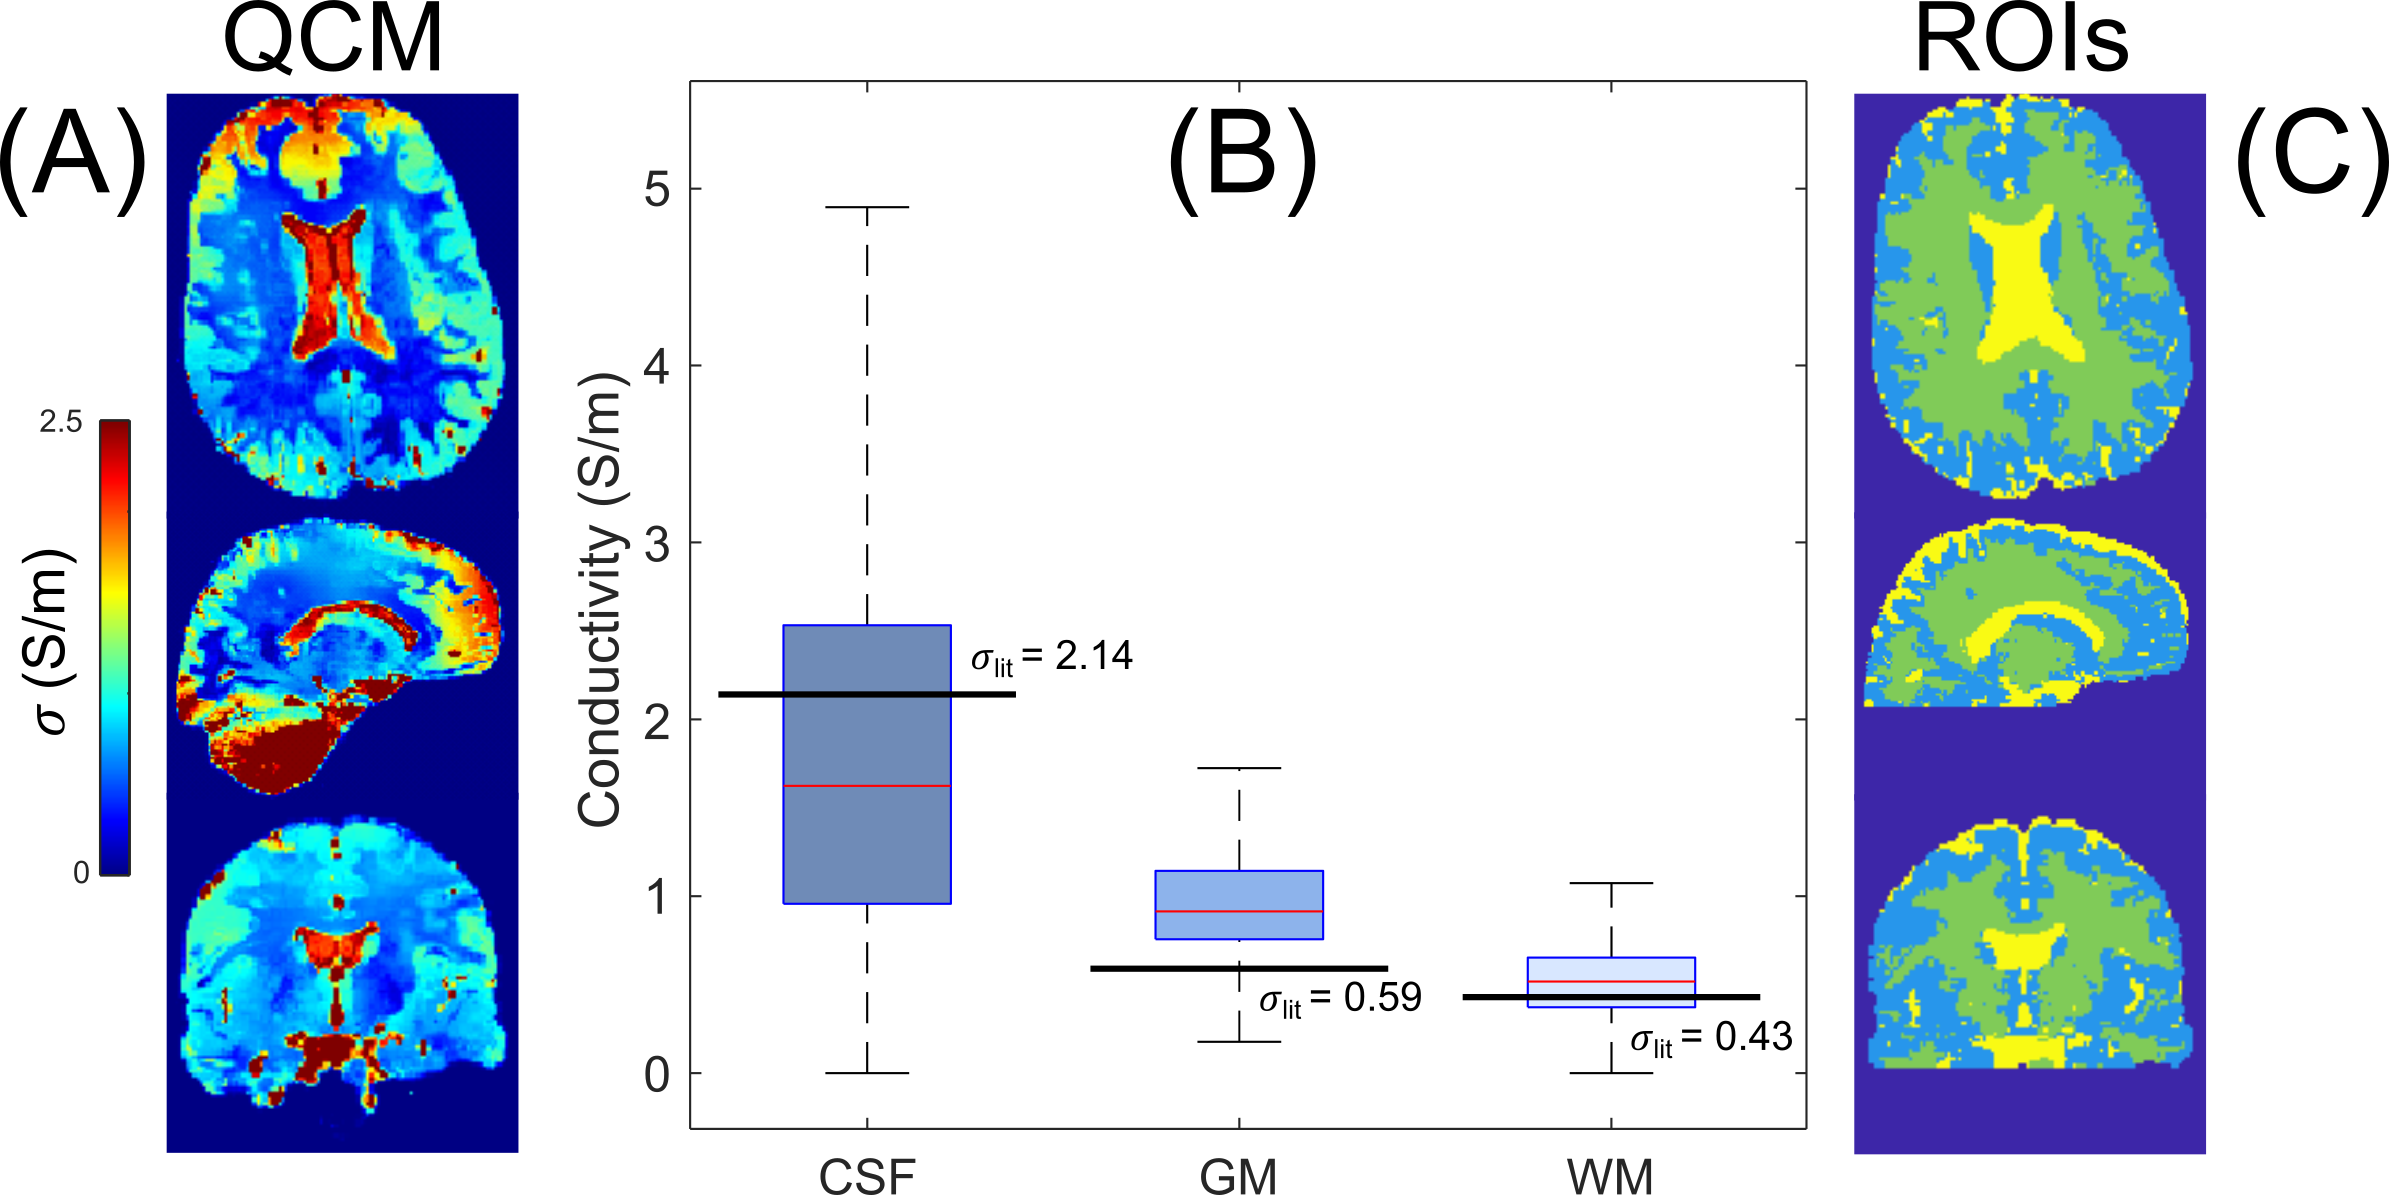
At each timepoint, the phase offset at TE=0 (φ0) was extrapolated from a non-linear fit15 of the complex data over all echoes. φ0 wraps were removed using SEGUE24. Slice-to-slice inconsistencies in φ0 were removed by subtracting the median in each slice. Conductivity calculation used the integral form of the truncated Helmholtz equation36, with magnitude-weighted second-order polynomial fitting37. Large-diameter spherical kernels (differentiation kernel: 21 voxels, surface integral kernel: 41 voxels38) refined using gray matter (GM), white matter (WM), and cerebrospinal fluid (CSF) tissue segmentations37, were used to reduce noise and preserve anatomical structures. The echo-combined magnitude34 was used for magnitude-weighting and segmentation with SPM1232,33. A temporal-average structural conductivity map was calculated by taking the median of non-zero conductivity values in each voxel across all co-registered timepoints.
Results and Discussion
Basal ganglia and brain stem anatomy is well-defined in the temporal average structural QSM reconstruction with clear separation between the internal and external globus pallidus, and the substantia nigra and subthalamic nucleus (Figure 2A). Regional susceptibility values are in line with GRE-QSM reference values (Figure 2B). Significant fMRI and fQSM activations were found in the visual cortex (Figure 3B&C). In agreement with previous studies39–41, fQSM had weaker and less extensive activations than fMRI. Figure 4 shows a high quality temporal average structural EPT reconstruction with good delineation between CSF, GM and WM, except in the cerebellum which was affected by artifacts. Regional conductivity values agreed with literature values42. Future work may involve physiological noise removal and resting-state functional connectivity analysis (Figure 1).Conclusions
We have optimised a single, rapid high-resolution multi-echo 2D-EPI acquisition and processing pipelines to provide high quality QSM and EPT, fMRI and fQSM visual activations and conventional contrasts. This 6 min 15 s acquisition can efficiently provide multi-modal information for clinical studies of neurodegenerative diseases.Acknowledgements
OK was supported by EPSRC Doctoral Training Partnership (EP/R513143/1). PF, JN, OA, JL and KS are supported by European Research Council Consolidator Grant DiSCo MRI SFN 770939.References
- Eskreis-Winkler S, Zhang Y, Zhang J, et al. The clinical utility of QSM: disease diagnosis, medical management, and surgical planning. NMR Biomed. 2017;30(4). doi:10.1002/nbm.3668
- Tha KK, Katscher U, Yamaguchi S, et al. Noninvasive electrical conductivity measurement by MRI: a test of its validity and the electrical conductivity characteristics of glioma. Eur Radiol. 2018;28(1):348-355. doi:10.1007/s00330-017-4942-5
- Liao Y, Lechea N, Magill AW, Worthoff WA, Gras V, Shah NJ. Correlation of quantitative conductivity mapping and total tissue sodium concentration at 3T/4T. Magn Reson Med. 2019;82(4):1518-1526. doi:10.1002/mrm.27787
- Wang K, Liang M, Wang L, et al. Altered functional connectivity in early Alzheimer’s disease: A resting-state fMRI study. Hum Brain Mapp. 2007;28(10):967-978. doi:10.1002/hbm.20324
- Damoiseaux JS. Resting-state fMRI as a biomarker for Alzheimer’s disease. Alzheimers Res Ther. 2012;4(3). doi:10.1186/alzrt106
- Wolters AF, van de Weijer SCF, Leentjens AFG, Duits AA, Jacobs HIL, Kuijf ML. Resting-state fMRI in Parkinson’s disease patients with cognitive impairment: A meta-analysis. Parkinsonism Relat Disord. 2019;62:16-27. doi:10.1016/j.parkreldis.2018.12.016
- Park S, Jung SM, Lee MB, et al. Application of High-Frequency Conductivity Map Using MRI to Evaluate It in the Brain of Alzheimer’s Disease Patients. Front Neurol. 2022;13. doi:10.3389/fneur.2022.872878
- Kim DH, Choi N, Gho SM, Shin J, Liu C. Simultaneous imaging of in vivo conductivity and susceptibility. Magn Reson Med. 2014;71(3):1144-1150. doi:10.1002/mrm.24759
- Sun H, Seres P, Wilman AH. Structural and functional quantitative susceptibility mapping from standard fMRI studies. NMR Biomed. 2017;30(4). doi:10.1002/nbm.3619
- Sun H, Wilman AH. Quantitative susceptibility mapping using single-shot echo-planar imaging. Magn Reson Med. 2015;73(5):1932-1938. doi:10.1002/mrm.25316
- Özbay PS, Rossi R, Warnock G, Kuhn F, Pruessmann KP, Nanz D. Comparing Functional QSM and BOLD-fMRI by Statistical Parametric Mapping (SPM). 3rd Phase Contrast & QSM Workshop Duke University, Durham, USA. 2014;325(2012):3170.
- Kiersnowski OC, Fuchs P, Wastling SJ, Thornton JS, Shmueli K. Simultaneous Multi-Slice Acceleration of Multi-Echo EPI Provides Rapid and Accurate Quantitative Susceptibility Mapping. In: In Proceedings of ISMRM & SMRT Annual Meeting . ; 2022.
- Biondetti E, Karsa A, Thomas DL, Shmueli K. Investigating the accuracy and precision of TE-dependent versus multi-echo QSM using Laplacian-based methods at 3 T. Magn Reson Med. 2020;84(6):3040-3053. doi:10.1002/mrm.28331
- Center for Magnetic Resonance Research Department of Radiology. Multi-Band Accelerated EPI Pulse Sequences. https://www.cmrr.umn.edu/multiband/
- Liu T, Wisnieff C, Lou M, Chen W, Spincemaille P, Wang Y. Nonlinear formulation of the magnetic field to source relationship for robust quantitative susceptibility mapping. Magn Reson Med. 2013;69(2):467-476. doi:10.1002/mrm.24272
- Veraart J, Novikov DS, Christiaens D, Ades-aron B, Sijbers J, Fieremans E. Denoising of diffusion MRI using random matrix theory. Neuroimage. 2016;142:394-406. doi:10.1016/j.neuroimage.2016.08.016
- Does MD, Olesen JL, Harkins KD, et al. Evaluation of principal component analysis image denoising on multi-exponential MRI relaxometry. Magn Reson Med. 2019;81(6):3503-3514. doi:10.1002/mrm.27658
- Doniza L, Stern N, Radunsky D, et al. MP-PCA Image Denoising Techniques for High Resolution Quantitative Susceptibility Mapping (QSM) of the Human Brain In Vivo. In: In Proceedings of ISMRM & SMRT Annual Meeting . ; 2023.
- Schofield MA, Zhu Y. Fast phase unwrapping algorithm for interferometric applications. Opt Lett. 2003;28(14):1194. doi:10.1364/ol.28.001194
- Wei H, Zhang Y, Gibbs E, Chen NK, Wang N, Liu C. Joint 2D and 3D phase processing for quantitative susceptibility mapping: application to 2D echo-planar imaging. NMR Biomed. 2017;30(4). doi:10.1002/nbm.3501
- Li W, Wu B, Liu C. Quantitative susceptibility mapping of human brain reflects spatial variation in tissue composition. Neuroimage. 2011;55:1645-1656. doi:10.1016/j.neuroimage.2010.11.088
- Liu T, Khalidov I, de Rochefort L, et al. A novel background field removal method for MRI using projection onto dipole fields (PDF). NMR Biomed. 2011;24(9):1129-1136. doi:10.1002/nbm.1670
- Visser E, Poser BA, Barth M, Zwiers MP. Reference-free unwarping of EPI data using dynamic off-resonance correction with multiecho acquisition (DOCMA). Magn Reson Med. 2012;68(4):1247-1254. doi:10.1002/mrm.24119
- Karsa A, Shmueli K. SEGUE: A Speedy rEgion-Growing Algorithm for Unwrapping Estimated Phase. IEEE Trans Med Imaging. 2019;38(6):1347-1357. doi:10.1109/TMI.2018.2884093
- Jenkinson M, Beckmann CF, Behrens TEJ, Woolrich MW, Smith SM. FSL. Neuroimage. 2012;62(2):782-790. doi:10.1016/j.neuroimage.2011.09.015
- Milovic C, Bilgic B, Zhao B, Acosta-Cabronero J, Tejos C. Fast nonlinear susceptibility inversion with variational regularization. Magn Reson Med. 2018;80(2):814-821. doi:10.1002/mrm.27073
- FANSI Toolbox. https://gitlab.com/cmilovic/FANSI-toolbox
- Karsa A, Shmueli K. A New, Simple Two-Pass Masking Approach for Streaking Artifact Removal in Any QSM Pipeline (Abstract #2462). In: In Proceedings of ISMRM & SMRT Annual Meeting . ; 2021.
- Karsa A, Punwani S, Shmueli K. An optimized and highly repeatable MRI acquisition and processing pipeline for quantitative susceptibility mapping in the head-and-neck region. Magn Reson Med. 2020;84(6):3206-3222. doi:10.1002/mrm.28377
- Kiersnowski OC, Shmueli K. A Novel Gradient-Based Thresholding Method to Improve Brain Masking for Quantitative Susceptibility Mapping. In: British & Irish Chapter of the ISMRM Post-Graduate Symposium. ; 2023.
- Mori S, Wu D, Ceritoglu C, et al. MRICloud: Delivering high-throughput MRI neuroinformatics as cloud-based software as a service. Comput Sci Eng. 2016;18(5):21-35. doi:10.1109/MCSE.2016.93
- Ashburner J. SPM: A history. Neuroimage. 2012;62(2):791-800. doi:10.1016/j.neuroimage.2011.10.025
- Friston KJ, Holmes AP, Worsley KJ, Poline J ‐P, Frith CD, Frackowiak RSJ. Statistical parametric maps in functional imaging: A general linear approach. Hum Brain Mapp. 1994;2(4):189-210. doi:10.1002/hbm.460020402
- Poser BA, Norris DG. Investigating the benefits of multi-echo EPI for fMRI at 7 T. Neuroimage. 2009;45(4):1162-1172. doi:10.1016/j.neuroimage.2009.01.007
- Acosta-Cabronero J, Betts MJ, Cardenas-Blanco A, Yang S, Nestor PJ. In vivo MRI mapping of brain iron deposition across the adult lifespan. Journal of Neuroscience. 2016;36(2):364-374. doi:10.1523/JNEUROSCI.1907-15.2016
- Voigt T, Katscher U, Doessel O. Quantitative conductivity and permittivity imaging of the human brain using electric properties tomography. Magn Reson Med. 2011;66(2):456-466. doi:10.1002/mrm.22832
- Karsa A, Shmueli K. New Approaches for Simultaneous Noise Suppression and Edge Preservation to Achieve Accurate Quantitative Conductivity Mapping in Noisy Images. In: In Proceedings of ISMRM & SMRT Annual Meeting . ; 2021.
- Karsa A, Fuchs P, Shmueli K. Optimal Kernel Radii for Calculating the Derivatives of Noisy B1 Phase for Accurate Phase-Based Quantitative Conductivity Mapping. In: In Proceedings of ISMRM & SMRT Annual Meeting . ; 2021.
- Balla DZ, Sanchez-Panchuelo RM, Wharton SJ, et al. Functional quantitative susceptibility mapping (fQSM). Neuroimage. 2014;100:112-124. doi:10.1016/j.neuroimage.2014.06.011
- Sun H, Seres P, Wilman AH. Structural and functional quantitative susceptibility mapping from standard fMRI studies. NMR Biomed. 2017;30(4). doi:10.1002/nbm.3619
- Özbay PS, Warnock G, Rossi C, et al. Probing neuronal activation by functional quantitative susceptibility mapping under a visual paradigm: A group level comparison with BOLD fMRI and PET. Neuroimage. 2016;137:52-60. doi:10.1016/j.neuroimage.2016.05.013
- Gabriel S, Lau RW, Gabriel C. The Dielectric Properties of Biological Tissues: II. Measurements in the Frequency Range 10 Hz to 20 GHz. Vol 41.; 1996.
Figures