0187
Distinguishing microgliosis and tau deposition in the mouse brain using paramagnetic and diamagnetic susceptibility source separation1Department of Biomedical Engineering, Johns Hopkins University, Baltimore, MD, United States, 2Department of Psychiatry and Behavioral Sciences, Johns Hopkins University School of Medicine, Baltimore, MD, United States, 3Department of Neuroscience, Johns Hopkins University School of Medicine, Baltimore, MD, United States, 4Department of Radiology and Radiological Science, Johns Hopkins University School of Medicine, Baltimore, MD, United States
Synopsis
Keywords: Susceptibility/QSM, Microstructure, Brain
Motivation: Susceptibility source separation methods to disentangle sub-voxel paramagnetic and diamagnetic susceptibility sources may provide higher specificity to distinguish tissue microstructural alterations.
Goal(s): Our goal was to investigate sub-cellular histopathological alterations in an established tauopathy mouse model using quantitative susceptibility source separation.
Approach: Brains of PS19 mice and wild-type controls (n = 5 each) were imaged at 11.7 T. We used the DECOMPOSE-QSM model to calculate paramagnetic and diamagnetic component susceptibility maps.
Results: Susceptibility maps revealed significant localized alterations in specific regions of the hippocampus and entorhinal cortex, which were found to correspond to regional microgliosis and tau deposition seen with immunohistology.
Impact: Our findings demonstrate unique sensitivity of paramagnetic and diamagnetic susceptibility changes to distinguish regional microgliosis and tau deposition in the brain. Quantitative magnetic susceptibility source separation may therefore provide a sensitive method to assess sub-cellular histopathological alterations in tauopathies.
Introduction
Quantitative susceptibility mapping is sensitive to the molecular and cellular composition of brain tissue1,2. Recently, susceptibility source separation methods3-7 to disentangle para- and diamagnetic source distributions at the sub-voxel level have been proposed, which may provide a more specific probe of tissue microstructural alterations. Tauopathies, like Alzheimer’s disease, involve complex changes in the brain including phosphorylated-tau deposits and microgliosis. Here, we investigate the potential of quantitative susceptibility source separation to distinguish sub-cellular alterations in an established tauopathy mouse model8. The results reveal unique sensitivity of paramagnetic and diamagnetic susceptibility source separation maps to distinct histopathological alterations.Methods
Adult PS19 mice, which exhibit tau pathology in the brain, were used in this study. Brains of 9-month old PS19 mice (referred to as Tau mice) (n = 5) and age-matched wild-type (WT) controls (n = 5) were perfused with 4% PFA. MRI was performed on an 11.7 T Bruker scanner using a 20-mm birdcage transceiver coil. A 3D monopolar multi-gradient-echo sequence was used for acquisition, with flip-angle 30°, 8 echoes, TE1/ΔTE/TR = 4/3.8/100 ms, receiver bandwidth = 70 kHz, and isotropic spatial resolution of 70 µm.Phase maps were unwrapped using 3D Laplacian-based unwrapping9, followed by V-SHARP10 background removal. Dipole inversion to calculate quantitative susceptibility maps was performed using the STAR-QSM method in StiSuite11. To estimate sub-voxel susceptibility source contributions, the synthesized local complex signal was fit to the DECOMPOSE-QSM three-pool model4, implemented in Matlab;
$$S(t;C_0,C_+,C_-,χ_+,χ_-,R_{2,0}^*)=C_0e^{-R_{2,0}^*t}+C_+e^{-(R_{2,0}^*+aχ_+-i\frac{2}{3}χ_+γB_0)t}+C_-e^{-(R_{2,0}^*-aχ_--i\frac{2}{3}χ_-γB_0)t}$$
where $$$C_0,C_+,C_-$$$ represent concentrations of reference, paramagnetic, and diamagnetic susceptibility components, respectively. Paramagnetic (PCS) and diamagnetic (DCS) component susceptibility maps were calculated according to Ref. 4. Group-wise averaged templates of the Tau and WT mouse brains were generated using diffeomorphic registrations based on the sum of squared magnitude images. For structural annotation, we nonlinearly registered the Allen reference atlas12 to the average group templates. Following MRI, the brains were processed for histology, and immunostained with antibodies for microglia (iba1) and p-tau (AT8).
Results
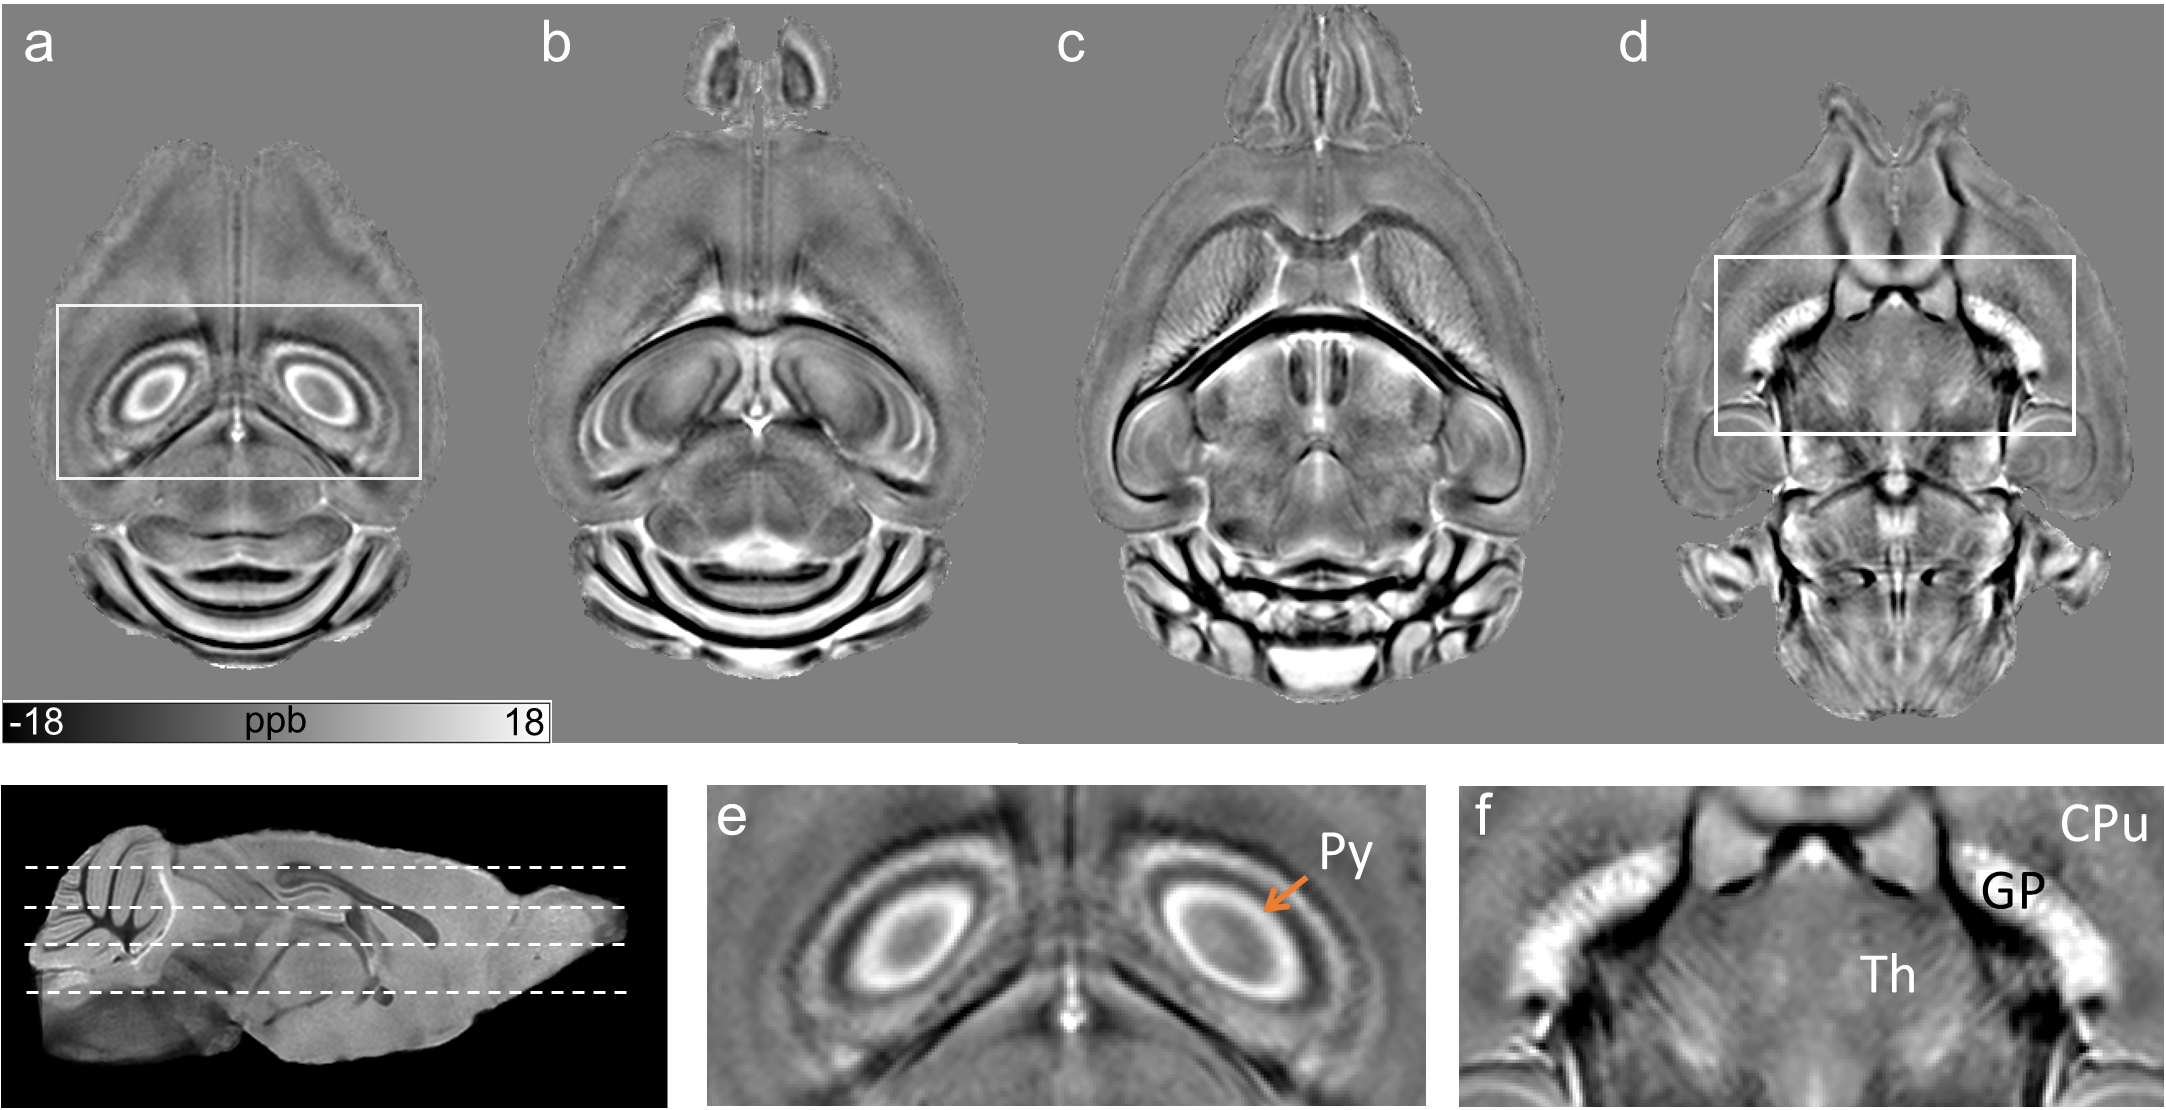
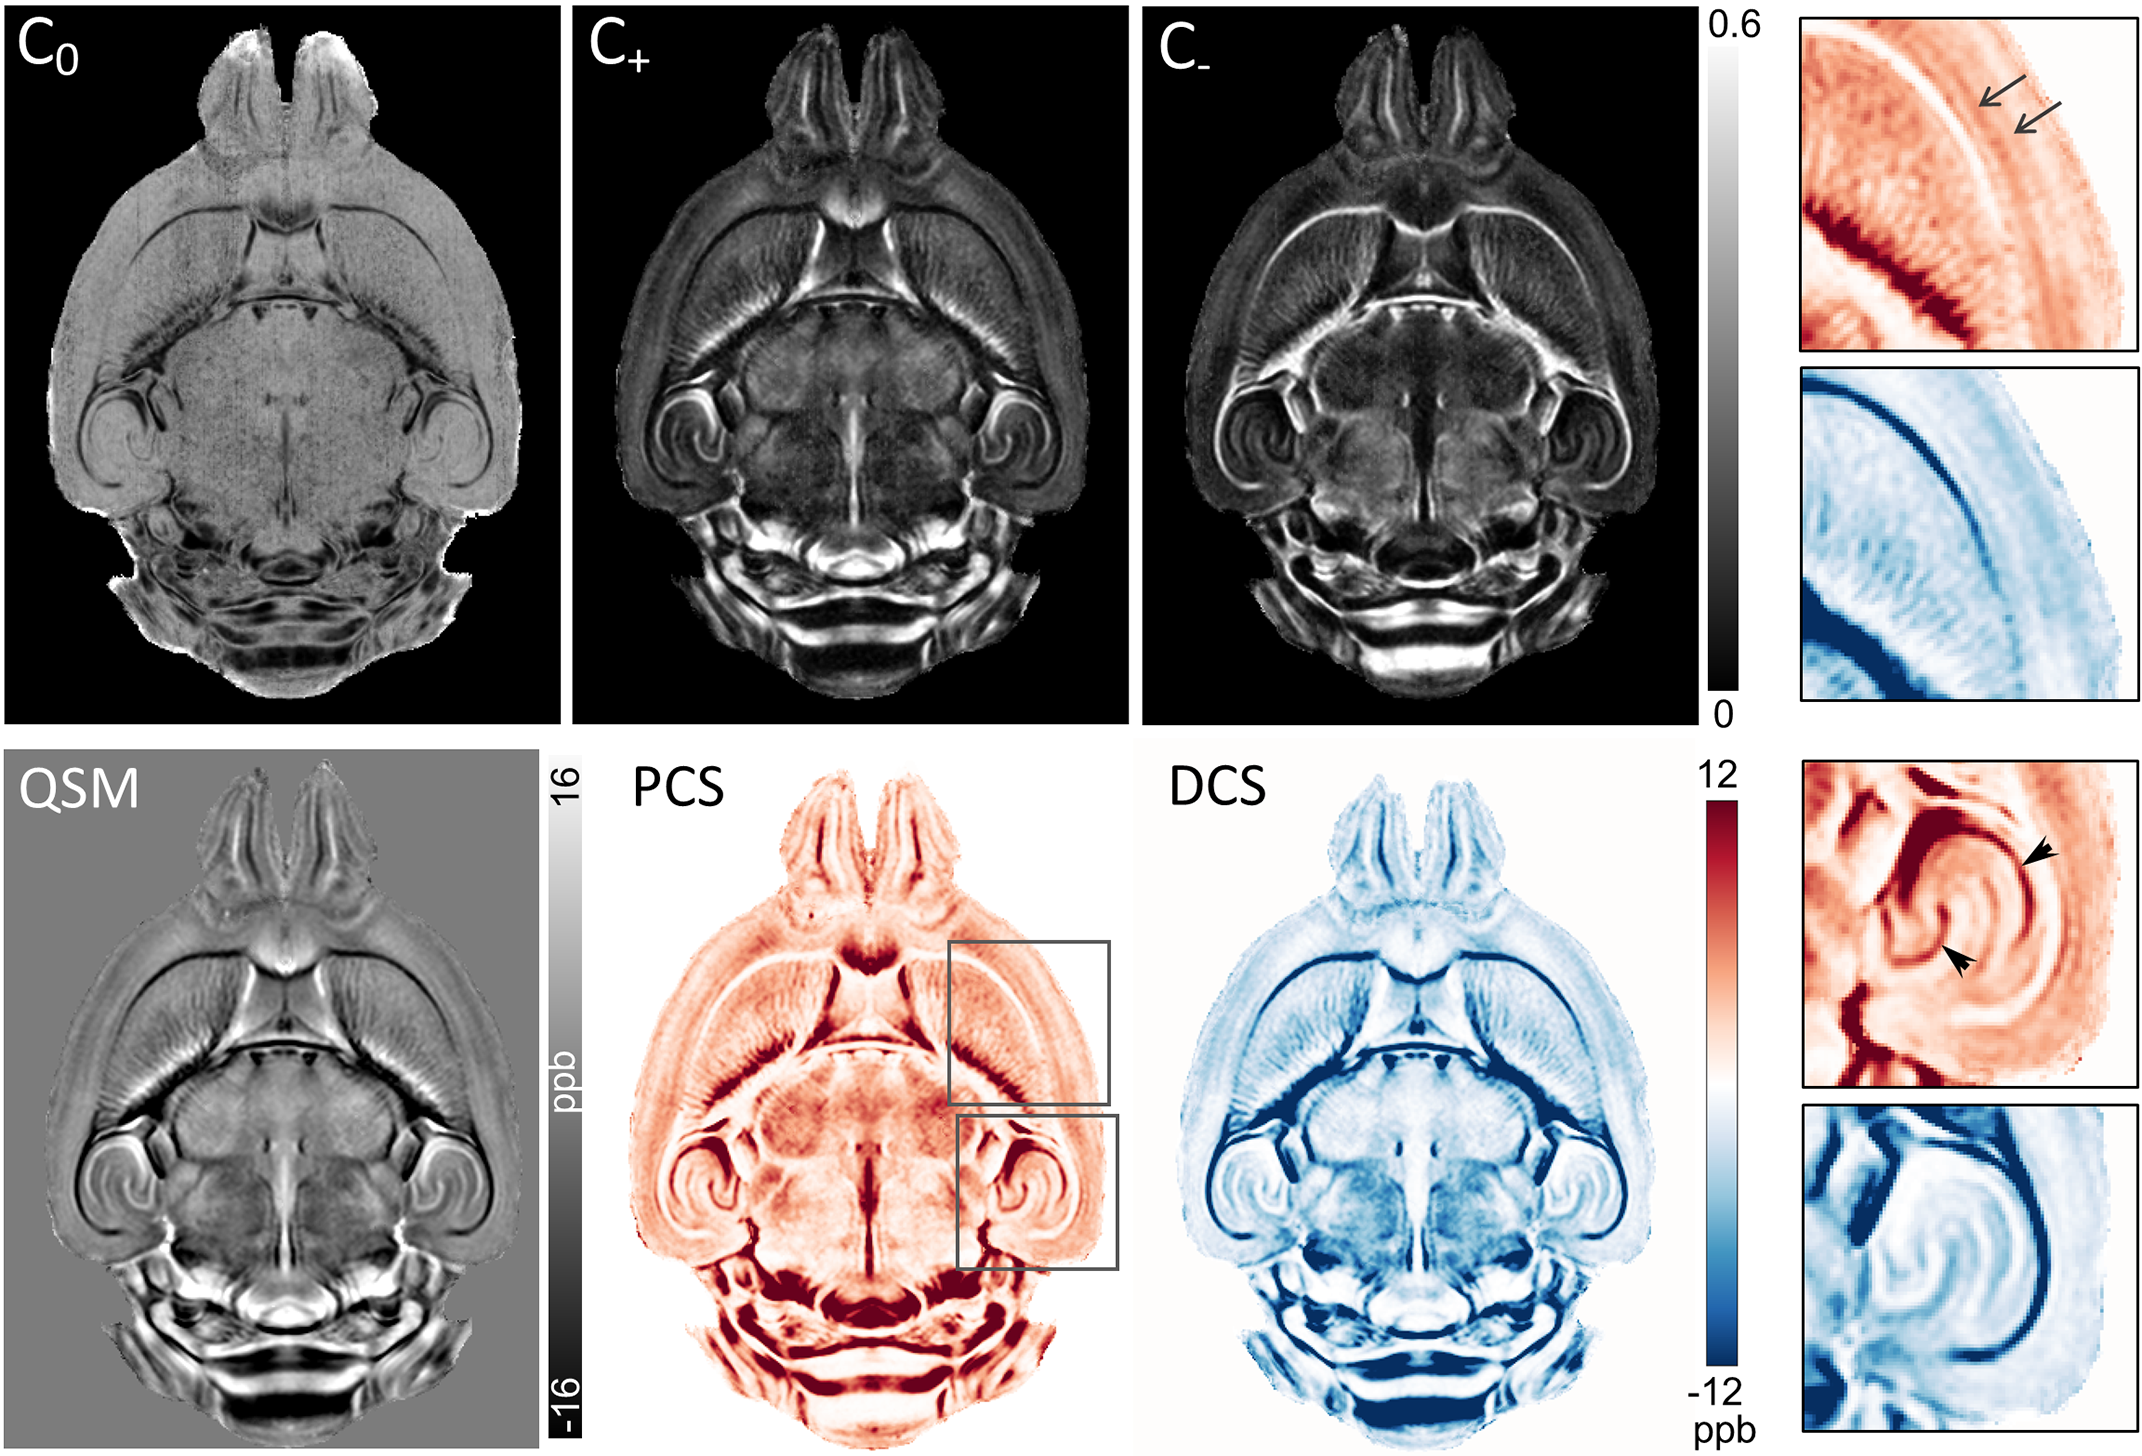
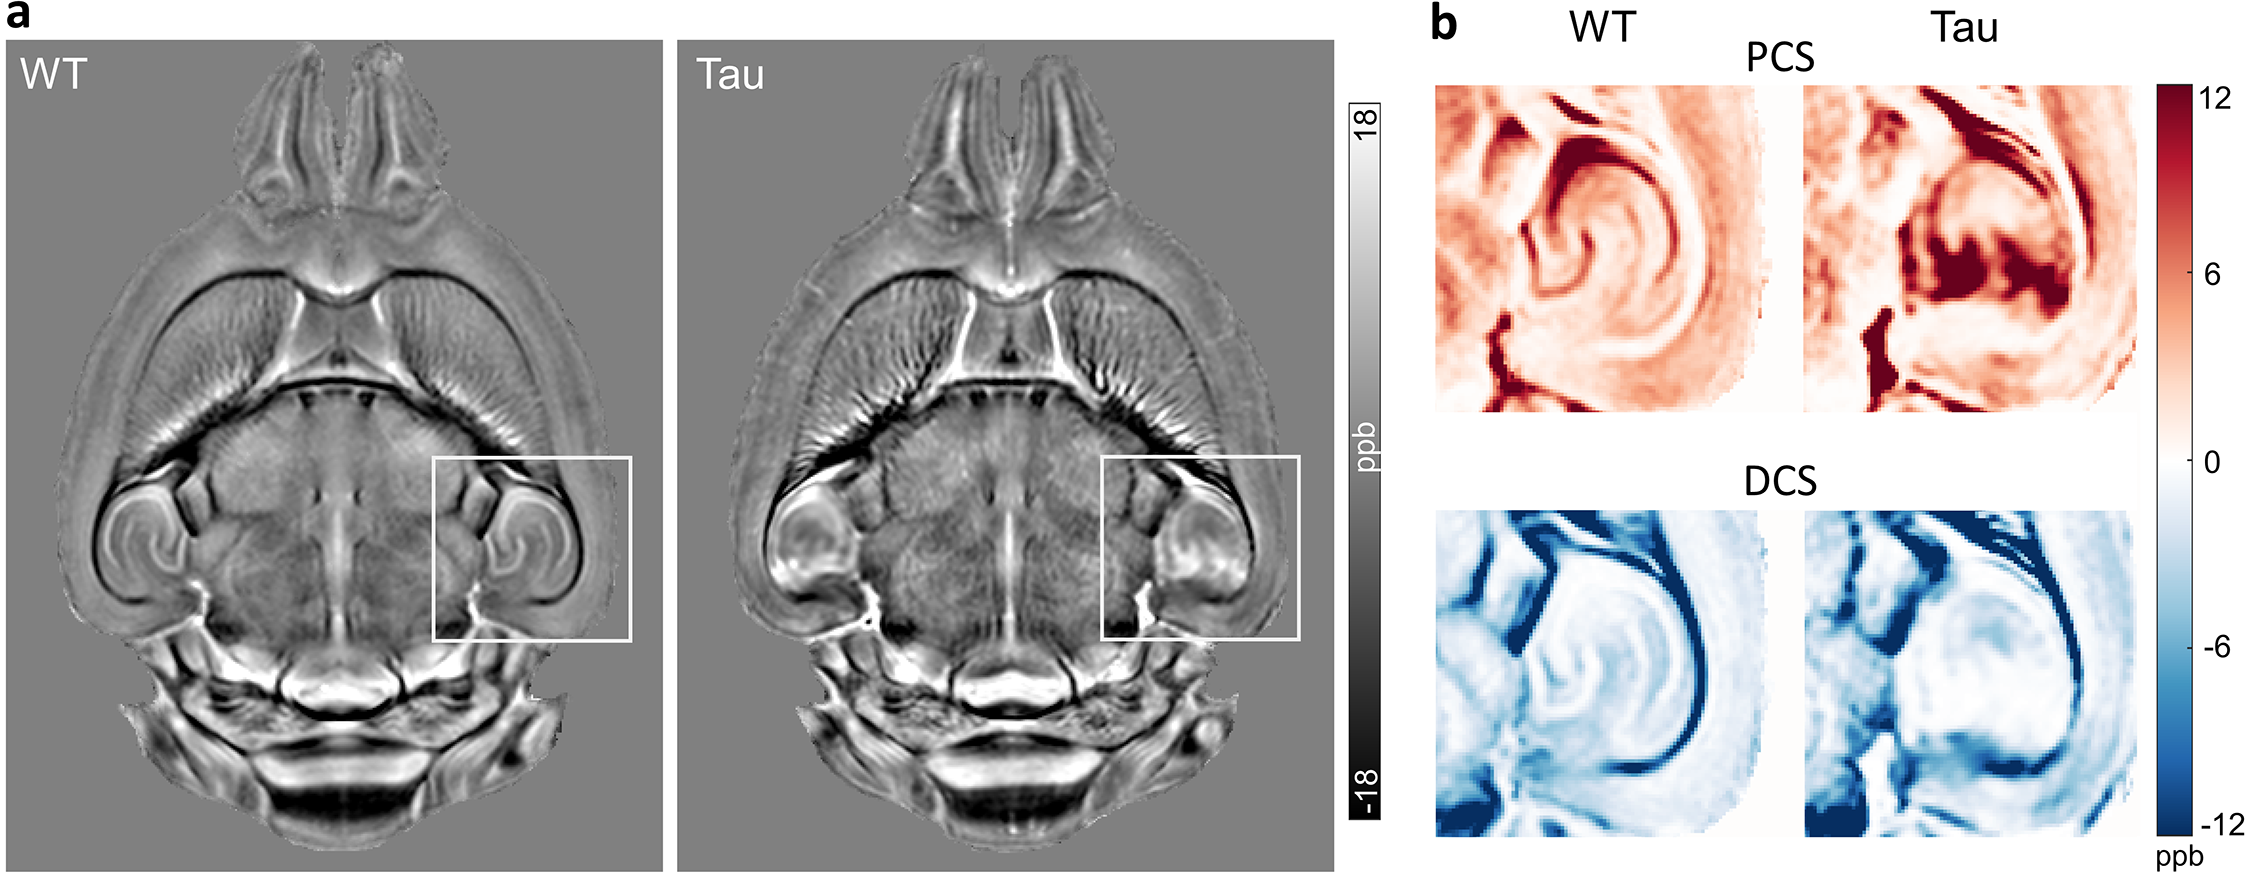
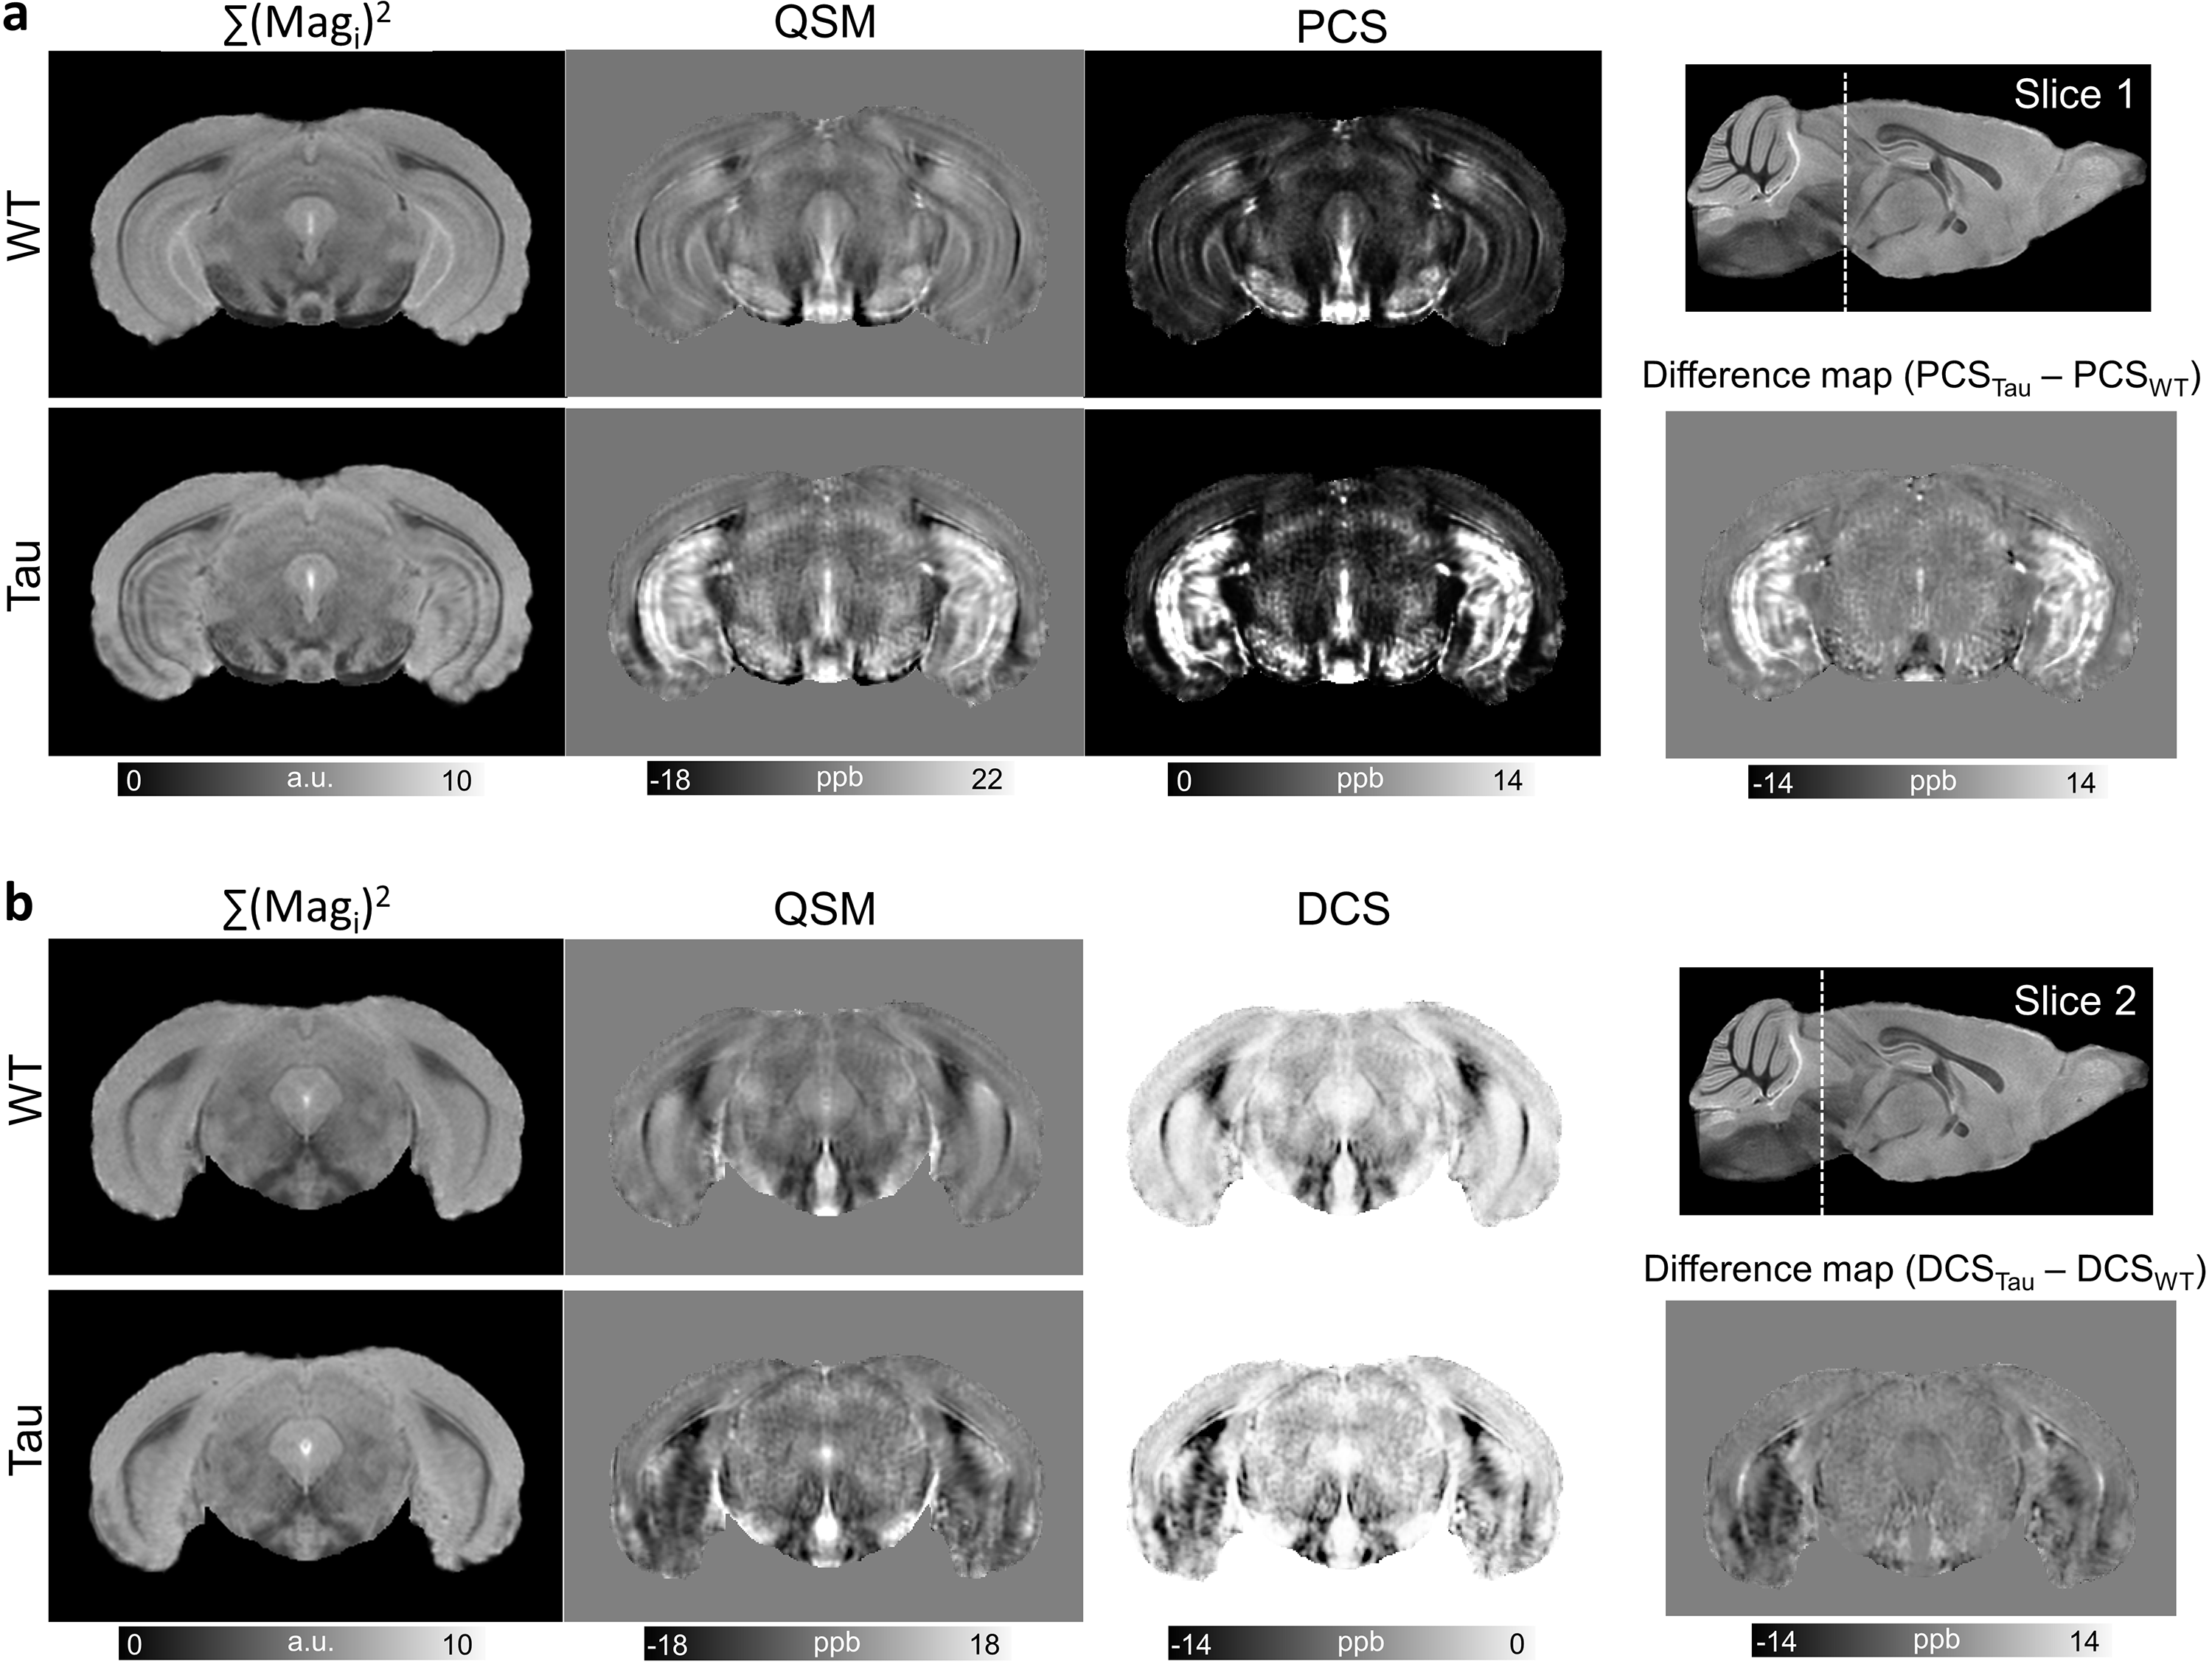
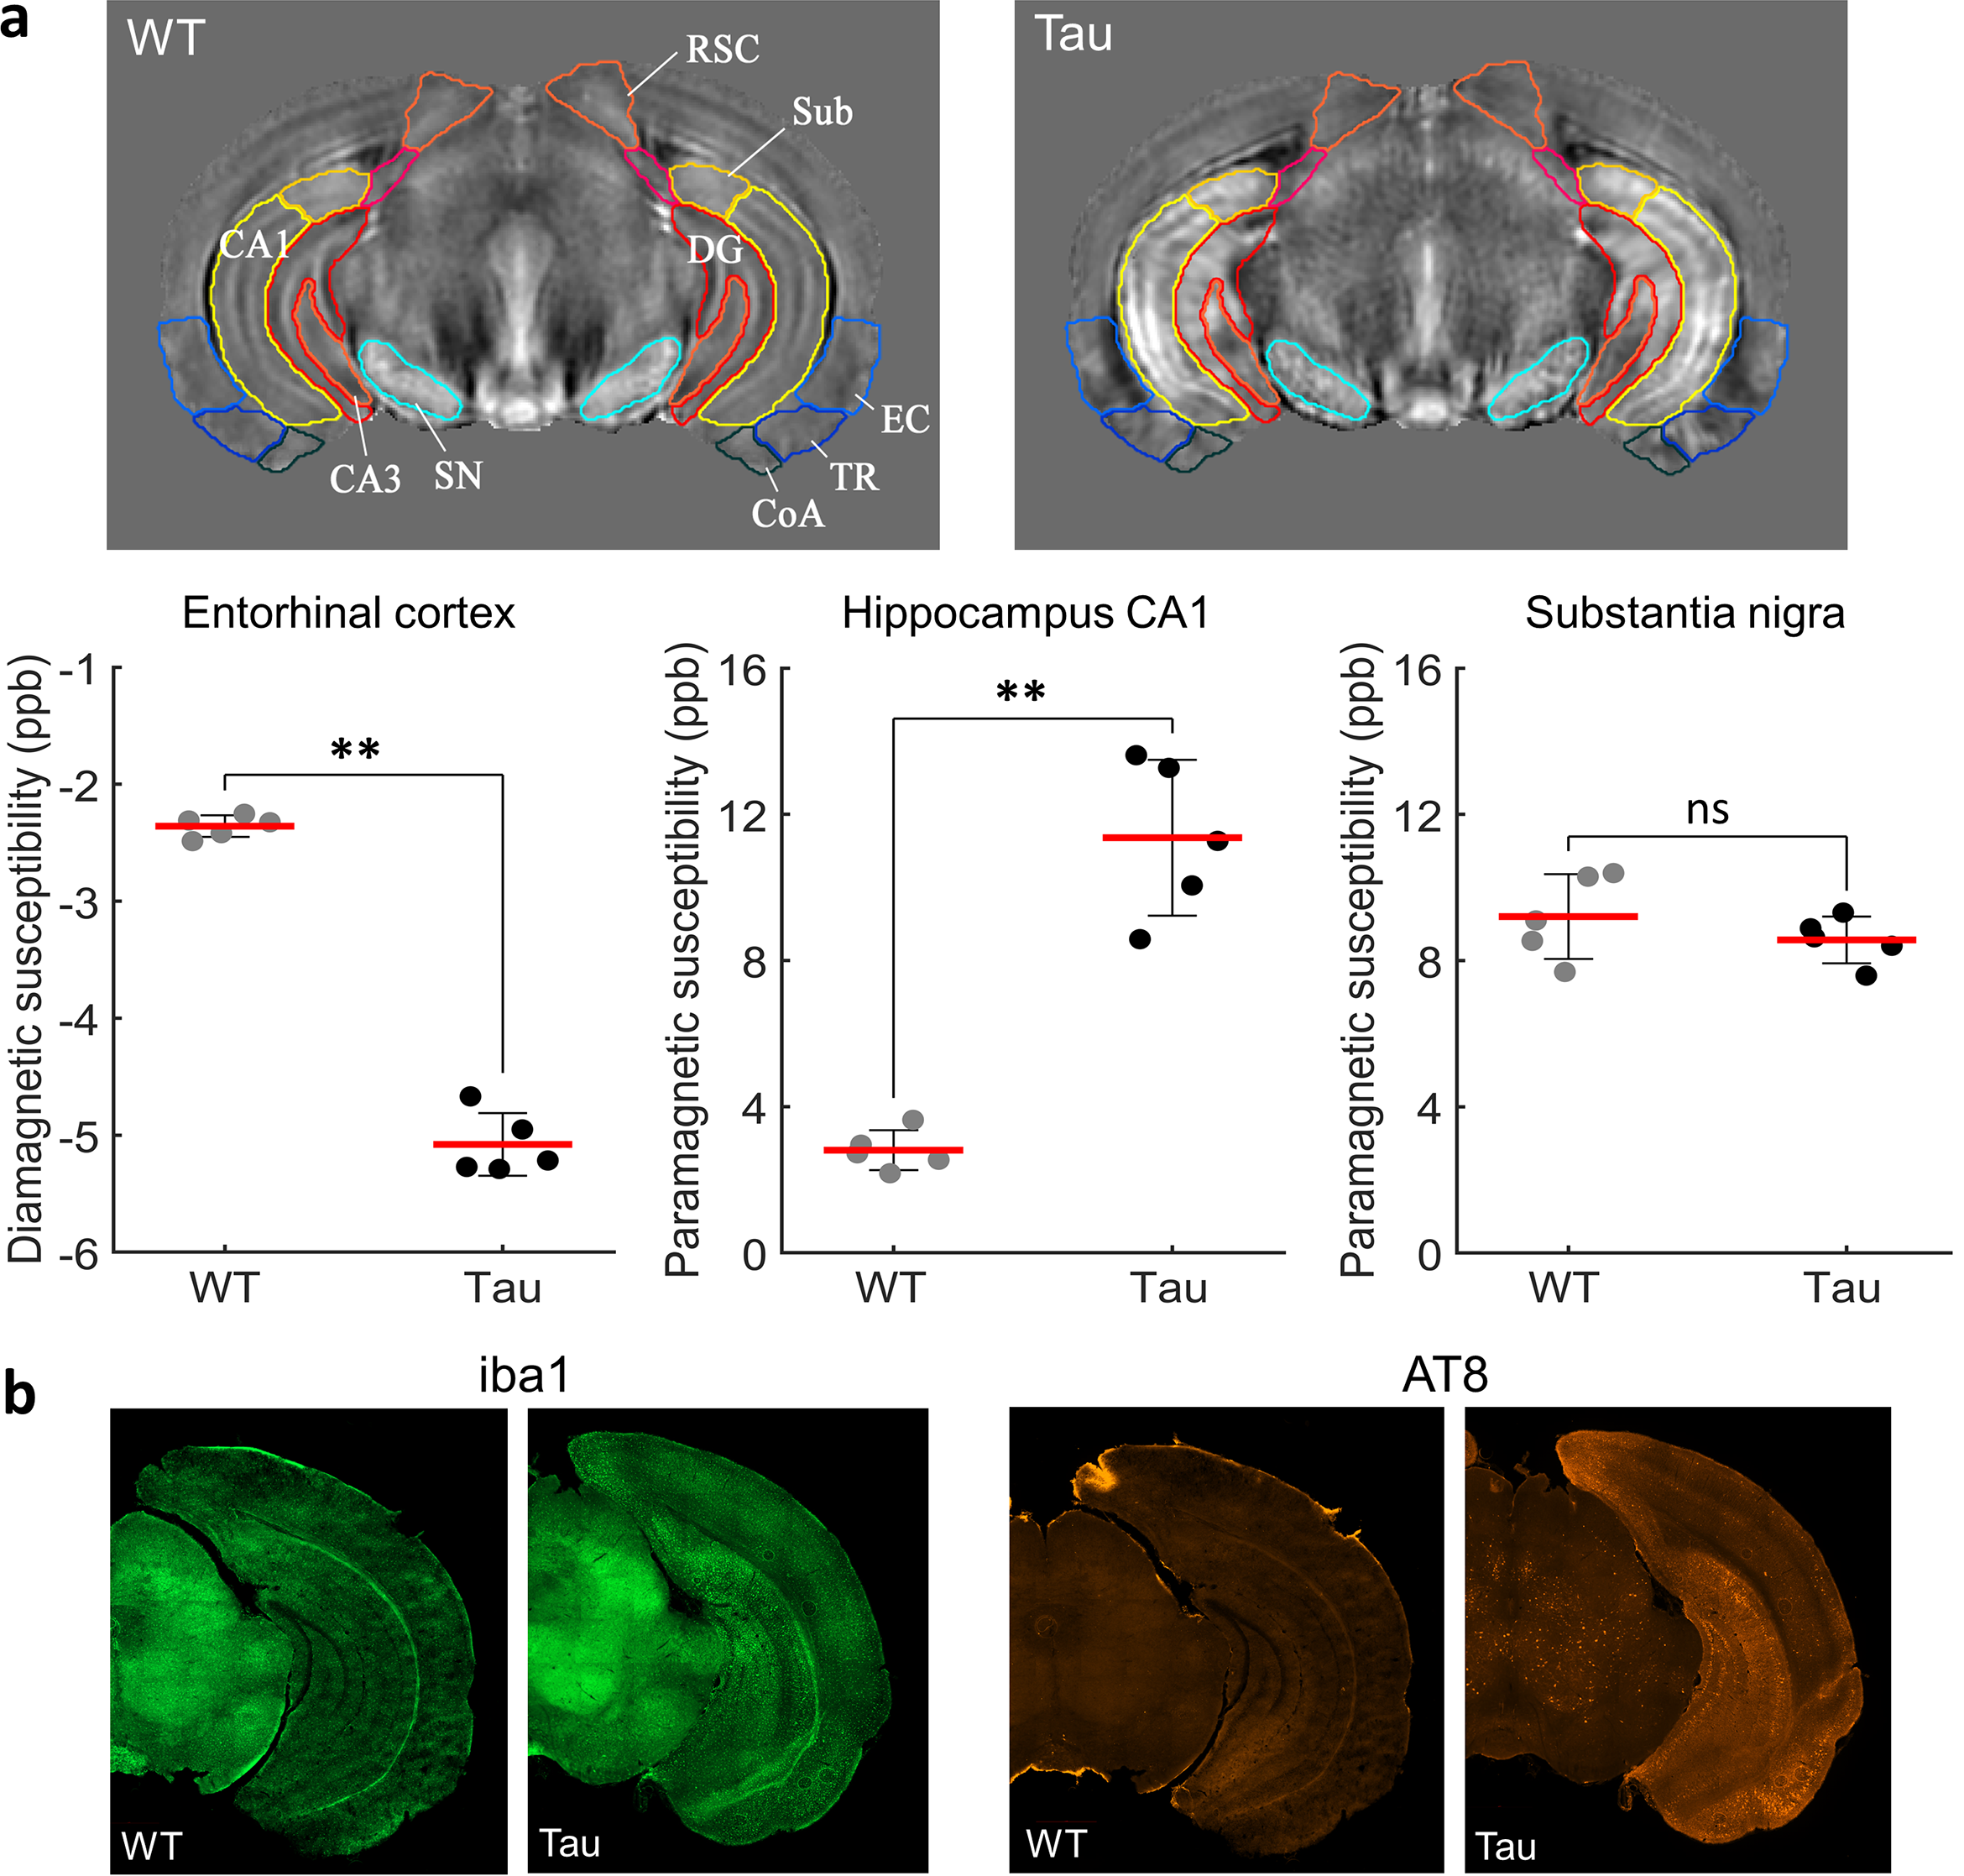
Fig. 1 shows representative slices from the group-averaged QSM template of WT mouse brains, revealing distinctly highlighted neuronal layers and gray matter regions. The laminar structure of the hippocampus delineated based on susceptibility variations is clearly seen in Fig. 1. Fig. 1e further shows markedly high paramagnetic susceptibility in the pyramidal cell layer of the dorsal hippocampus, reflecting its high iron content. Fig. 2 shows the signal fraction ($$$C_0,C_+,C_-$$$) and source separation maps from fitting the three-pool signal model for the WT mouse brains. The resulting PCS and DCS maps revealed distinct tissue contrasts consistent with variations in iron and myelin content in the mouse brain. Zoomed-in views of select regions further show cortical layers and neuronal cell layers in the hippocampus distinguished in the PCS maps (Fig. 2).Figs. 3 and 4 compare group-averaged susceptibility and source separation maps of the control and Tau mouse brains, revealing highly localized PCS and DCS alterations in the Tau brains. Bilaterally increased paramagnetic susceptibility in specific hippocampal regions of the Tau brains is seen clearly seen in Fig. 3. Coronal slices in Fig. 4a further show drastically elevated PCS in the Tau group, in bilateral regions that correspond closely to the anatomic borders of hippocampal CA1, subiculum, and dentate gyrus (c.f. structural delineations in Fig. 5a). The PCS increase is consistent with widespread microgliosis and presence of iron-laden microglia in the hippocampus of Tau brains8. In comparison, the entorhinal cortex (EC) and caudal hippocampus exhibited significantly increased DCS in the Tau brains relative to controls (Fig. 4b).
Fig. 5 shows structural delineations from the reference atlas overlaid on QSM maps of the WT and Tau brains, with plots of DCS and PCS values in select regions. Significant (p < 0.01) increases in the absolute values of PCS and DCS are evident in the hippocampal CA1 and EC, respectively, with no significant differences in other gray matter areas (Fig. 5a). Immunostained sections in Fig. 5b reveal extensive microgliosis in the hippocampal CA1 of the Tau mouse brains and dominant p-tau deposits in the EC, which correspond closely to the localized differences in susceptibility source separation maps.
Discussion and Conclusion
The results of this study demonstrate unique sensitivity of quantitative susceptibility source separation to distinguish sub-cellular alterations in the mouse brain. Localized increases in absolute PCS and DCS were observed in distinct brain regions, and found to correspond to localized microgliosis and tau deposition seen with immunohistology. Intracellular tau accumulation and proliferation of microglia with iron loading is a hallmark of tauopathies. The ability to probe these sub-cellular alterations with MRI therefore has important implications to gain insights into the disease pathogenesis.Acknowledgements
This work was supported in part by the National Institutes of Health (NIH) grant R01AG057991.References
1. Wang, Y. & Liu, T. Quantitative susceptibility mapping (QSM): Decoding MRI data for a tissue magnetic biomarker. Magn Reson Med 73, 82-101 (2015).
2. Gong, N. J., Dibb, R., Bulk, M., van der Weerd, L. & Liu, C. Imaging beta amyloid aggregation and iron accumulation in Alzheimer's disease using quantitative susceptibility mapping MRI. Neuroimage 191, 176-185 (2019).
3. Emmerich, J., Bachert, P., Ladd, M. E. & Straub, S. On the separation of susceptibility sources in quantitative susceptibility mapping: Theory and phantom validation with an in vivo application to multiple sclerosis lesions of different age. J Magn Reson 330, 107033 (2021).
4. Chen, J., Gong, N.-J., Chaim, K. T., Otaduy, M. C. G. & Liu, C. Decompose quantitative susceptibility mapping (QSM) to sub-voxel diamagnetic and paramagnetic components based on gradient-echo MRI data. NeuroImage 242, 118477 (2021).
5. Shin, H.-G. et al. χ-separation: Magnetic susceptibility source separation toward iron and myelin mapping in the brain. NeuroImage 240, 118371 (2021).
6. Dimov, A. V. et al. Susceptibility source separation from gradient echo data using magnitude decay modeling. Journal of Neuroimaging 32, 852-859 (2022).
7. Li, Z. et al. APART-QSM: An improved sub-voxel quantitative susceptibility mapping for susceptibility source separation using an iterative data fitting method. NeuroImage 274, 120148 (2023).
8. Yoshiyama, Y. et al. Synapse Loss and Microglial Activation Precede Tangles in a P301S Tauopathy Mouse Model. Neuron 53, 337-351 (2007).
9. Li, W., Wu, B. & Liu, C. Quantitative susceptibility mapping of human brain reflects spatial variation in tissue composition. NeuroImage 55, 1645-1656 (2011).
10. Schweser, F., Deistung, A., Lehr, B. W. & Reichenbach, J. R. Quantitative imaging of intrinsic magnetic tissue properties using MRI signal phase: an approach to in vivo brain iron metabolism? NeuroImage 54, 2789-2807 (2011).
11. Wei, H. et al. Streaking artifact reduction for quantitative susceptibility mapping of sources with large dynamic range. NMR in Biomedicine 28, 1294-1303 (2015).
12. Wang, Q. et al. The Allen Mouse Brain Common Coordinate Framework: A 3D Reference Atlas. Cell 181, 936-953.e920 (2020).
Figures