0185
A human brain atlas of χ-separation (chi-separation) for normative iron and myelin distributions1Department of Electrical and Computer Engineering, Seoul National University, Seoul, Korea, Republic of, 2Department of Radiology, Samsung Medical Center, Seoul, Korea, Republic of, 3Institute of Behavioral Sciences in Medicine, Yonsei University College of Medicine, Seoul, Korea, Republic of, 4Department of Psychiatry, Yongin Severance Hospital, Yongin, Korea, Republic of, 5Department of Radiology, Yongin Severance Hospital, Yongin, Korea, Republic of, 6Heuron Co., Ltd, Seoul, Korea, Republic of, 7Department of Neurosurgery, Severance Hospital, Seoul, Korea, Republic of, 8Department of Radiology, Severance Hospital, Seoul, Korea, Republic of, 9Department of Radiology, Johns Hopkins University School of Medicine, Baltimore, MD, United States, 10F.M. Kirby Research Center for Functional Brain Imaging, Kennedy Krieger Institute, Baltimore, MD, United States, 11Department of Neurology, Severance Hospital, Seoul, Korea, Republic of
Synopsis
Keywords: Susceptibility/QSM, Software Tools, Susceptibility source separation, Atlas, Iron imaging, Myelin imaging
Motivation: Abnormal iron and myelin distributions are associated with neurodegenerative diseases. An advanced susceptibility mapping technique, χ-separation, can disentangle paramagnetic iron and diamagnetic myelin contributions in quantitative susceptibility mapping.
Goal(s): In this study, a normative χ-separation atlas is created from 106 healthy volunteers.
Approach: To this end, individual χ-separation maps were registered to a common space and averaged across subjects.
Results: The resulting χ-separation atlas reflects well-known iron and myelin-rich structures in the brain. The analysis based on regions of interest revealed distinct characteristics of normative para- and diamagnetic susceptibility profiles throughout subcortical nuclei, thalamic nuclei, and white matter fibers.
Impact: Our χ-separation atlas would be utilized as a reference for imaging susceptibility in the brain and may assist in accurate localization of targets for intervention such as deep brain stimulation or high-intensity focused ultrasound.
Introduction
Alterations in iron and myelin distribution in the human brain are associated with neurogenerative diseases such as Alzheimer’s disease, Parkinson’s disease, and multiple sclerosis1. The imaging of paramagnetic iron and diamagnetic myelin can be achieved with magnetic resonance imaging (MRI) by quantitative susceptibility mapping (QSM)2. However, when iron and myelin are co-localized in a voxel, their contributions to QSM contrast are hardly separable. This limitation can be resolved with a susceptibility source separation method, χ-separation (chi-separation)3, which utilizes phase and R2’ (or R2*) to create para- and diamagnetic susceptibility (χpara and χdia) maps. In this study, we created a brain atlas of χ-separation from 106 healthy human brains as a reference for utilizing χ-separation in the neuroimaging field (https://github.com/SNU-LIST/chi-separation-atlas).Methods
106 healthy human volunteers (27–85 years old, mean=60.8±15.8; 34 males and 72 females) were recruited from two hospitals and scanned using 3 T MRI (Ingenia CX or Ingenia Elition X) with multi-echo gradient-echo and magnetization-prepared rapid gradient-echo (MPRAGE) sequences. The study was approved by the Institutional Review Board and all subjects provided written consent.Fig. 1 shows the workflow for atlas construction. The phases of multi-echo gradient-echo images were combined4 and unwrapped5. The background field was removed to generate a tissue field map. A R2* map was generated from the magnitudes of multi-echo gradient-echo images. χpara and χdia maps were acquired with χ-sepnet6 utilizing the tissue field and R2* maps as inputs. A QSM map was calculated by summing the χpara and χdia maps. The QSM map and T1-weighted image were linearly combined to generate a hybrid image, which was nonlinearly registered7 to the hybrid image atlas from MuSus-1008 in the MNI space. Using the resulting deformation field, the χpara and χdia maps were registered to the MNI space. These maps were averaged across subjects to create a χ-separation atlas. The inter-subject variability of the atlas was evaluated by a relative standard deviation (rSD) map, which is standard deviation divided by mean.To conduct regions of interest (ROI)-based analysis on the χ-separation atlas, eight subcortical nuclei and three thalamic nuclei labels from MuSus-1008, twenty-eight white matter labels from ICBM-DTI-819, and a whole white matter ROI generated via intensity-based segmentation10 were employed. The median χpara, χdia, and QSM in ROIs were averaged across subjects and the population means and standard deviations were reported.
Results
In Fig. 2, representative slices of χpara atlas exhibits high values in iron-rich nuclei in basal ganglia, thalamus, and midbrain, while white matter fibers such as corpus callosum are clearly depicted as high |χdia| value. As shown in rSD maps, regions close to vessels or ventricles show high variability. Ten axial slices in Fig. 3 provides a comprehensive view in our χ-separation atlas, visualizing anatomical structures associated with iron and myelin distributions.The zoomed-in images of the χ-separation atlas in Fig. 4 reveal fine anatomical structures. Claustrum, thin gray matter between external and extreme capsule, can be identified as high χpara values bordering high |χdia| values of two white matter fibers. In thalamus, anterior, medial, lateral thalamic nuclei and pulvinar can be clearly delineated by their distinctive χpara and χdia values. While anterior, medial thalamic nuclei, and pulvinar has high χpara and low |χdia|, lateral thalamic nuclei exhibit moderate levels of χpara and |χdia| values, resulting in near-zero in QSM value (see Fig. 5). In globus pallidus, medial and lateral medullary lamina, which separate internal, external globus pallidus and putamen, are visualized as high |χdia| values between high χpara of iron-rich nuclei.
Fig. 5 shows the normative profile of χpara and χdia across subcortical nuclei, thalamus, and white matter. In general, high χpara values (45–145 ppb) are observed in subcortical nuclei and pulvinar, while white matter shows χpara of 10–30 ppb. Contrarily, white matter shows high |χdia| of 25–50 ppb, while it is 10–25 ppb in subcortical and thalamic nuclei. In thalamus, nearly same levels of χpara and |χdia| are observed in lateral thalamic nuclei.
Discussion
The χ-separation atlas demonstrates exquisite details of anatomical structures associated with iron and myelin distribution. Moreover, it provides normative ranges of χpara and χdia in the brain across subcortical nuclei, thalamic nuclei, and white matter fibers. However, some imperfections in the χ-separation model (e.g. constant relaxometric coefficient, anisotropic susceptibility, and flow artifact)3, 11, 12 may result in erroneous χpara or χdia. Beyond its application in research, our atlas may be utilized in treatments targeting deep brain structures such as deep brain stimulation or high-power focused ultrasound.Conclusion
The χ-separation atlas was successfully created as a reference for χpara and χdia maps of healthy population.Acknowledgements
This research was supported by the National Research Foundation of Korea (NRF-2019M3C7A1031994, NRF-2021R1A2B5B03002783), and INMC at Seoul National University.
References
1. Möller, H. E., et al., Iron, myelin, and the brain: Neuroimaging meets neurobiology. Trends in Neurosciences 42, 384-401 (2019).
2. de Rochefort, L., Brown, R., Prince, M. R. & Wang, Y., Quantitative MR susceptibility mapping using piece-wise constant regularized inversion of the magnetic field. Magnetic Resonance in Medicine 60, 1003-1009 (2008).
3. Shin, H.-G., et al., χ-separation: Magnetic susceptibility source separation toward iron and myelin mapping in the brain. NeuroImage 240, 118371 (2021).
4. Wu, B., Li, W., Avram, A. V., Gho, S.-M. & Liu, C., Fast and tissue-optimized mapping of magnetic susceptibility and T2* with multi-echo and multi-shot spirals. NeuroImage 59, 297-305 (2012).
5. Schofield, M. A. & Zhu, Y., Fast phase unwrapping algorithm for interferometric applications. Optics Letters 28, 1194-1196 (2003).
6. Kim, M., et al., Chi-sepnet: Susceptibility source separation using deep neural network. Proceedings of International Society of Magnetic Resonance in Medicine 30, 2464 (2022).
7. Avants, B. B., Epstein, C. L., Grossman, M. & Gee, J. C., Symmetric diffeomorphic image registration with cross-correlation: Evaluating automated labeling of elderly and neurodegenerative brain. Medical Image Analysis 12, 26-41 (2008).
8. He, C., et al., Quantitative susceptibility atlas construction in Montreal Neurological Institute space: towards histological-consistent iron-rich deep brain nucleus subregion identification. Brain Structure and Function 228, 1045-1067 (2023).
9. Oishi, K., et al., Human brain white matter atlas: Identification and assignment of common anatomical structures in superficial white matter. NeuroImage 43, 447-457 (2008).
10. Avants, B. B., Tustison, N. J., Wu, J., Cook, P. A. & Gee, J. C., An open source multivariate framework for n-tissue segmentation with evaluation on public data. Neuroinformatics 9, 381-400 (2011).
11. Lee, J., et al., Sensitivity of MRI resonance frequency to the orientation of brain tissue microstructure. Proceedings of the National Academy of Sciences of the United States of America 107, 5130-5135 (2010).
12. Grosso, E., Ricciardi, A., D'Angelo, E., Palesi, F. & Wheeler-Kingshott, C. A. G., Subject-specific χ-separation method: the effect of introducing a personalised relaxometric constant Dr. Proceedings of International Society of Magnetic Resonance in Medicine 30, 4172 (2022).
13. Naidich, T. P., Castillo, M., Cha, S. & Smirniotopoulos, J. G., Imaging of the Brain (Saunders, 2013)
14. Schaltenbrand, G. & Wahren, W., Atlas for Stereotaxy of the Human Brain (Thieme, 1977)
Figures
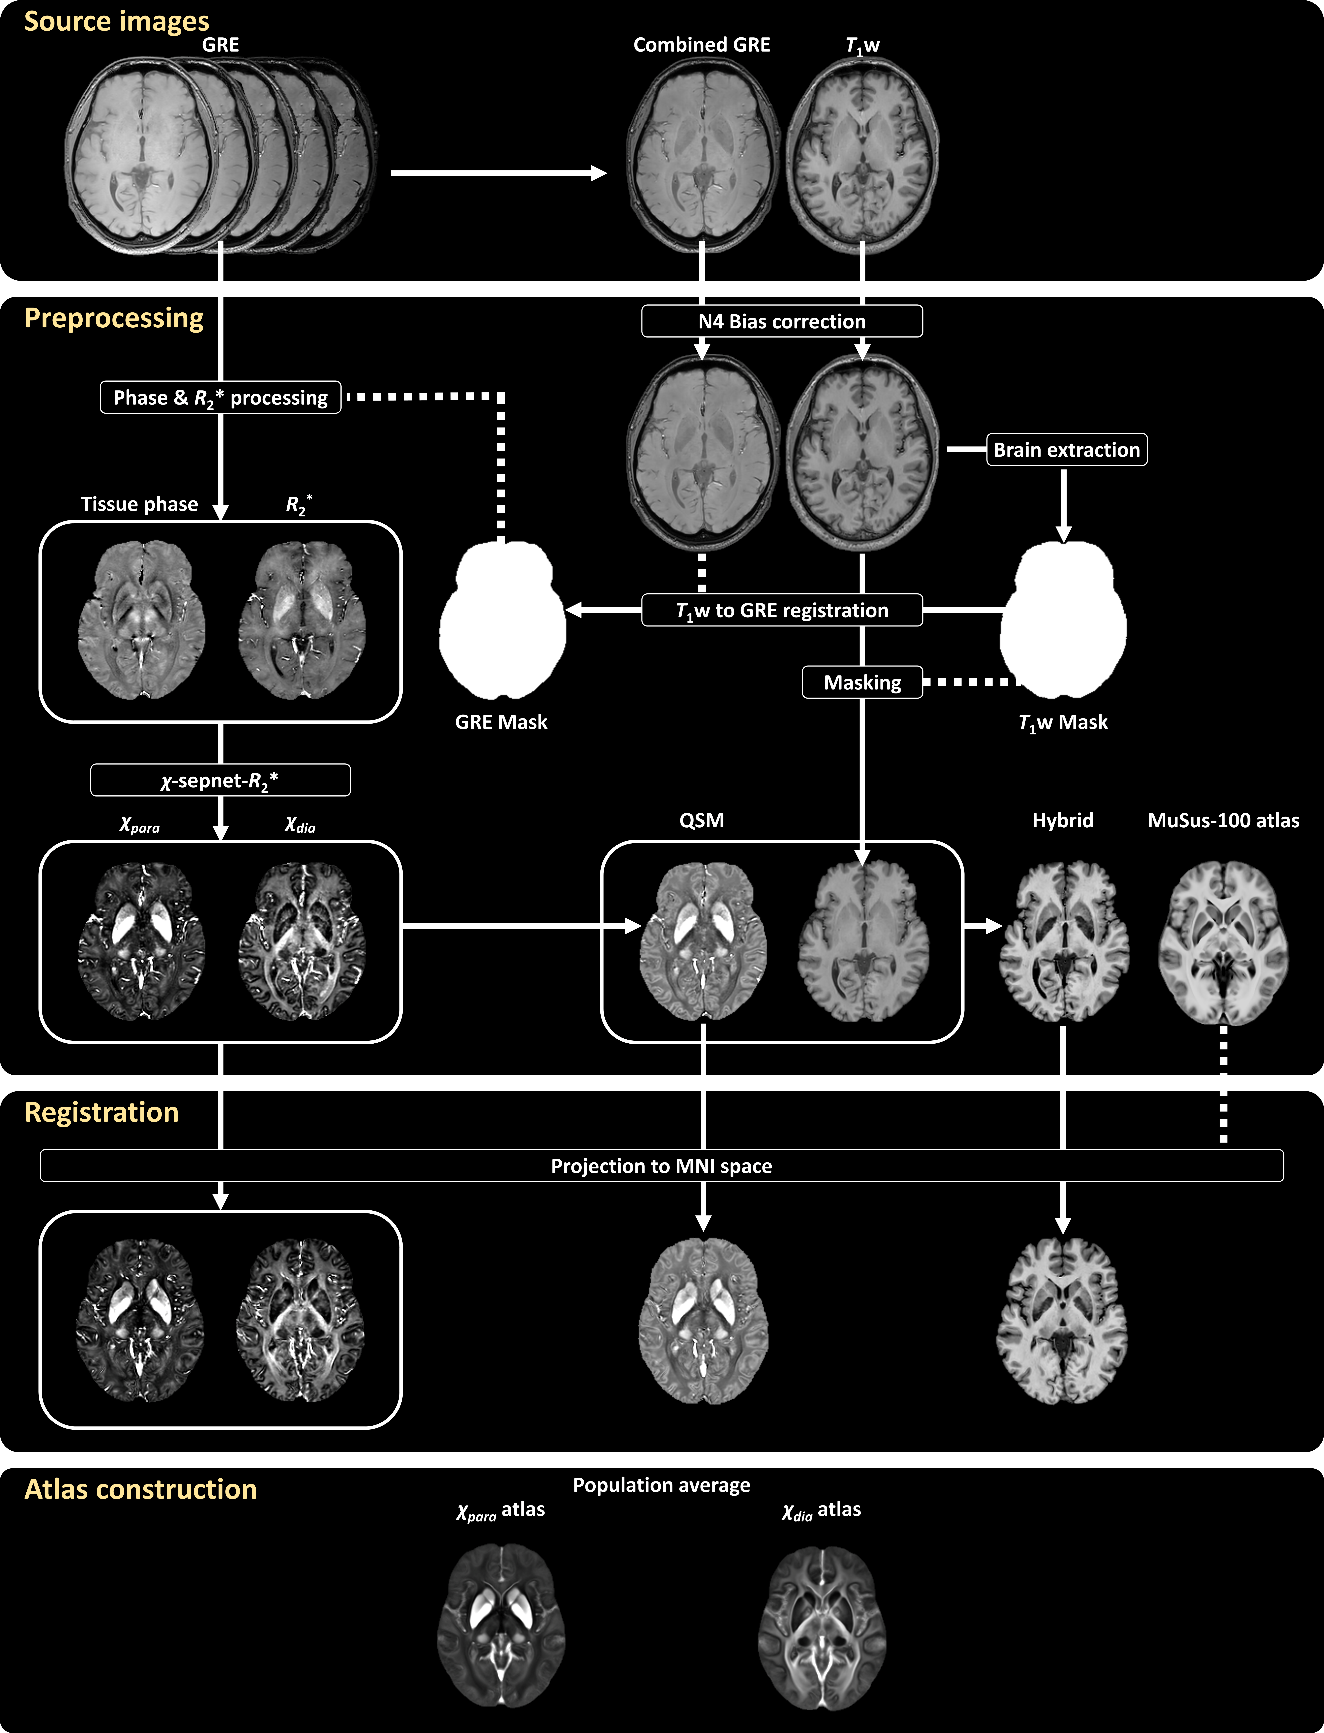
Fig. 1. Schematic flowchart illustrating the processing pipeline for generating the χpara and χdia atlases. The hybrid images were created by a linear combination of the QSM and T1-weighted images.
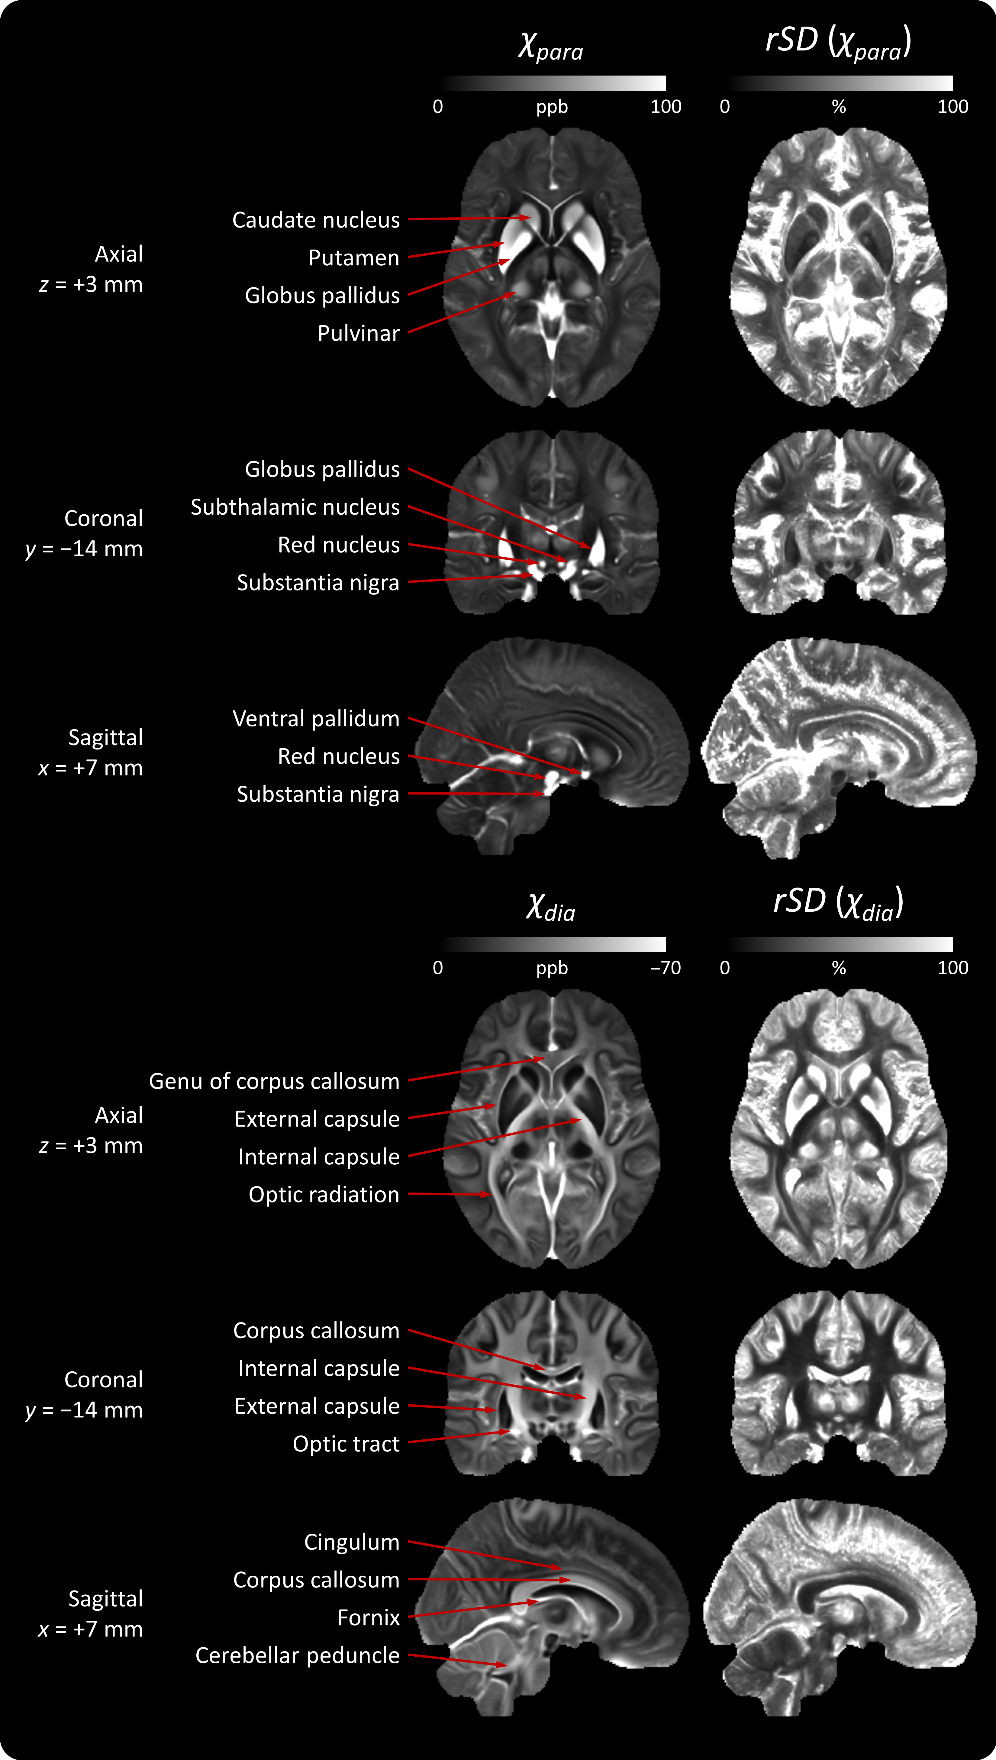
Fig. 2. Representative axial, coronal, and sagittal slices of the χpara and χdia atlases and rSD maps.
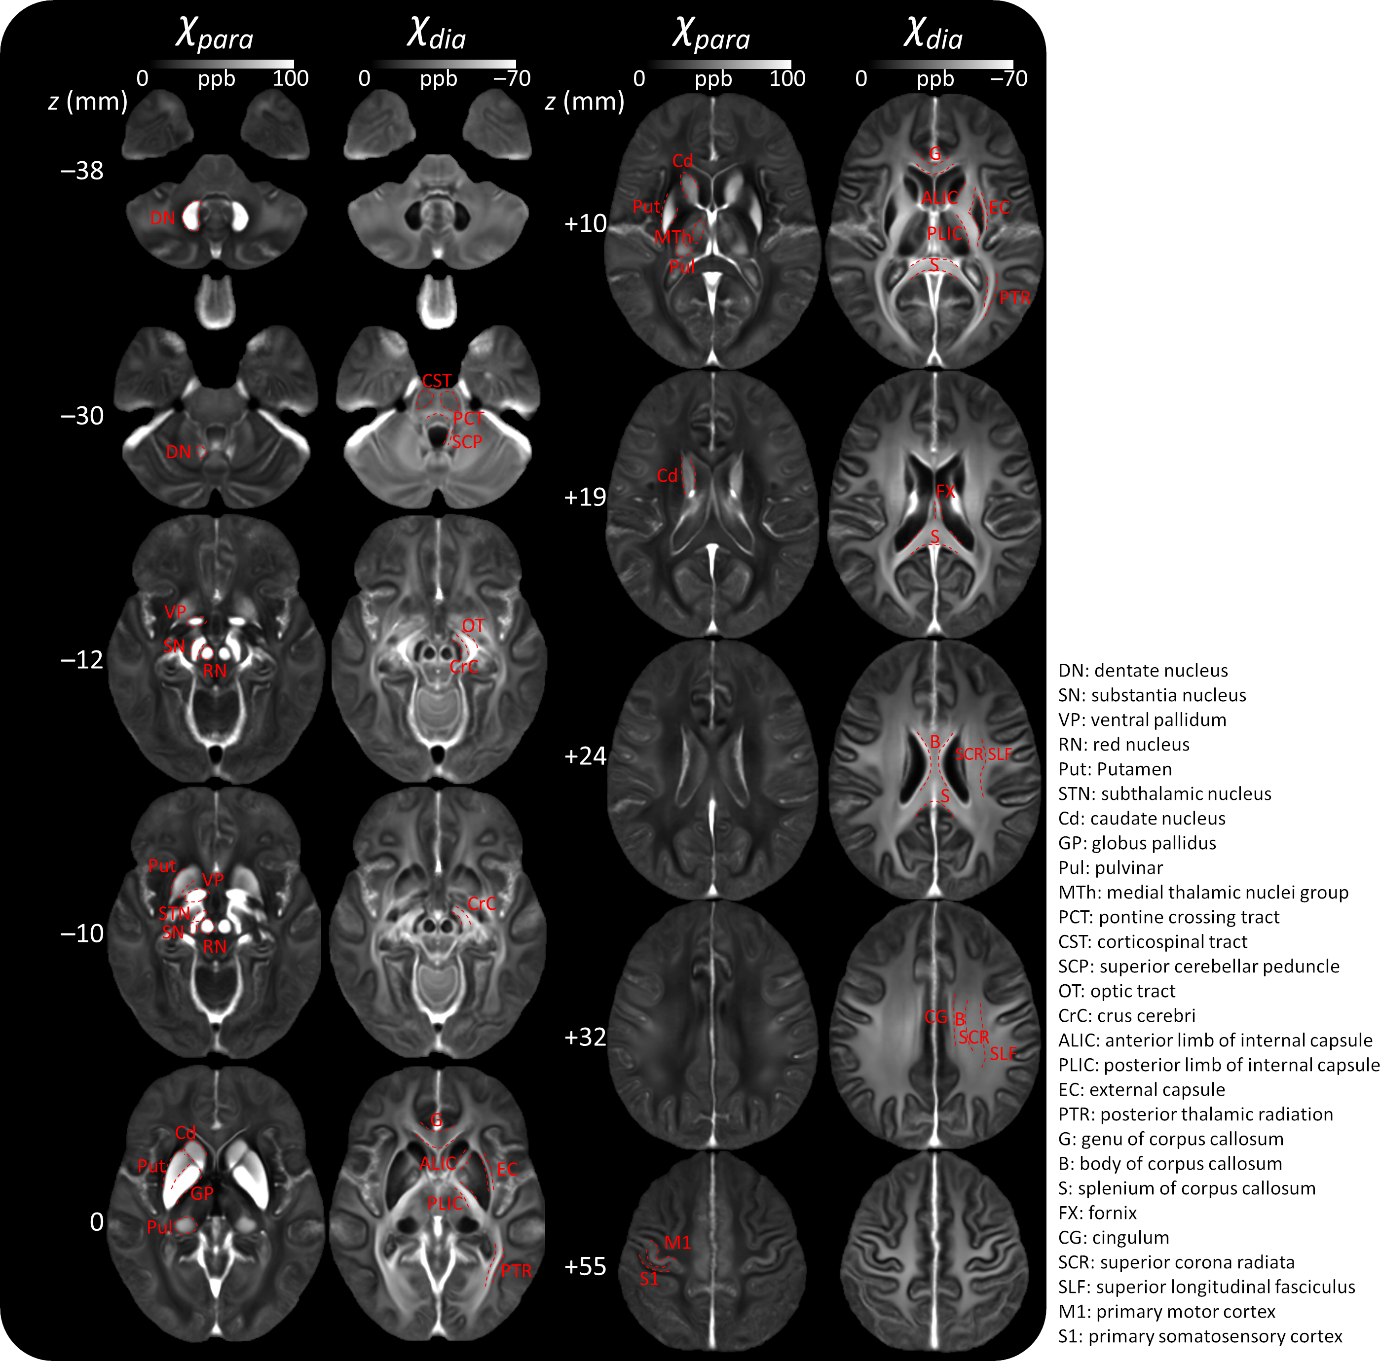
Fig. 3. Ten axial slices of the χpara and χdia atlases. Anatomical structures are marked with red dotted lines.
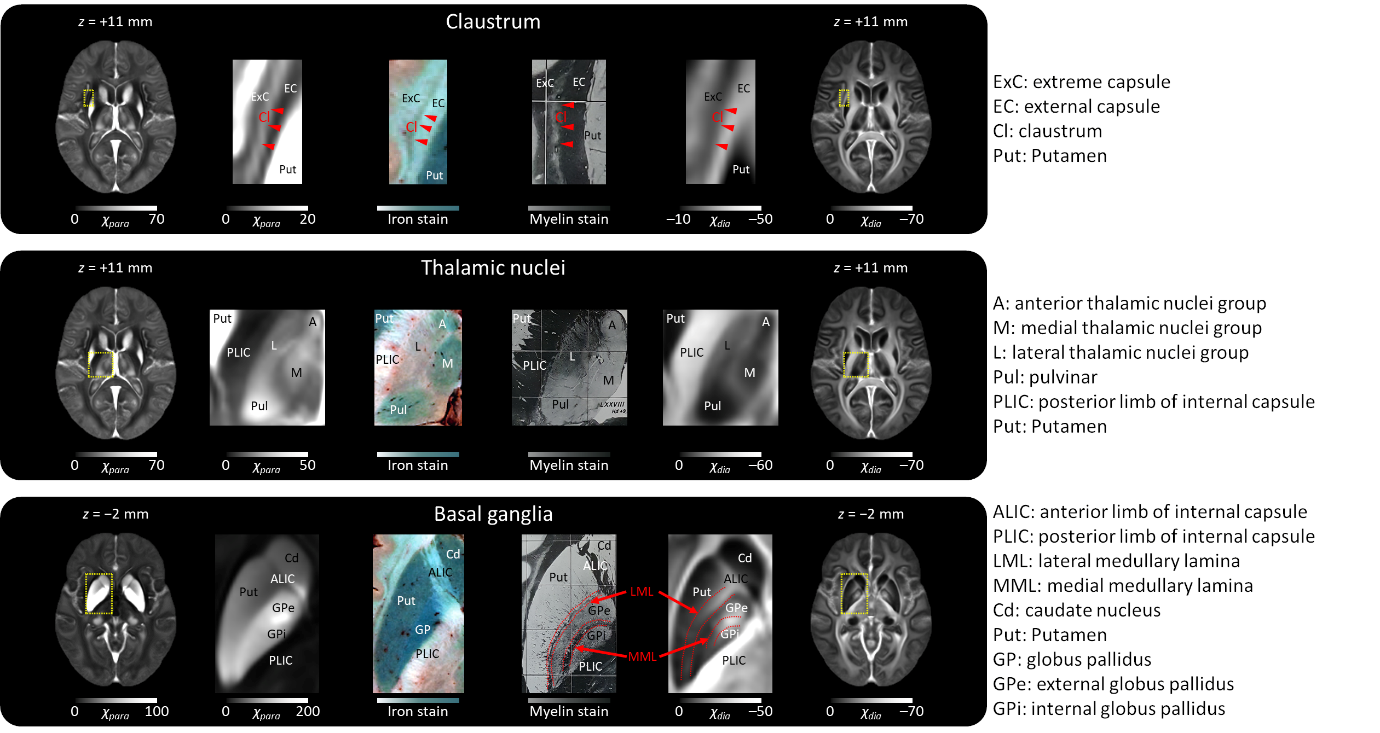
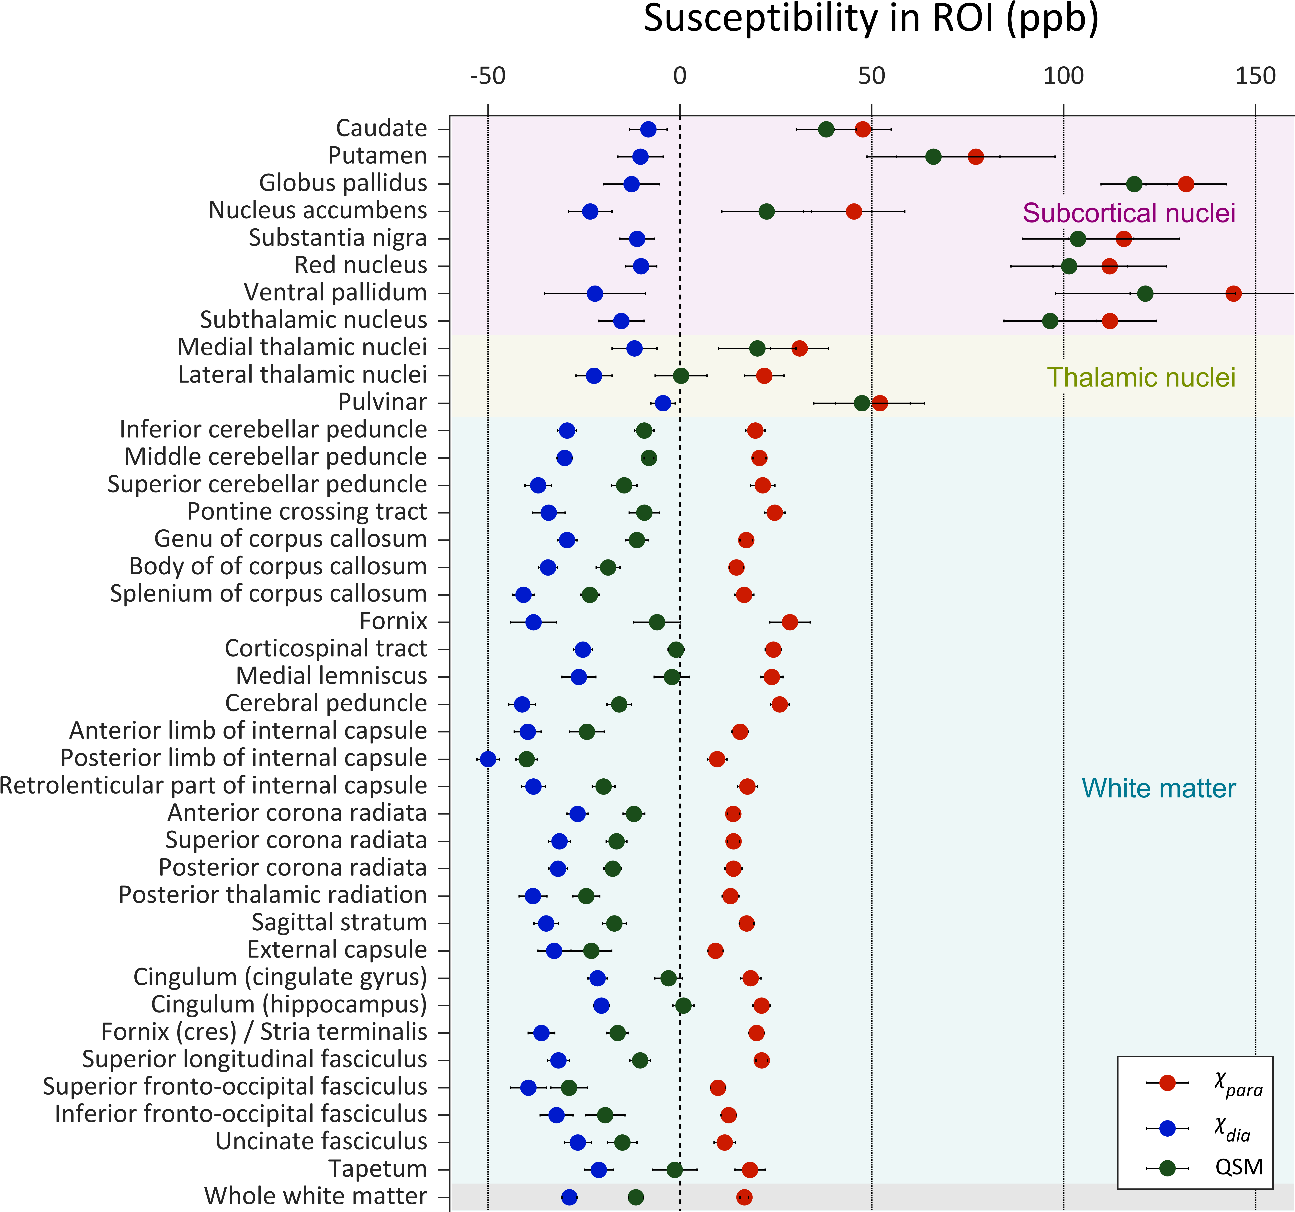
Fig. 5. The population averages of χpara, χdia, and QSM medians extracted from 40 ROIs (number of subjects = 106). Red, blue, and green circles represent the χpara, χdia, and QSM averages, respectively. The black line attached to the triangle indicates the standard deviation value of each ROI.