0184
Data-driven Electrical Conductivity Reconstructions via transceive phase and signal magnitude gradient data from the three imaging directions1Department of Electrical and Electronic Engineering, Yonsei University, Seoul, Korea, Republic of, 2Department of Radiotherapy, Division of Imaging and Oncology, UMC Utrecht, Utrecht, Netherlands, 3Computational Imaging Group for MR Diagnostics and Therapy, UMC Utrecht, Utrecht, Netherlands, 4Department of Radiology, Gangnam Severance Hospital, Yonsei University College of Medicine, Seoul, Korea, Republic of, 5Divison of Biomeidcal Engineering, Hankuk University of Foreign Studies, Yongin-Si, Korea, Republic of
Synopsis
Keywords: Electromagnetic Tissue Properties, Electromagnetic Tissue Properties
Motivation: Phase-based conductivity reconstructions suffer from poor structural information and lack of conductivity information from through plane (z-direction) phase variations.
Goal(s): To present an end-to-end process that utilizes gradient information from the transceive phase and tissue magnitude in all three directions (in-plane: x/y and through plane: z) to address the issue of boundary artifacts in conductivity reconstructions and lack of conductivity information from the z-direction.
Approach: This method was trained on simulated data (SNR=50), and tested both on simulated and measured in-vivo data.
Results: This approach reduces boundary errors and shows higher accuracy in conductivity reconstructions compared to conventional methods.
Impact: In contrast to existing tissue conductivity reconstruction algorithms that operate under the assumption of negligible through-plane (z) transceive phase contributions, our approach demonstrates enhanced efficacy and more accurate conductivity reconstructions by explicitly considering through-plane phase variations.
Introduction
MR-Electrical Properties Tomography (MR-EPT) is a non-invasive technique that reconstructs tissue conductivity σ from measurements of the transceive phase ($$$\phi$$$) as an approximation of the radiofrequency $$${B_1}^{+}$$$ phase. Physics-based, phase-only reconstruction methods employ the Helmholtz equation, which requires computation of first and second order spatial derivatives of the measured transceive phase1,2. This operator leads to severe noise amplifications and errors at tissue boundaries in the reconstructed EPs maps3. These issues are evident in brain EPs reconstructions due to the intricate tissue structure leading to severe errors at tissue interfaces.To overcome these challenges and improve the reconstruction accuracy, end-to-end4,5 and physics-informed deep learning6,7 (DL)-based methods have been developed. Although the outcomes of these DL-based techniques are promising, they are often 2D-based, thus discarding contributions from phase variations through slices (z-axis), leading to inaccurate conductivity reconstructions.
Here, we introduce an advanced end-to-end neural network specifically designed to account for through-plane (z-direction) transceive phase variations. Additionally, this method does not rely on the use of tissue magnitude information, which may cause overfitting of end-to-end DL methods, but only on its gradient to better reconstruct tissue boundaries, which are difficult to extract from only phase information. The proposed method enhances the fidelity of the conductivity reconstructions, yielding to more precise maps, especially in regions with intricate tissue structures.
Methods
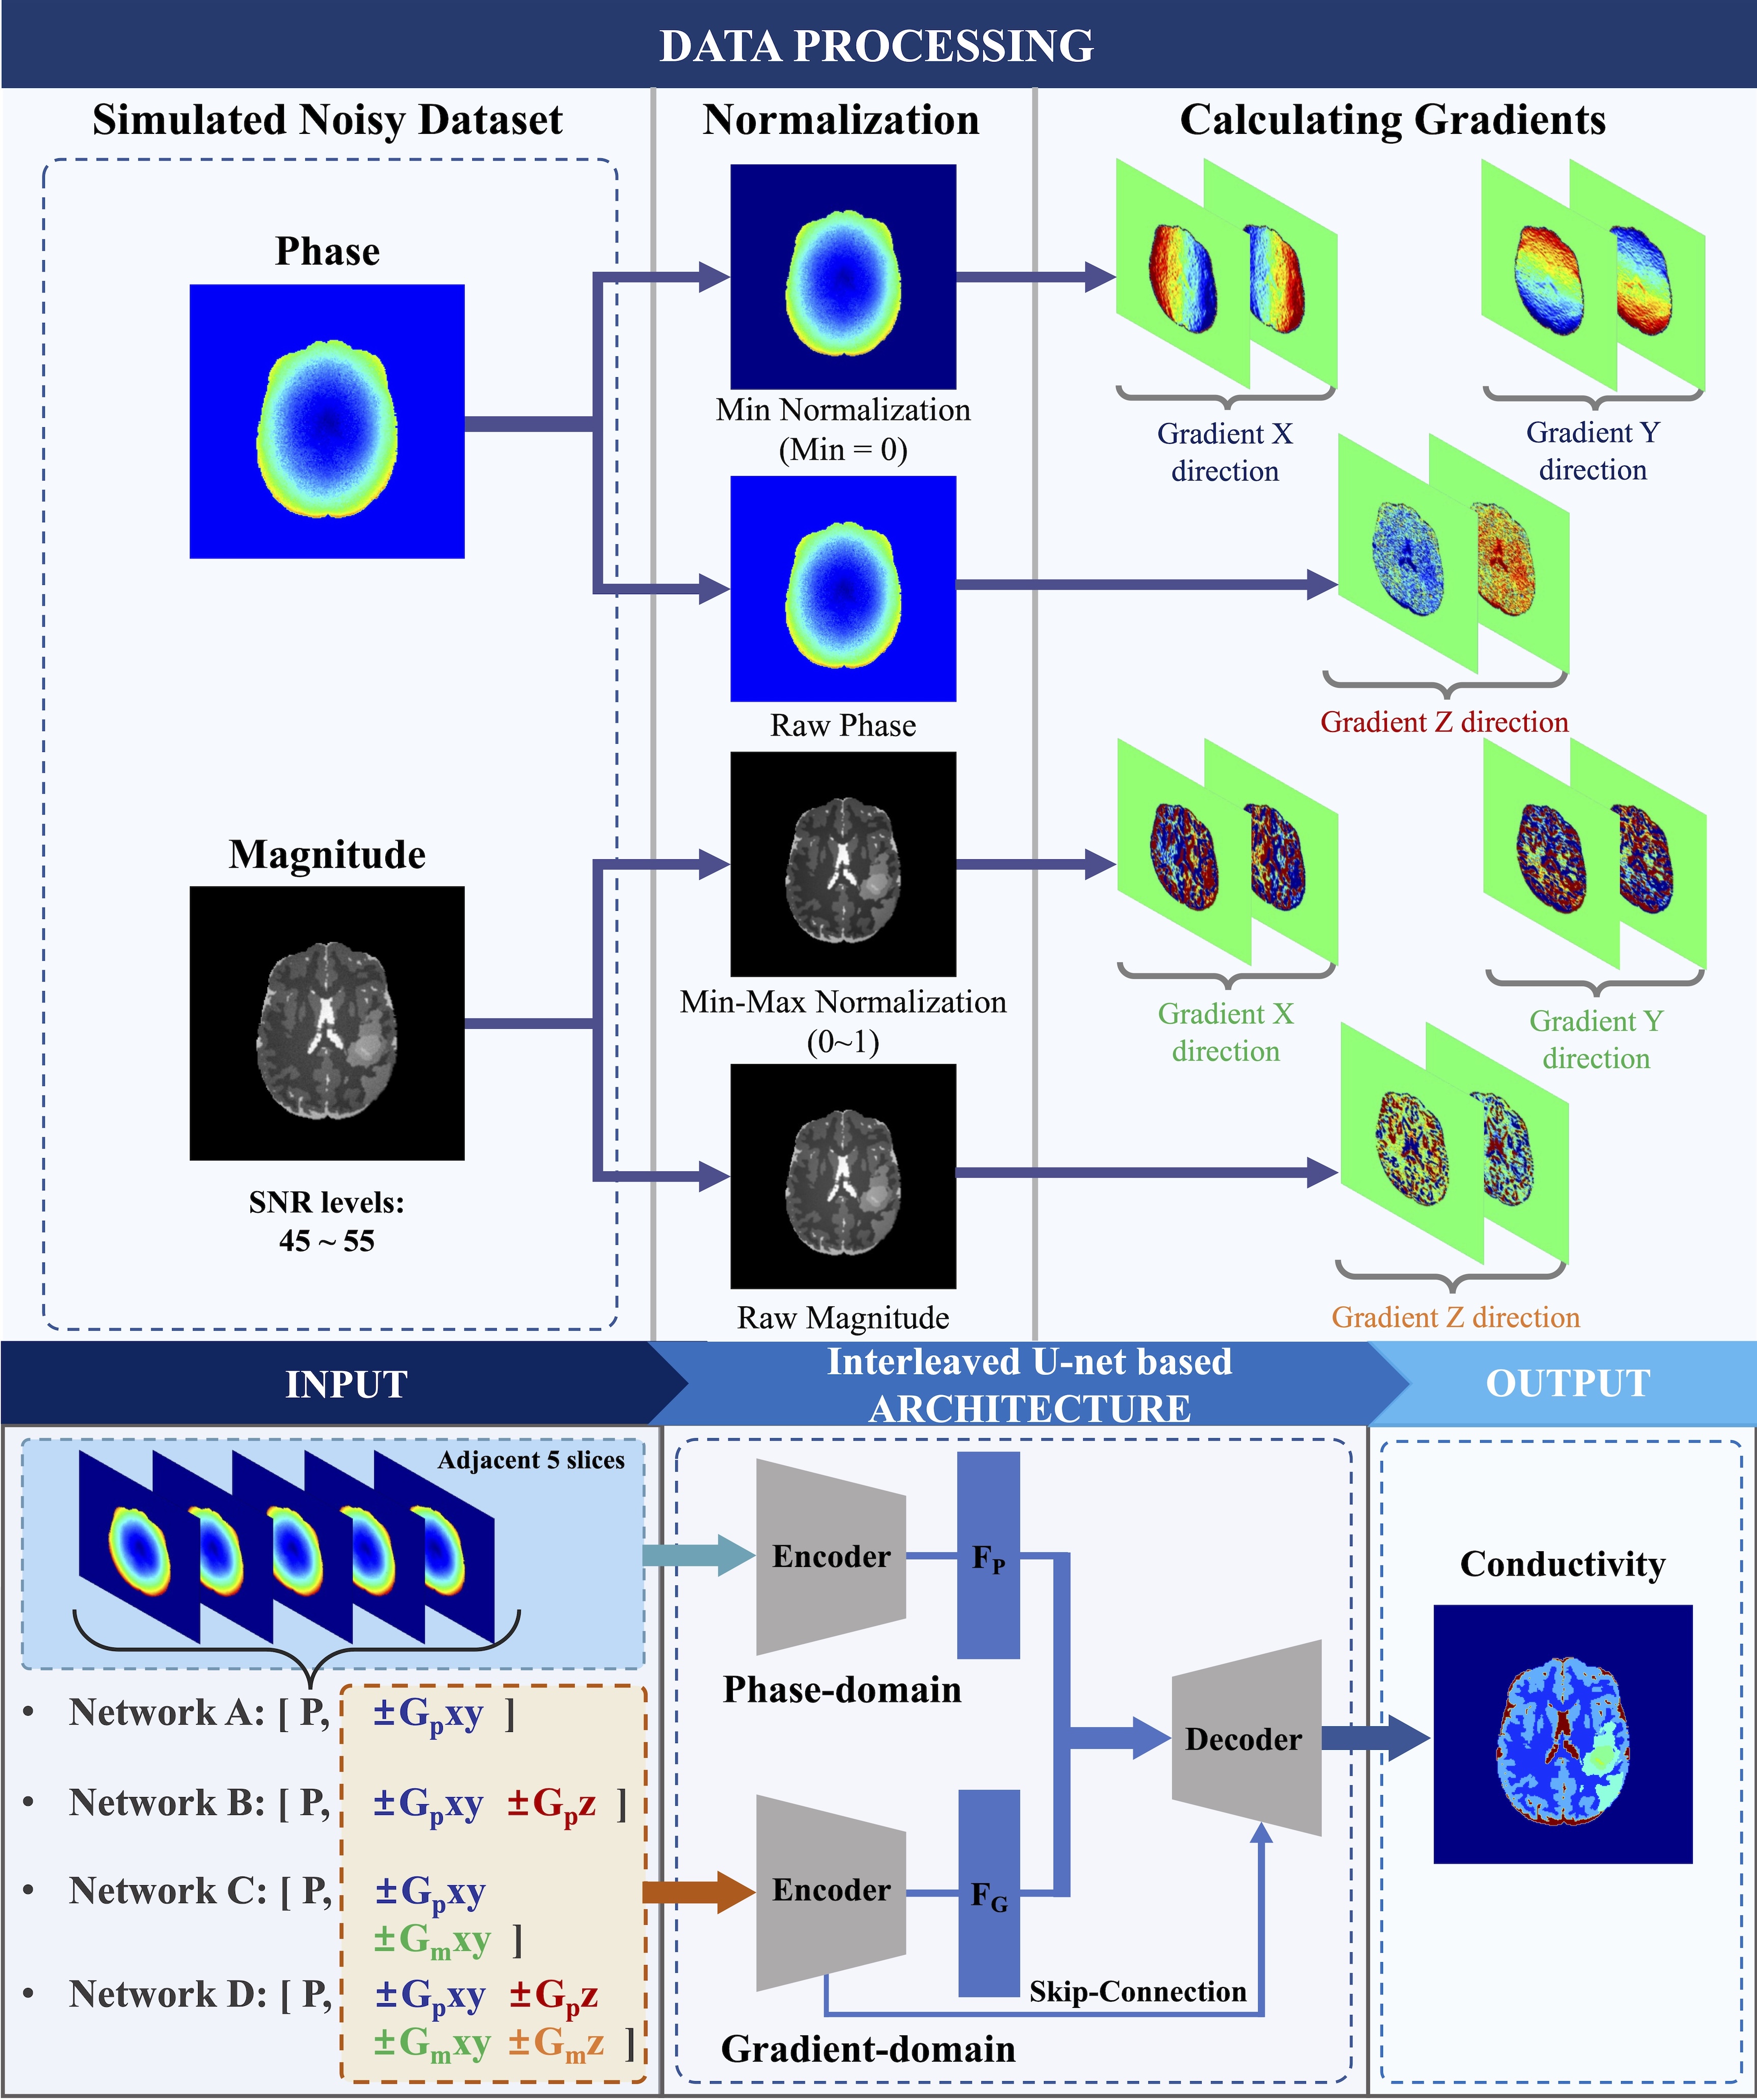
From the ADEPT database8, 114 brain models and transceive phase maps simulated in Sim4Life9,10 at 128MHz (Zurich MedTech, Switzerland) were used (2-to-1 ratio between healthy/pathological brain models). Synthetic T2-weighted contrast maps were also generated for each brain model5. Random Gaussian noise (SNR=50) was added to mimic the SNR levels in T2-weighted brain MRI. These models were used for network training.Four networks were trained using the phase of the slice of interest and the phase of 4 adjacent slices (2 slices before and 2 after) as input for the first encoder, thus including through-plane phase information (z-direction). A second encoder included the gradient of the transceive phase and signal magnitude. The input for this second encoder differs for the four networks as shown in Figure 1: Network A: only ±$$$\triangledown{\phi}_{xy}$$$; Network B: ± $$$\triangledown{\phi}_{xyz}$$$; Network C: ±$$$\triangledown{\phi}_{xy}$$$, ±$$$\triangledown{M}_{xy}$$$; Network D: ±$$$\triangledown{\phi}_{xyz}$$$, ±$$$\triangledown{M}_{xyz}$$$; leading to a maximum of 60 input channels.
The features extracted from each encoder were fused within a single decoder. An attention mechanism11 was used to strengthen the correlation between adjacent slices. To compensate for the lack of structural information in the phase domain, a skip connection from the gradient domain was introduced.
Network testing was the conducted on: 1) additional brain models from ADEPT: 2 head models (one healthy and one pathological); 2) a healthy volunteer using a 3T MAGNETOM Vida from Siemens Healthineers; 3) a patient with brain tumor using a 3T MR750 from GE.
Results and Discussion
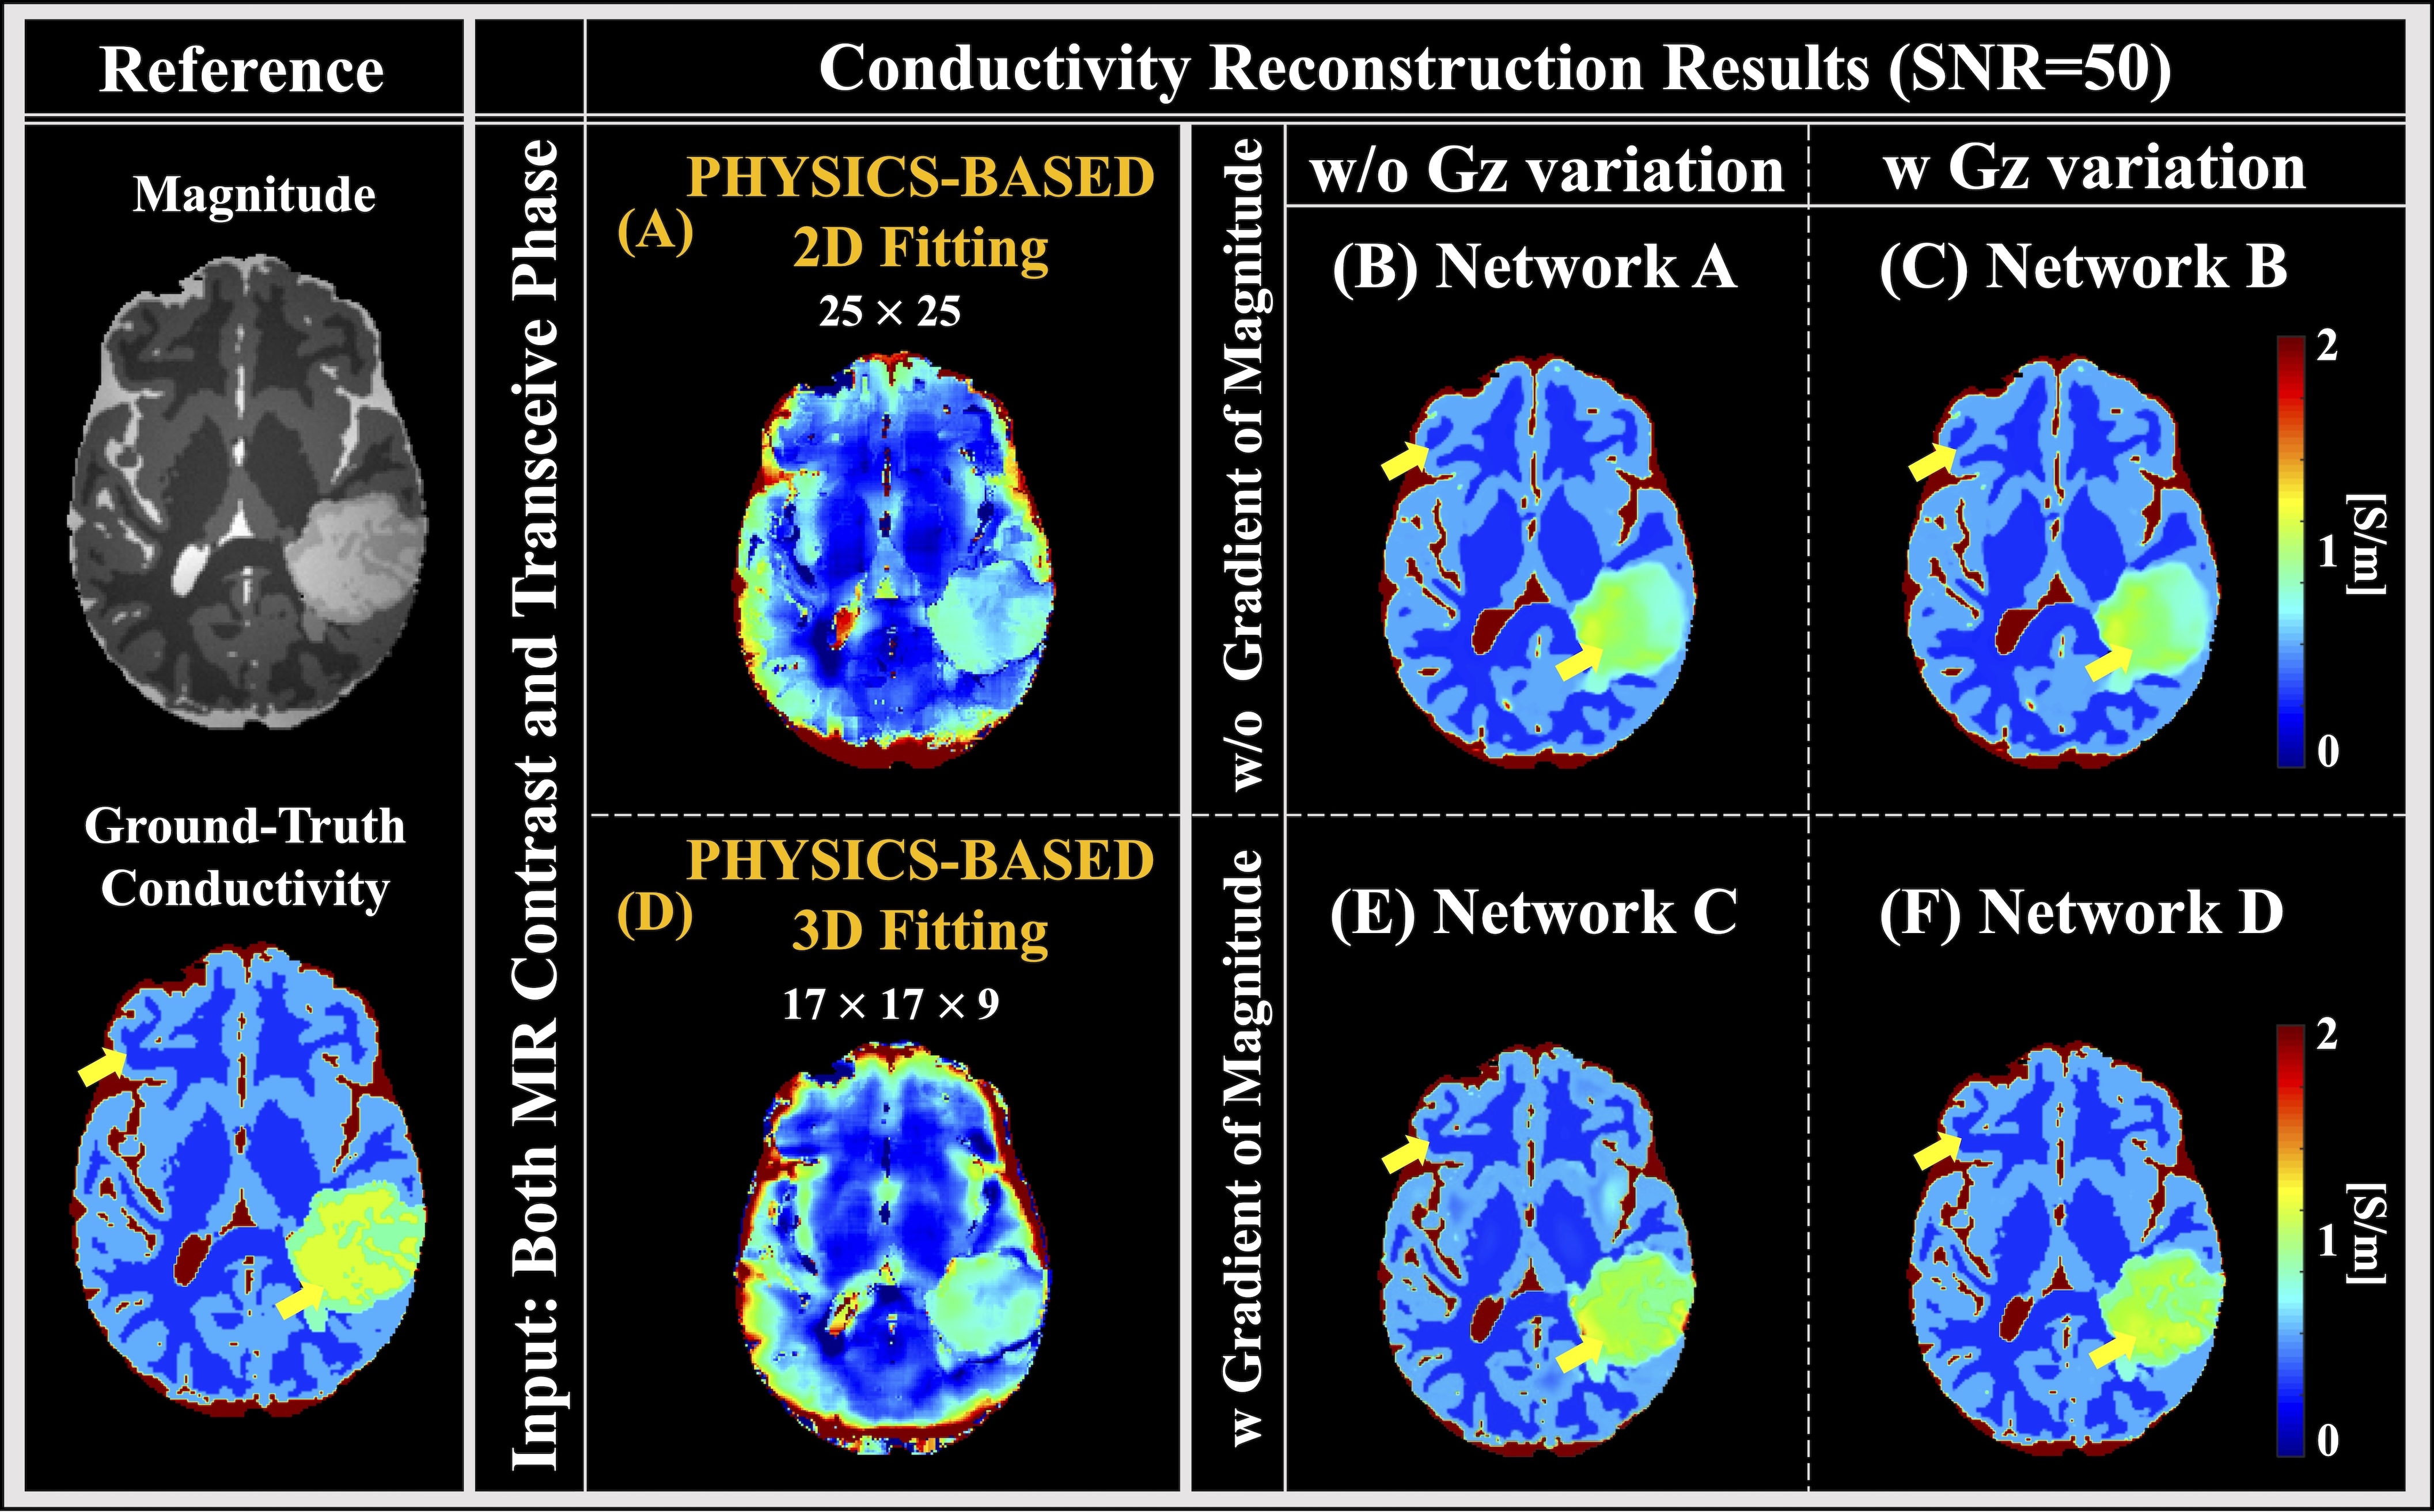
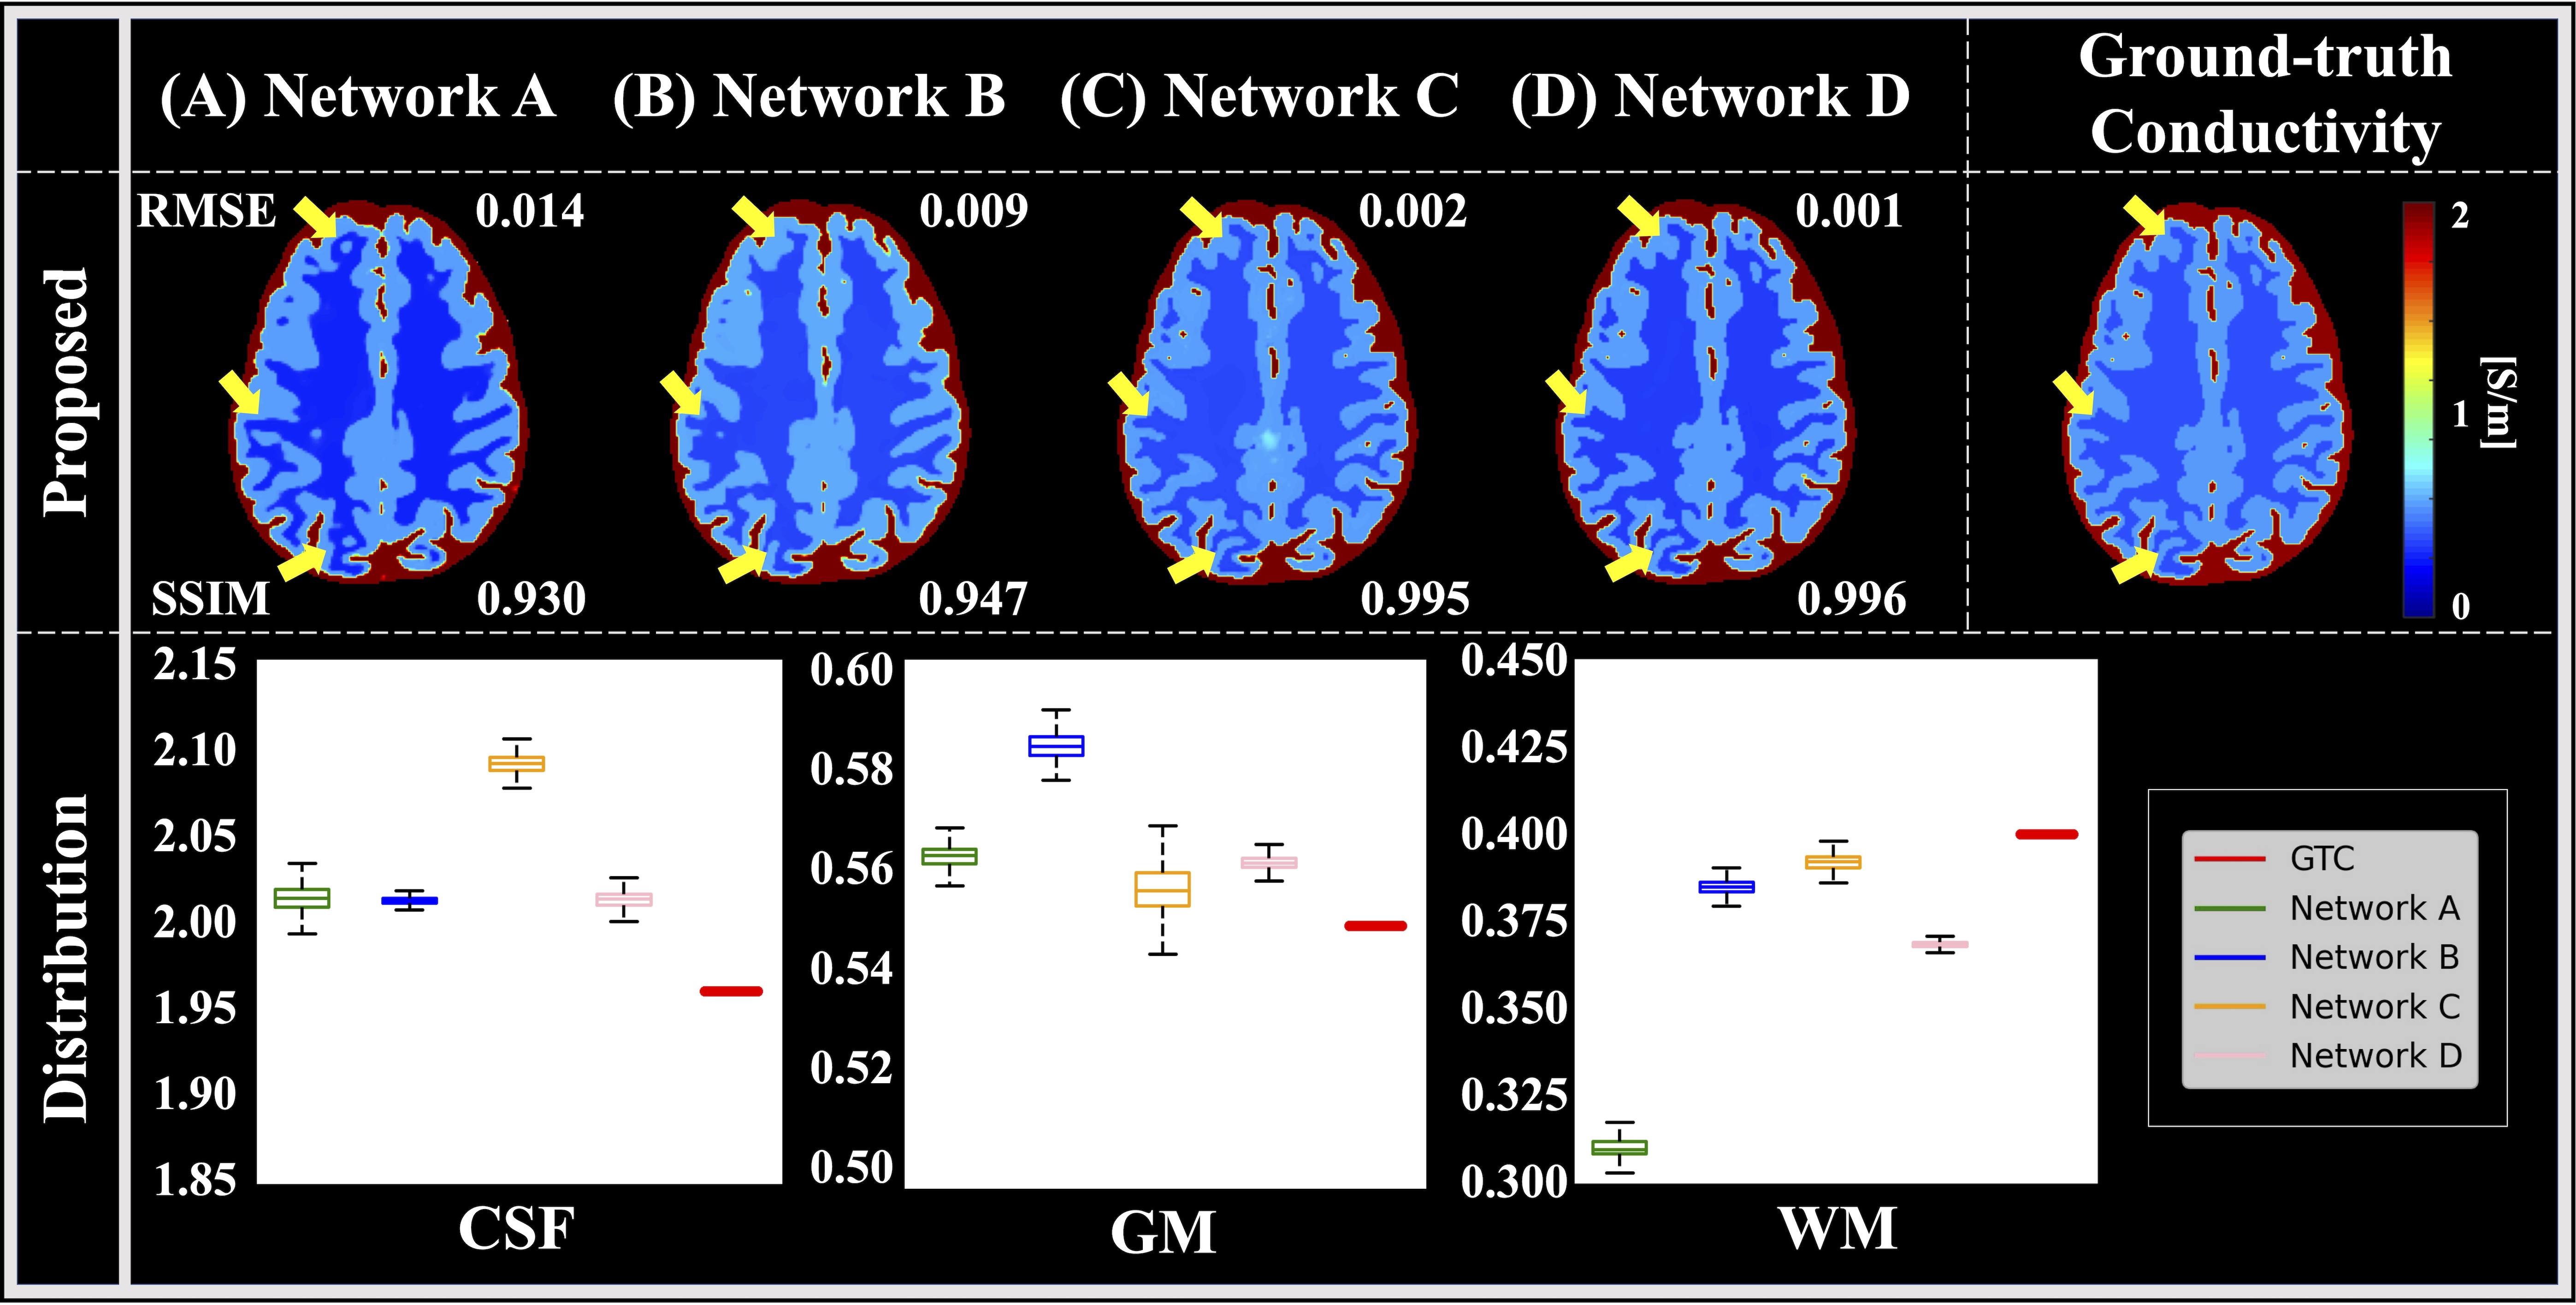
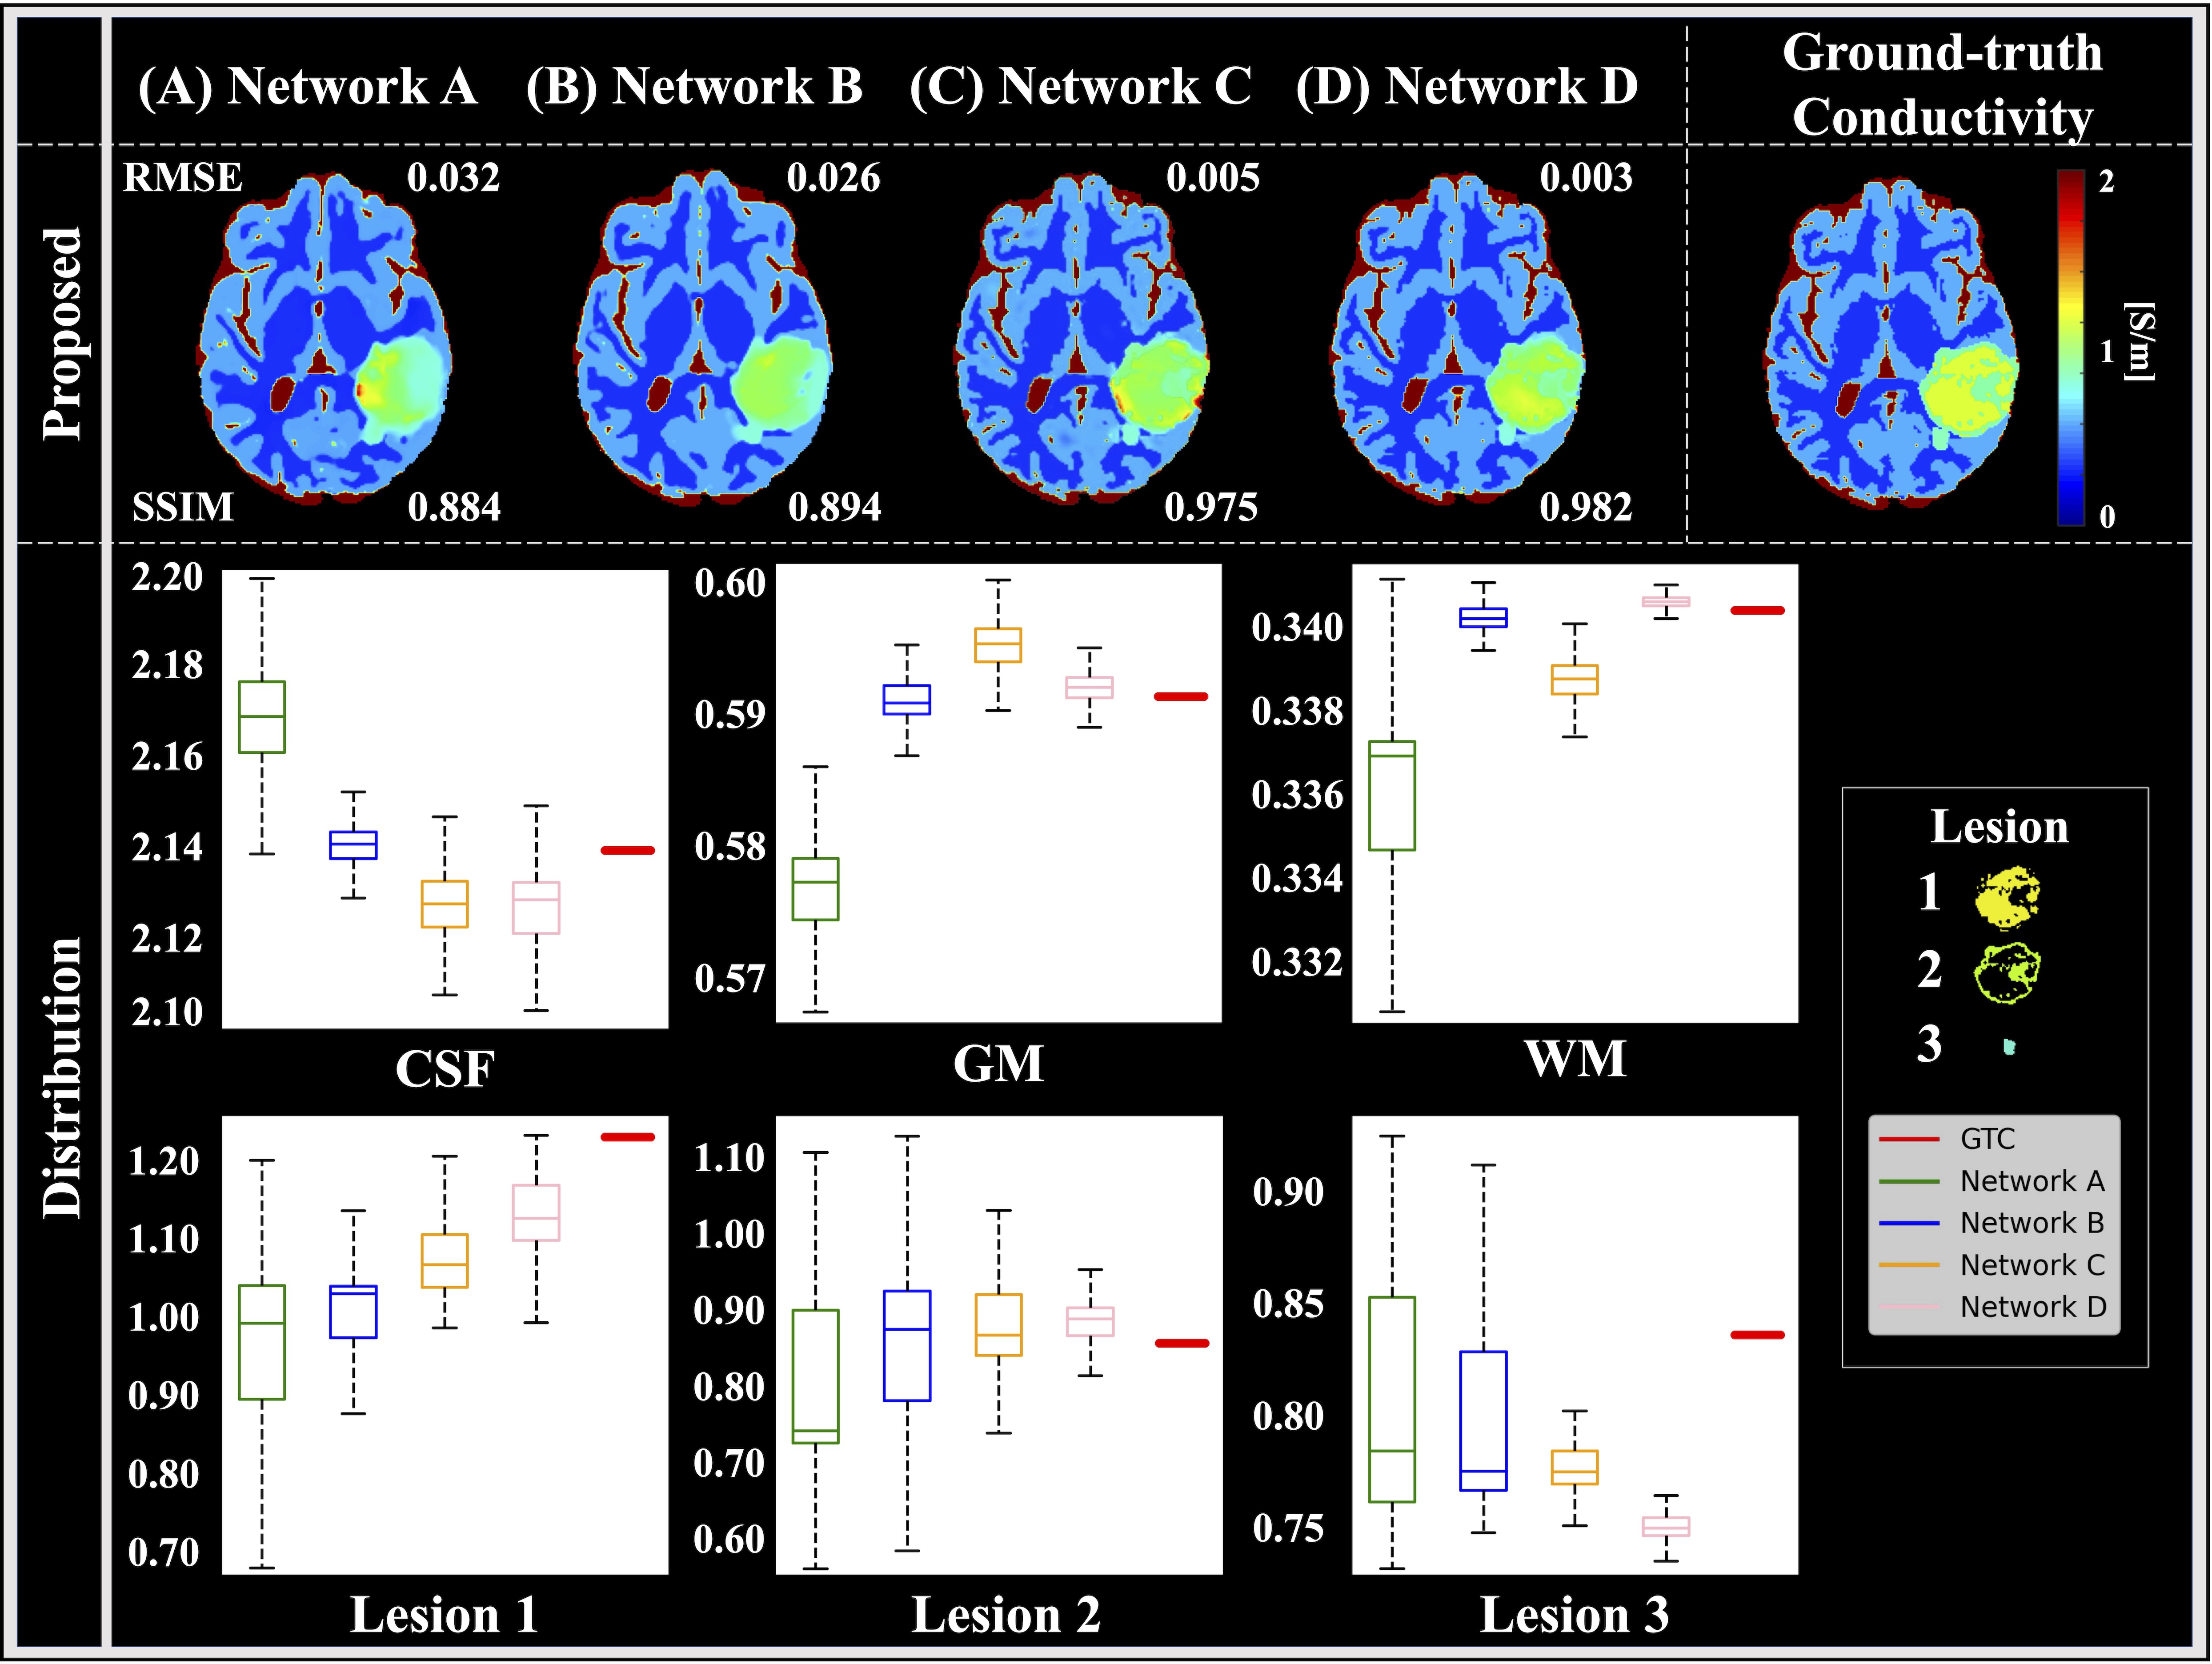
Figure 2 A/D presents 2D/3D conductivity reconstructions using existing physics-based methods as independent references. The four proposed networks (B/C/E/F) better capture the fine details of structural information (yellow-arrows). When the gradients of the phase and magnitude information along the z-direction are included (C/F vs B/E), increased accuracy and reduced boundary errors are observed.Figure 3 and 4 show conductivity reconstructions on a healthy brain model (Fig.3) and tumor brain model (Fig.4) for the four networks. They also show an ROI analysis including the mean±SD of the reconstructed values in white/gray matter (WM/GM), CSF, and tumor. These results indicate that inclusion of the gradients of the transceive phase and tissue magnitude along the z-direction (Network-D) provide the most accurate results; lowest RMSE and the highest SSIM with respect to the tissue magnitude map.
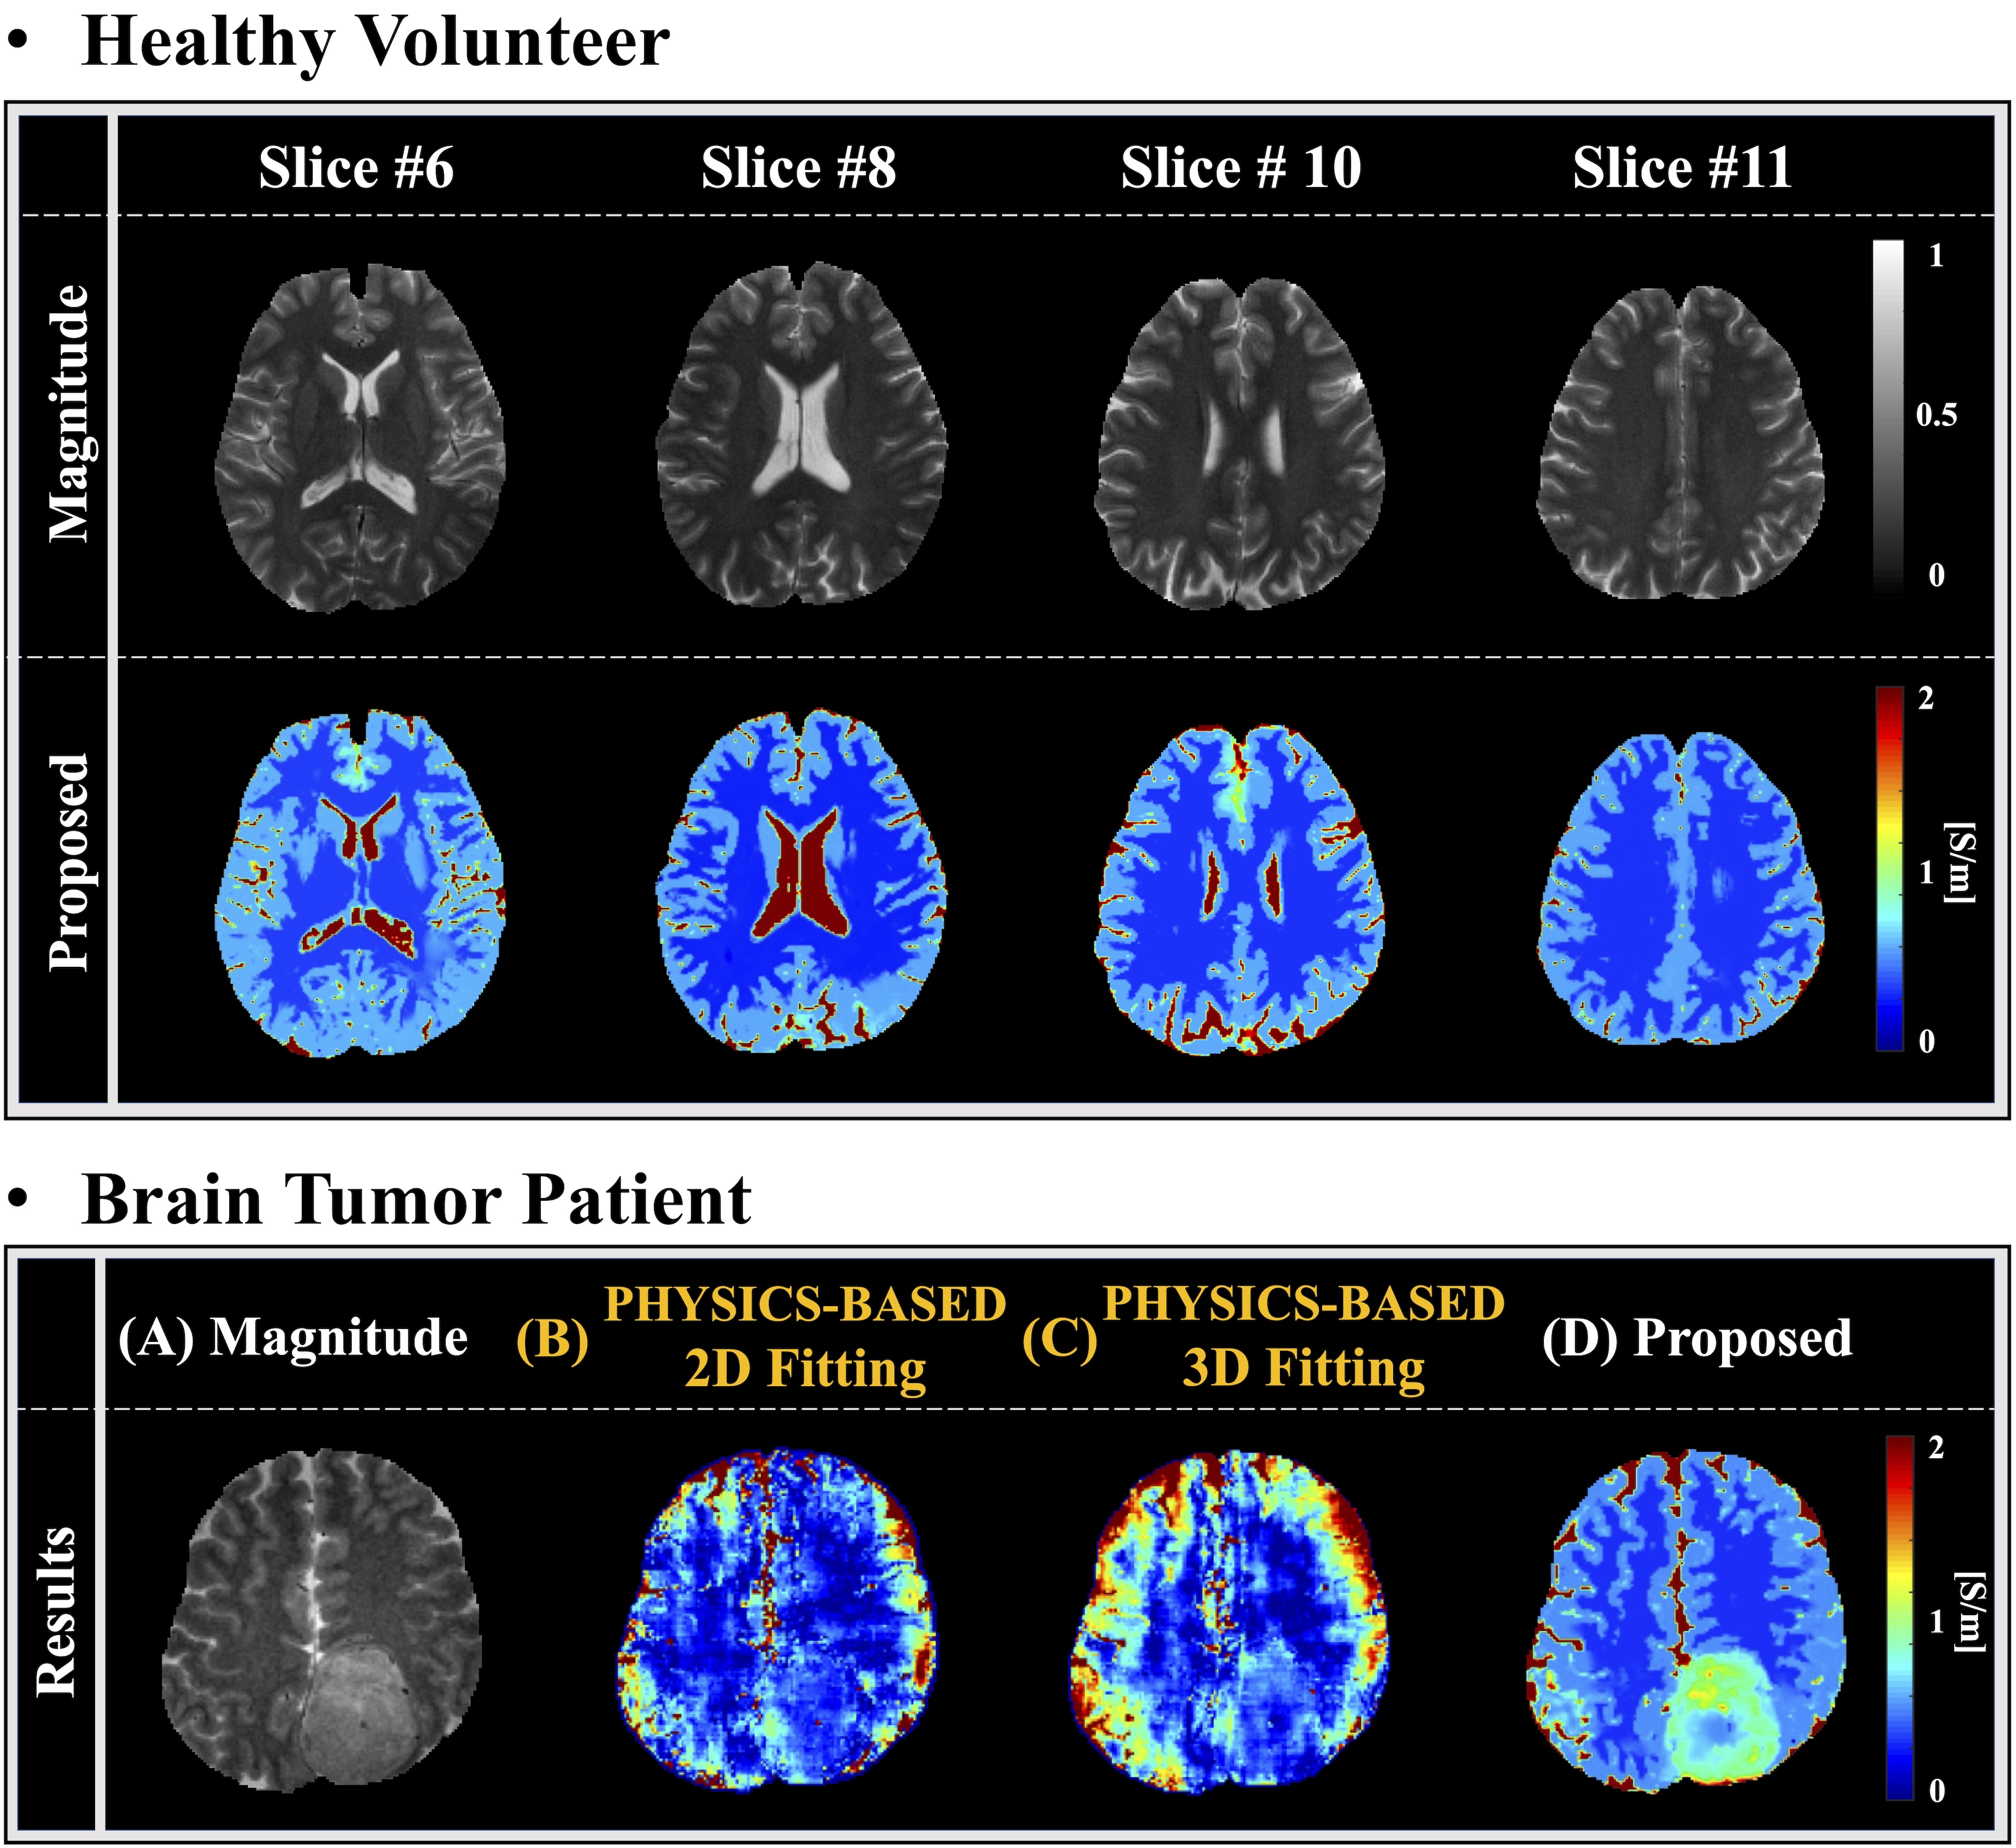
Figure 5 displays the results for in-vivo conductivity reconstructions using Network-D on a healthy volunteer for different slices (Top), and patient (Bottom).
Reconstructions on the healthy volunteer show good quality conductivity maps. This is also reflected in the patient conductivity reconstruction. The proposed method shows better quality reconstructions compared to other two physics-based reconstruction methods proposed here as independent references (B, C). The conductivity reconstructions using our proposed Network-D (D) also captures intra–lesion conductivity variations which was not visible with previous methods.
Conclusion
We presented a novel deep learning-based approach to reconstruct conductivity maps, leveraging information from both phase and magnitude data from all three imaging directions, thus including through-plane phase contributions, which are often discarded. The results show accurate reconstructions with reduced boundary errors, demonstrating the importance of including through-plane phase information and the gradient of the signal magnitude.Acknowledgements
This work received funding from the Netherlands Organization for Scientific Research (NWO; VENI grant no. 18078).
The last two authors share last authorship.
References
[1] Katscher U, et al., Determination of Electric Conductivity and Local SAR Via B1 Mapping. IEEE transactions on medical imaging, 2009;28(9):1365-1374.
[2] Voigt T, et al., Quantitative conductivity and permittivity imaging of the human brain using electrical properties tomography. Magnetic Resonance in Medicine, 2011;66(2):456-466.
[3] Mandija, S., et al., Error analysis of helmholtz‐based MR‐electrical properties tomography. Magnetic Resonance in Medicine, 2018;80(1): 90-100.
[4] Mandija, S., Meliadò, E. F., Huttinga, N. R., Luijten, P. R., & van den Berg, C. A. (2019). Opening a new window on MR-based electrical properties tomography with deep learning. Scientific reports, 9(1), 1-9.
[5] Jung, K.-J., Mandija, S., Cui, C., Kim, J.-H., Al-masni, M. A., Meerbothe, T. G., Park, M., van den Berg, C. A. T., & Kim, D.-H. (2023). Data-driven electrical conductivity brain imaging using 3 T MRI. Human Brain Mapping, 44(15), 4986–5001.
[6] A. J. G. Inda, S. Y. Huang, N. İmamoğlu, and W. Yu, "Physics-coupled neural network magnetic resonance electrical property tomography (mrept) for conductivity reconstruction," IEEE Transactions on Image Processing, vol. 31, pp. 3463-3478, 2022.
[7] Jung, K-J., et al, K. A Deep learning Informed Polynomial Fitting Approach for Electrical Properties Tomography. 2023 ISMRM Annual Meeting, 3-8 June 2023.
[8] Meerbothe, T.G., et al., Electrical properties tomography: A database for MR-based electrical properties tomography with in silico brain data-ADEPT, Magnetic Resonance in Medicine, 2023; Online Published.
[9] Christ, A., et al., The virtual family—Development of surface-based anatomical models of two adults and two children for dosimetric simulations, Physics in Medicine & Biology, 2009;55(2): N23-N38.
[10] Gosselin, M.C., et al., Development of a new generation of high-resolution anatomical models for medical device evaluation: The virtual population 3.0, Physics in Medicine & Biology, 2014;59(18): 5287-5303.
[11] Hu, Jie, Li Shen, and Gang Sun, Squeeze-and-excitation networks. Proceedings of the IEEE conference on computer vision and pattern recognition, 2018; 7132-7141.
Figures