0182
The first MR Electrical Properties Tomography (MR-EPT) reconstruction challenge: preliminary results of simulated data1Department of Radiotherapy, University Medical Center Utrecht, Utrecht, Netherlands, 2Computational Imaging Group for MR Therapy and Diagnostics, University Medical Center Utrecht, Utrecht, Netherlands, 3Istituto Nazionale di Ricerca Metrologica (INRiM), Torino, Italy, 4Department of Medical Physics and Biomedical Engineering, University College London, London, United Kingdom, 5The Bernard and Irene Schwartz Center for Biomedical Imaging, Department of Radiology, New York University Grossman School of Medicine, New York, NY, United States, 6Department of Biomedical Engineering, Baskent University, Ankara, Turkey, 7Department of Electrical and Electronic Engineering, Yonsei University, Seoul, Korea, Republic of, 8Philips Research Hamburg, Hamburg, Germany, 9Center for Advanced Imaging Innovation and Research (CAI2R), Department of Radiology, New York University Grossman School of Medicine, New York, NY, United States, 10Hokkaido University Faculty of Medicine, Hokkaido, Japan
Synopsis
Keywords: Electromagnetic Tissue Properties, Electromagnetic Tissue Properties, Conductivity
Motivation: To benchmark MR-Electrical Properties Tomography (MR-EPT) reconstruction methods.
Goal(s): To present an overview of the first MR-EPT reconstruction challenge participation and the results of its phase 1.
Approach: The challenge consisted of 3 phases:1) reconstructions from a simulated (blind) dataset (ground-truth EPs not provided);2) reconstructions from several simulated dataset (ground-truth EPs provided for few training dataset for tuning algorithm parameters);3) EPs reconstructions from measured data.
Results: 52 participants registered to the challenge; 39 submitted their results. For phase 1, all participants submitted a reconstructed conductivity map; 12 submitted a reconstructed permittivity map. The results show large variability in reconstruction accuracy and precision.
Impact: The results of phase 1 of the first MR-EPT reconstruction challenge show large variations in the estimated conductivity and permittivity maps demonstrating the need of benchmarking reconstruction methods on common datasets.
Introduction
MR-Electrical Properties Tomography (MR-EPT) aims at reconstructing tissue electrical properties (EPs: conductivity and permittivity) at megahertz frequencies from MRI measurements. Several reconstruction methods have been presented1,2, but an objective comparison is currently missing. To fill this gap, the first MR-EPT reconstruction challenge was proposed during the 2021 ISMRM Annual Meeting, with the goal to better understand the strengths and weaknesses of the current reconstruction methods in a systematic manner3. The challenge was launched in February 2023 and closed in August 2023. It consisted of three phases, the first two based on simulated data and the last on measured data. Here, we present an overview of the challenge participation and the results of the first phase.Methods
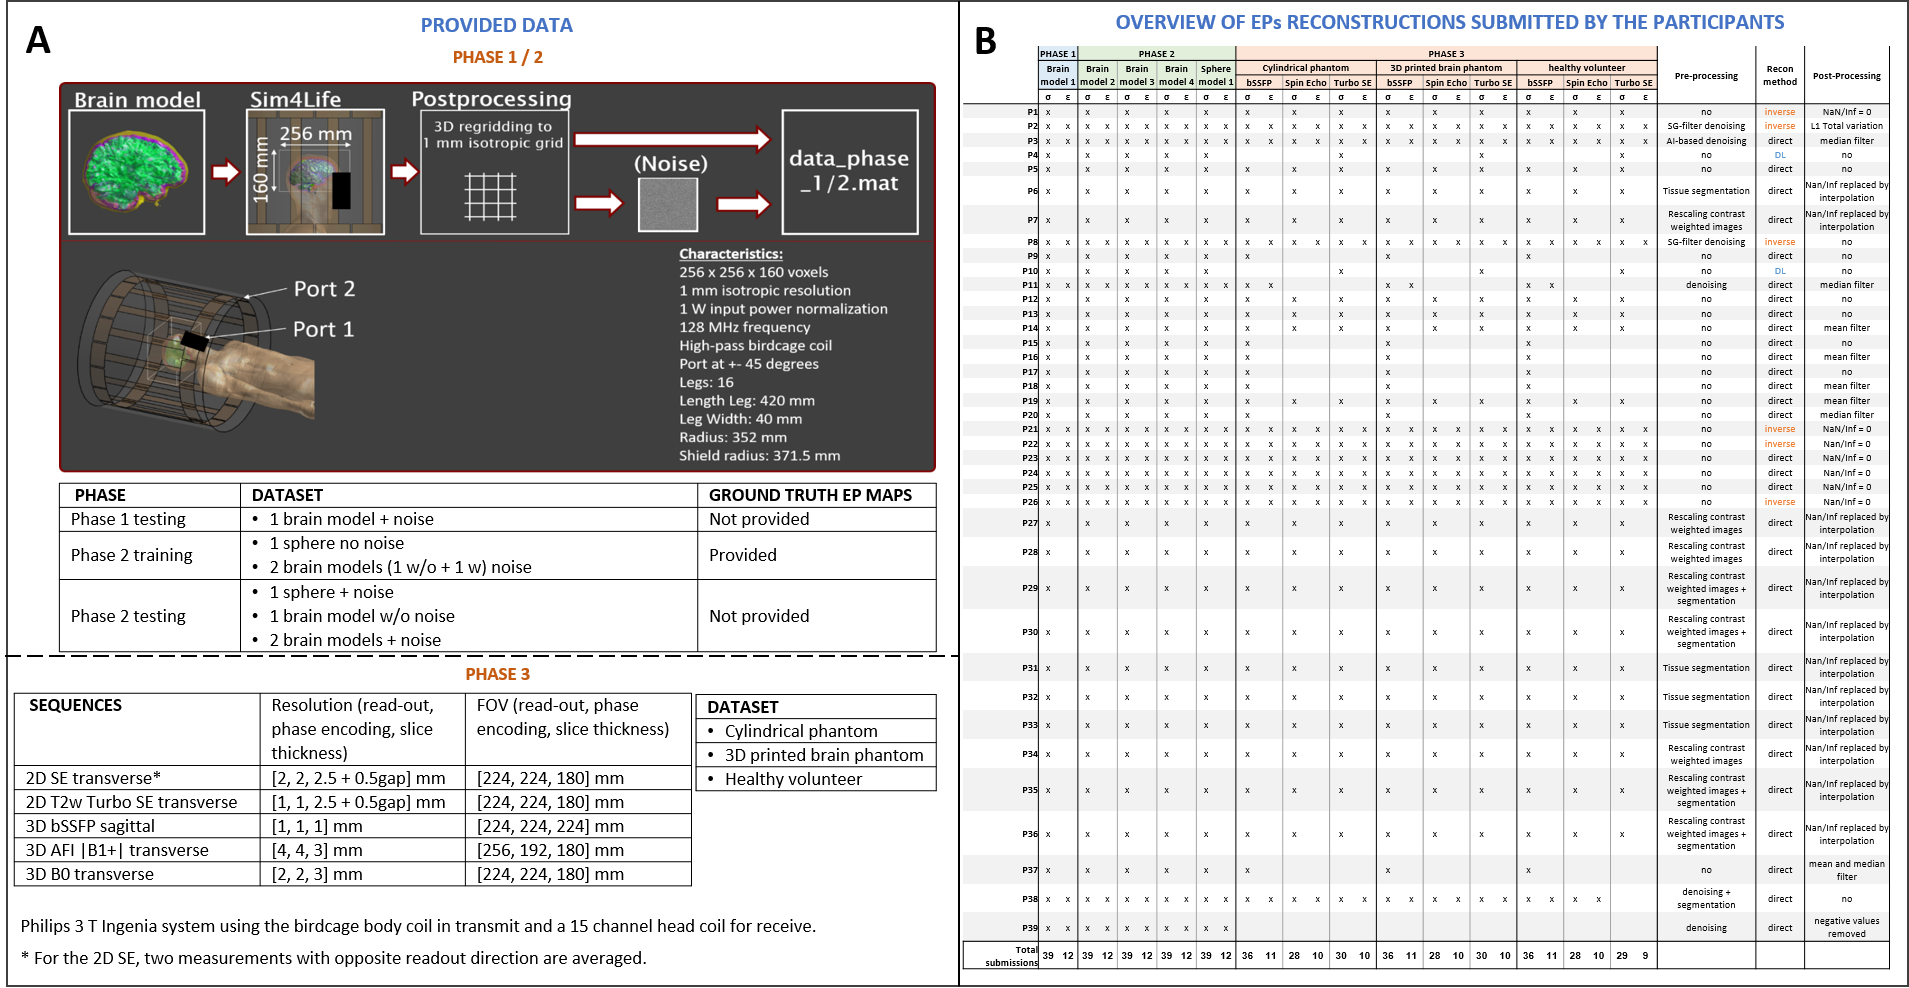
In the first phase of the MR-EPT reconstruction challenge, the participants were asked to reconstruct the conductivity and, if possible, the permittivity from simulated data using a brain model. The data were simulated in Sim4Life (Zurich MedTech, Zwitserland) at 128 MHz, corresponding to 3 T MRI, using a quadrature birdcage coil for transmit and receive (Fig. 1A, top part)4. The participants were given the following data:- |B1+| quadrature mode;
- |B1+| using channel 1 (single port simulation);
- |B1+| using channel 2 (single port simulation);
- Approximated transmit phase: half of the simulated transceive phase computed by averaging the transmit phase from a quadrature simulation and the receive phase employing and anti-quadrature drive;
- Synthetic T1-weighted image;
- Synthetic T2-weighted image.
For the transceive phase, first we computed the complex T1-weighted signal using the noiseless T1-weighted and transceive phase (simulating a Spin Echo image). Noise was added independently to the real and imaginary components to obtain SNR = 80 for the noisy T1-weighted magnitude. Similar approach was used for the T2-weighted magnitude. We assigned a lower SNR to |B1+| than to the transceive phase (i.e., the synthetic images) to reflect typical SNR levels in standard MRI acquisitions. The provided datasets were masked to include only white matter (WM), gray matter (GM), and cerebrospinal fluid (CSF).
For each tissue, the following values were computed before and after 2 and 4 voxels erosion to exclude reconstruction errors at tissue boundaries from the analysis (using the Matlab function “imerode” from the Image Processing Toolbox) of the tissue masks: mean, standard deviation, median, interquartile ranges, normalized-root-mean-squared-error (NRMSE). The NRMSE and structural-similarity-index-measure (SSIM) were also computed for the whole brain mask.
A complete overview of the data provided for the three phases of the challenge is given in Fig. 1A.
Results and Discussion
Initially, 52 participants registered to the challenge, but only 39 submitted their results (33 from Europe, 4 from Asia, 2 from United States). An overview of the submitted reconstructions for all 3 phases is shown in Fig. 1B, including the pre-processing, post-processing methods and the type of reconstruction (direct, inverse, deep learning).The following results focus on phase 1 only. All 39 participants submitted a reconstructed conductivity map, while 12 submitted also a reconstructed permittivity map.
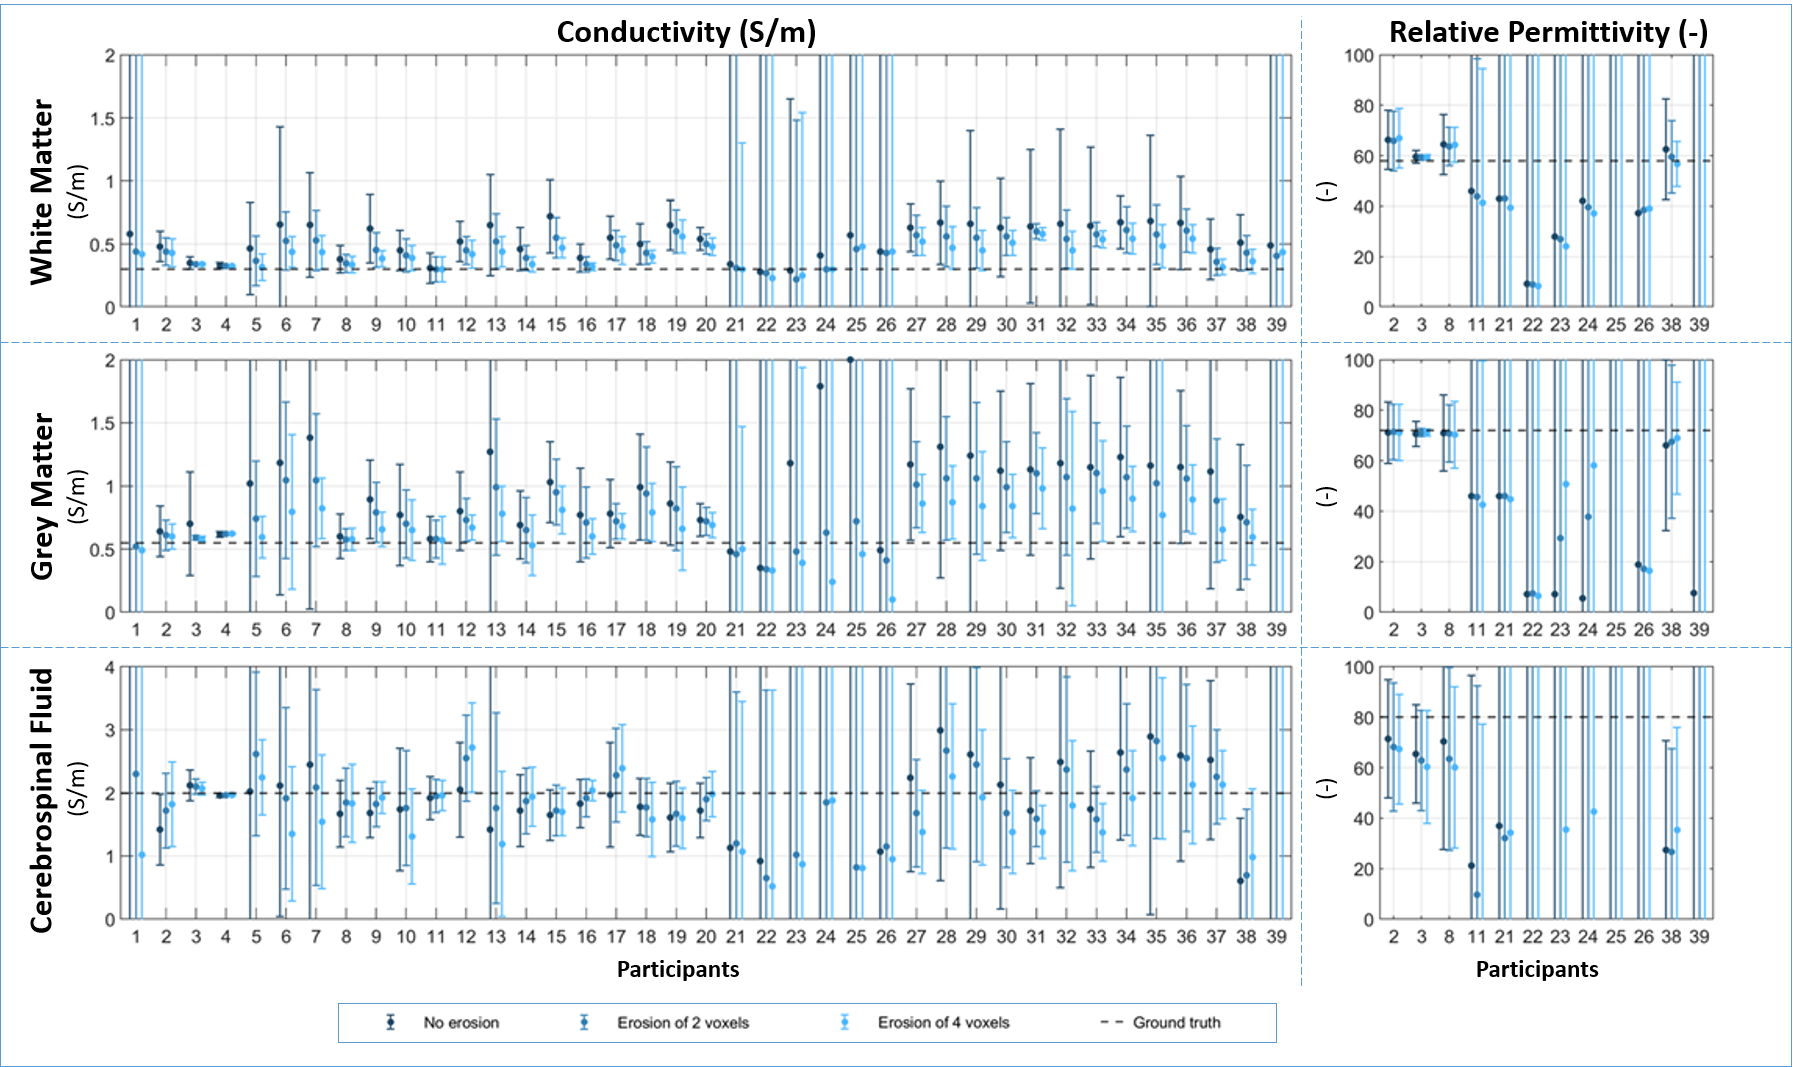
Figure 2 shows the mean and standard deviation of the reconstructed EP maps in each tissue before and after erosion of tissue boundaries.
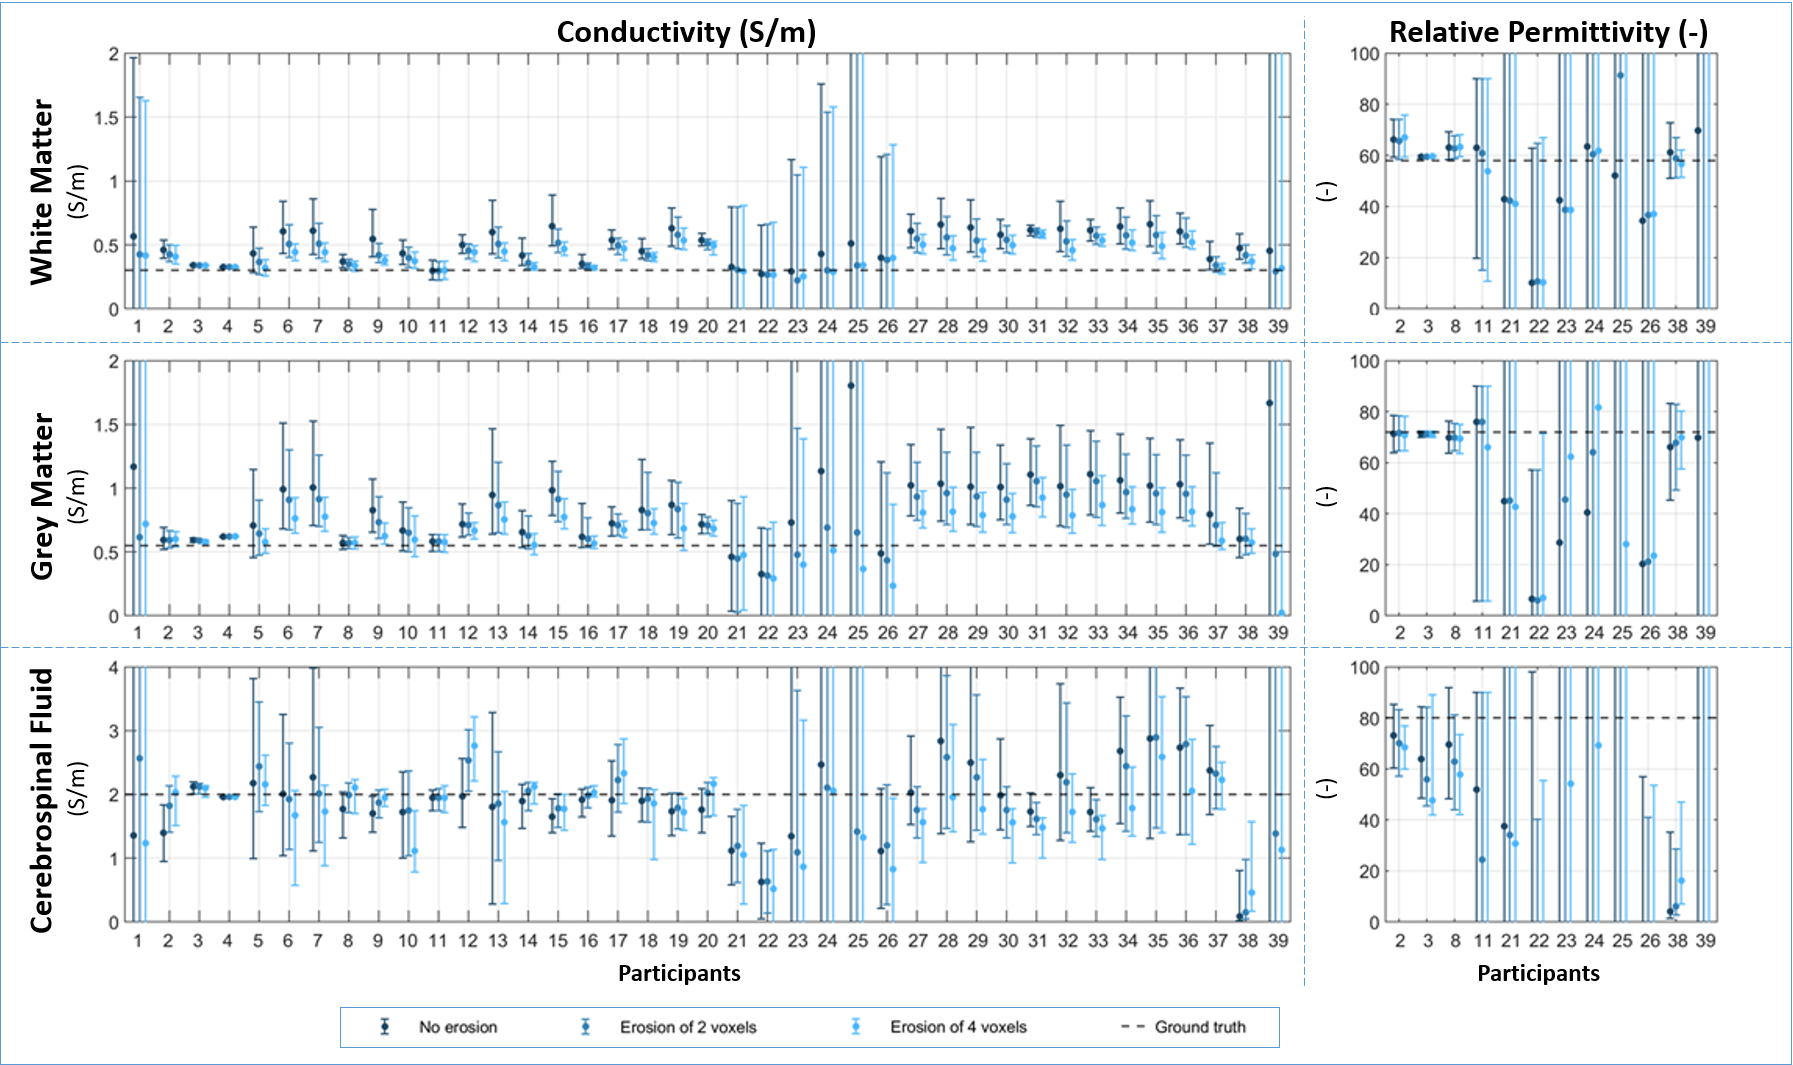
Figure 3 shows the median and interquartile ranges of the reconstructed EP maps in each tissue before and after erosion of tissue boundaries.
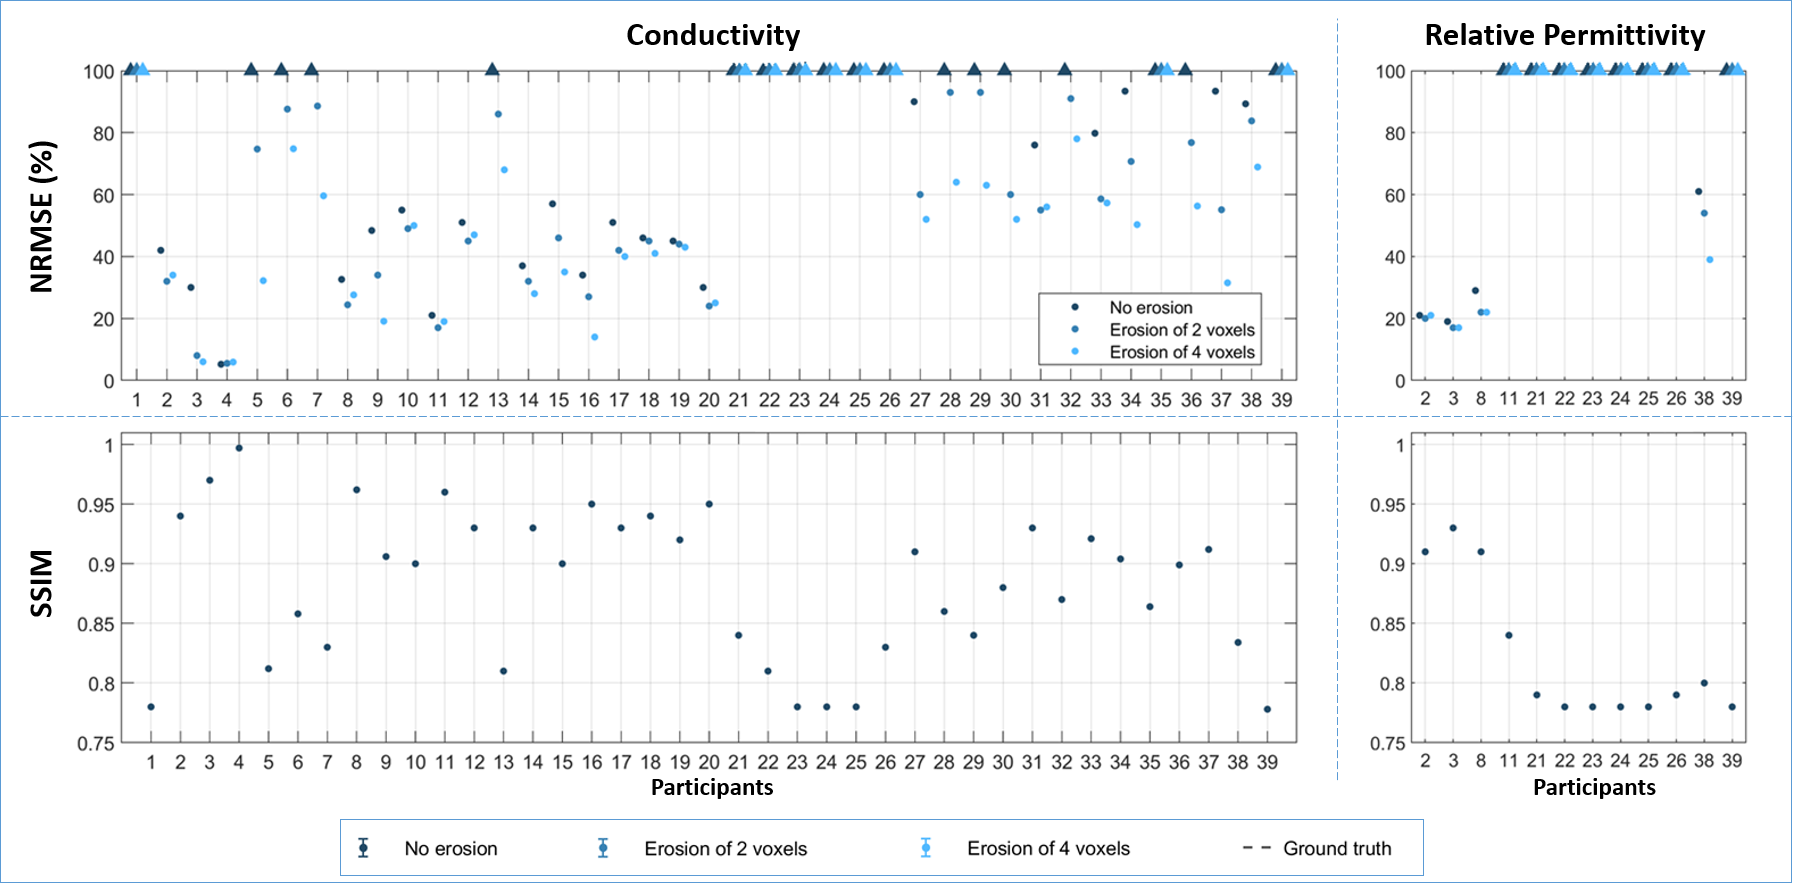
Figure 4 shows the overall NRMSE before and after erosion of tissue boundaries as well as the SSIM. The results show a large variability in reconstruction accuracy and precision for the given blind dataset (the ground truth was not provided to participants), demonstrating the need of benchmarking reconstruction methods on common datasets.
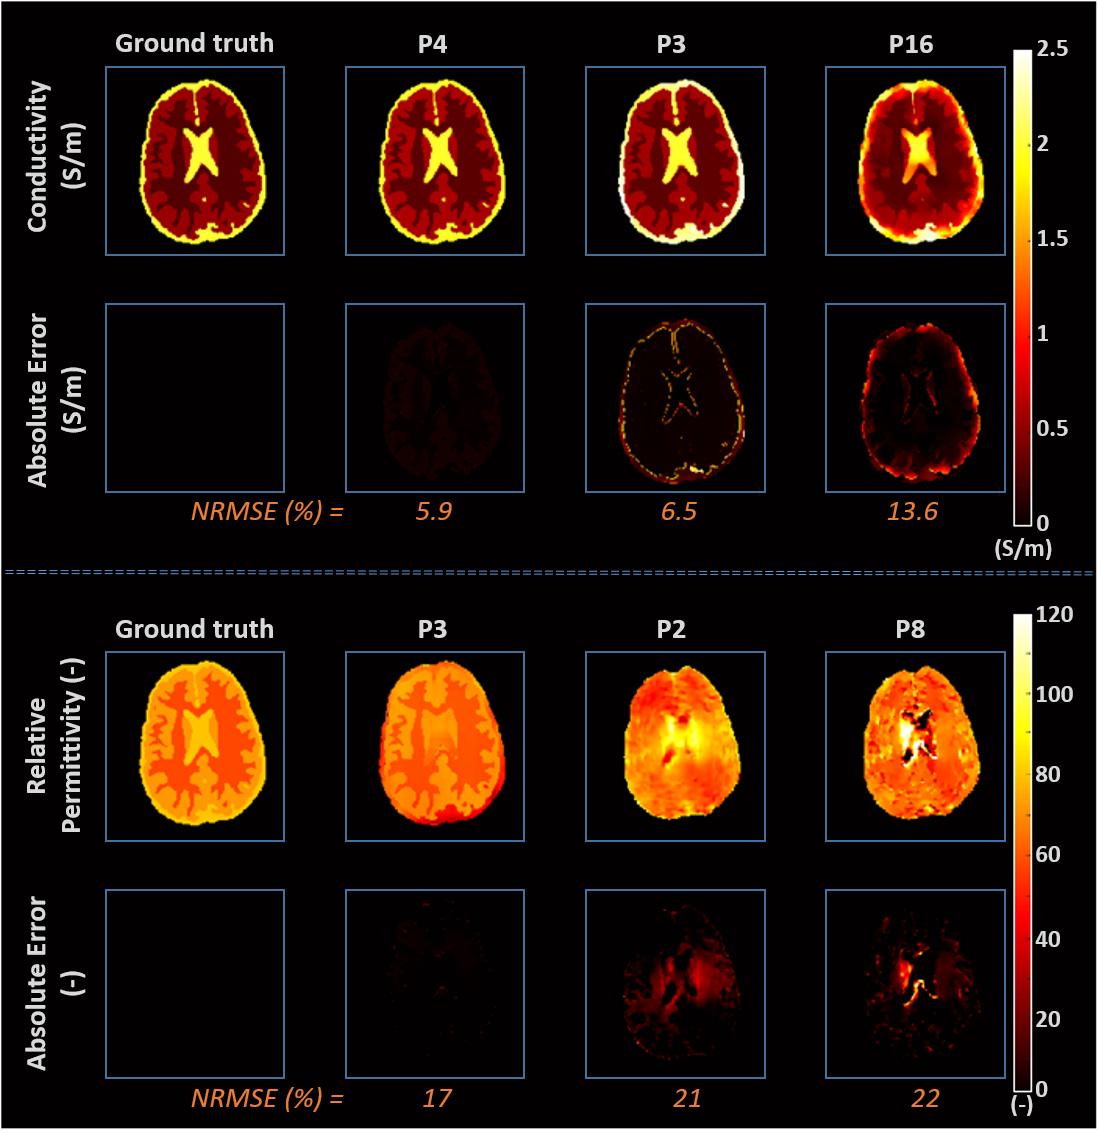
Figure 5 shows an example of the reconstructed EP maps for the center slice of the brain model for the 3 reconstructions with lowest overall NRMSE after erosion of 4 voxels at tissue boundaries. Future analysis for phase 1 will focus on understanding the impact of boundary errors, pre-processing and post-processing approaches. These analyses will be extended to the reconstructions in phase 2. We aim at presenting these at the upcoming annual meeting of the ISMRM. Phase 3 analyses will follow afterwards (indicatively summer 2024).
Conclusions
This work presents the overview of the submissions to the first MR-EPT reconstruction challenge and the results of its phase 1. These results show a large variability in the reconstructed accuracy and precision for the different reconstruction methods. This demonstrates the need of benchmarking the developed MR-EPT methods on common datasets.Acknowledgements
This work has been financed by the Netherlands Organisation for Scientific Research (NWO): Veni grant number 18078.
Challenge coordinator: SM.
Hands-On Committee: AA, PF, IG, KJJ, TGM. Advisory Committee: CATvdB, YZI, UK, DHK, RL, KKT, LZ.
*Co-authors are reported in alphabetic order.
References
1) Katscher, U, van den Berg, CAT. Electric properties tomography: Biochemical, physical and technical background, evaluation and clinical applications. NMR in Biomedicine. 2017; 30:e3729. https://doi.org/10.1002/nbm.3729
2) Leijsen R, Brink W, van den Berg CAT, Webb A, Remis R. Electrical properties tomography: a methodological review. Diagnostics 2021;11:176. doi:10.3390/diagnostics11020176
3) Mandija S, van den Berg CAT. The first MR electrical properties tomography (MR-EPT) reconstruction challenge. In: Proceedings of the 31stAnnual Meeting of ISMRM, London; 2022:Abstract #704.
4) Meerbothe, TG, Meliado, EF, Stijnman, PRS, van den Berg, CAT, Mandija, S. A database for MR-based electrical properties tomography with in silico brain data—ADEPT. Magn Reson Med. 2023; 1-10. doi: 10.1002/mrm.29904
Figures