0181
A Radiogenomics Model for Classifying Molecular Subtypes of Endometrial Cancer: A Two-Center Retrospective Study1Department of Radiology, Beijing Chaoyang Hospital, Capital Medical University, Beijing, China, 2Department of Gynecology and Obstetrics, Beijing Chaoyang Hospital, CapitalMedical University, Beijing, China, 3Institute of Research and Clinical Innovations, Neusoft Medical Systems Co., Ltd, Beijing, China, 4MR Research Collaboration; Siemens Healthineers, Beijing, China, 5Department of Radiology,Obstetrics and Gynecology Hospital of Fudan University, Shanghai, China
Synopsis
Keywords: Uterus, Uterus, Radiogenomics
Motivation: To explore genetically based molecular profiling of endometrial cancer (EC) patients to delineate prognostic risk groups.
Goal(s): To demonstrate the potential of radiogenomics for classification of EC molecular subtypes, 254 EC patients with histologically and genetically proven EC from two-center were enrolled.
Approach: A radiomics model based on four sequences was combined with genomics features to form the final diagnosed model.
Results: Our results showed a medium-to-high diagnostic performance to distinguish molecular subtypes with AUC of 0.849 and 0.673 in internal and external test sets, respectively. The radiogenomics model could guide clinicians in administering individual treatments for EC patients.
Impact: Our results demonstrate that the predictive model derived from MRI imaging features holds significant promise in identifying molecular subtypes in endometrial cancer. This model has the potential to guide clinicians in tailoring individualized treatments for EC patients.
Introduction
Endometrial cancer (EC) is one of the most common types of cancer [1]. The transition from FIGO 2008 to FIGO 2023 introduces molecular classification, which included polymerase epsilon (POLE) mutation, loss of mismatch repair protein expression (MMR-D), no specific molecular profile (NSMP) and p53-abnormal (p53abn), for EC staging, aiding in prognostic risk assessment and treatment decisions [2-3]. However, limitations in economic capacity and testing technology hinder universal application. Radiogenomics, combining radiomics and genomic data, offers a noninvasive method to discern molecular characteristics [4]. This approach shows promise in characterizing tumors and genomics [5]. Our goal is to explore a novel radiogenomics approach to create a gene expression signature for EC patients from two institutions, aiming to improve prognostic and predictive information for patients.Methods
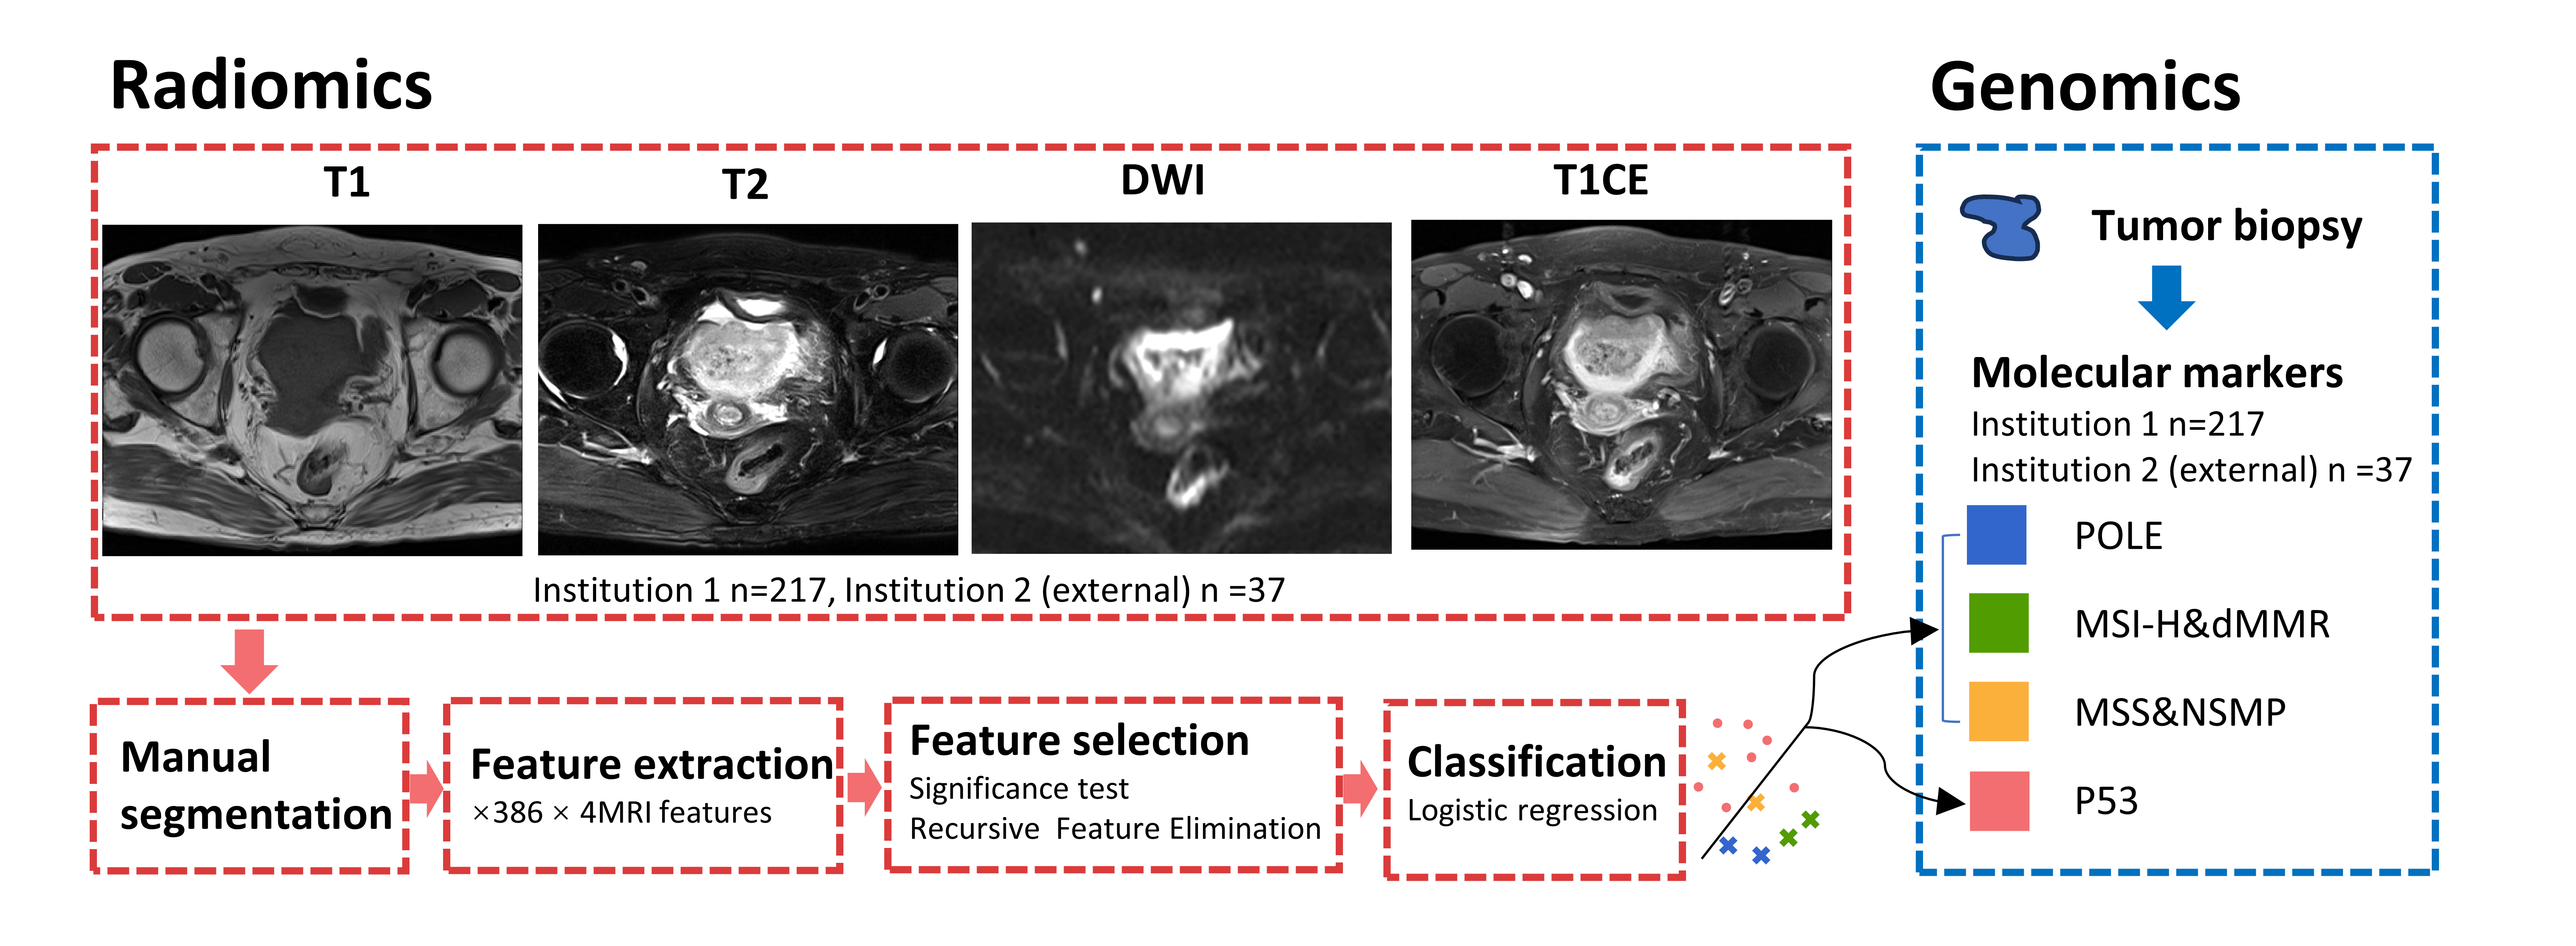
During the period between January 2020 and August 2022, data from 254 patients diagnosed with endometrial cancer (EC) were retrospectively analyzed after histological and genetic confirmation. These patients were recruited from two medical centers: 217 individuals from the Obstetrics and Gynecology Hospital of Fudan University (Institution 1) and 37 from the Beijing Chaoyang Hospital (Institution 2). Genomic DNA was meticulously examined using a specialized endometrial cancer molecular typing test kit, covering markers such as POLE, TP53, MSH2, PMS2, MLH1, and MSH6 for detailed subtyping. The MRI examinations were conducted utilizing either a 1.5T MR scanner (MAGNETOM Avanto, Siemens Healthcare, Erlangen, Germany) or a 3T MR scanner (MAGNETOM Prisma, Siemens Healthcare, Erlangen, Germany). DICOM files of T2WI, T1WI, DWI, and T1CE were processed using ITK-SNAP. A skilled radiologist with 25 years of experience delineated the tumor regions as the region of interest (ROI), subsequently reviewed by a senior radiologist with extensive experience in pelvic female tumors. Data from Institution 1 were divided into a 7:3 ratio, facilitating the training and internal test set, while Institution 2 data served as the external test set. The research protocol was shown in Figure 1. A radiomics model was constructed based on four sequences. From each sequence, we extracted 386 radiomics features from the ROI, including both original features and those derived from the Laplacian-of-Gaussian (LoG) filter by FAE (v.0.5.8) [6]. For the training data set, we firstly normalized each feature to remove the scale effect and then incorporated the Pearson correlation coefficient for dimension reduction, recursive feature elimination for feature selection, and a logistic regression to develop the classifier. This comprehensive approach yielded the most effective radiomics model based on a 5-fold cross-validation to determine the optimal features for the further analysis. Subsequently, the final radiomics-clinical model was developed, integrating clinical features (Onset Age, CA125, and FIGO stage) with the rad-score, calculated from the linear combination of selected features derived from the four sequences. Clinical and pathological characteristics were meticulously analyzed using SPSS.Results
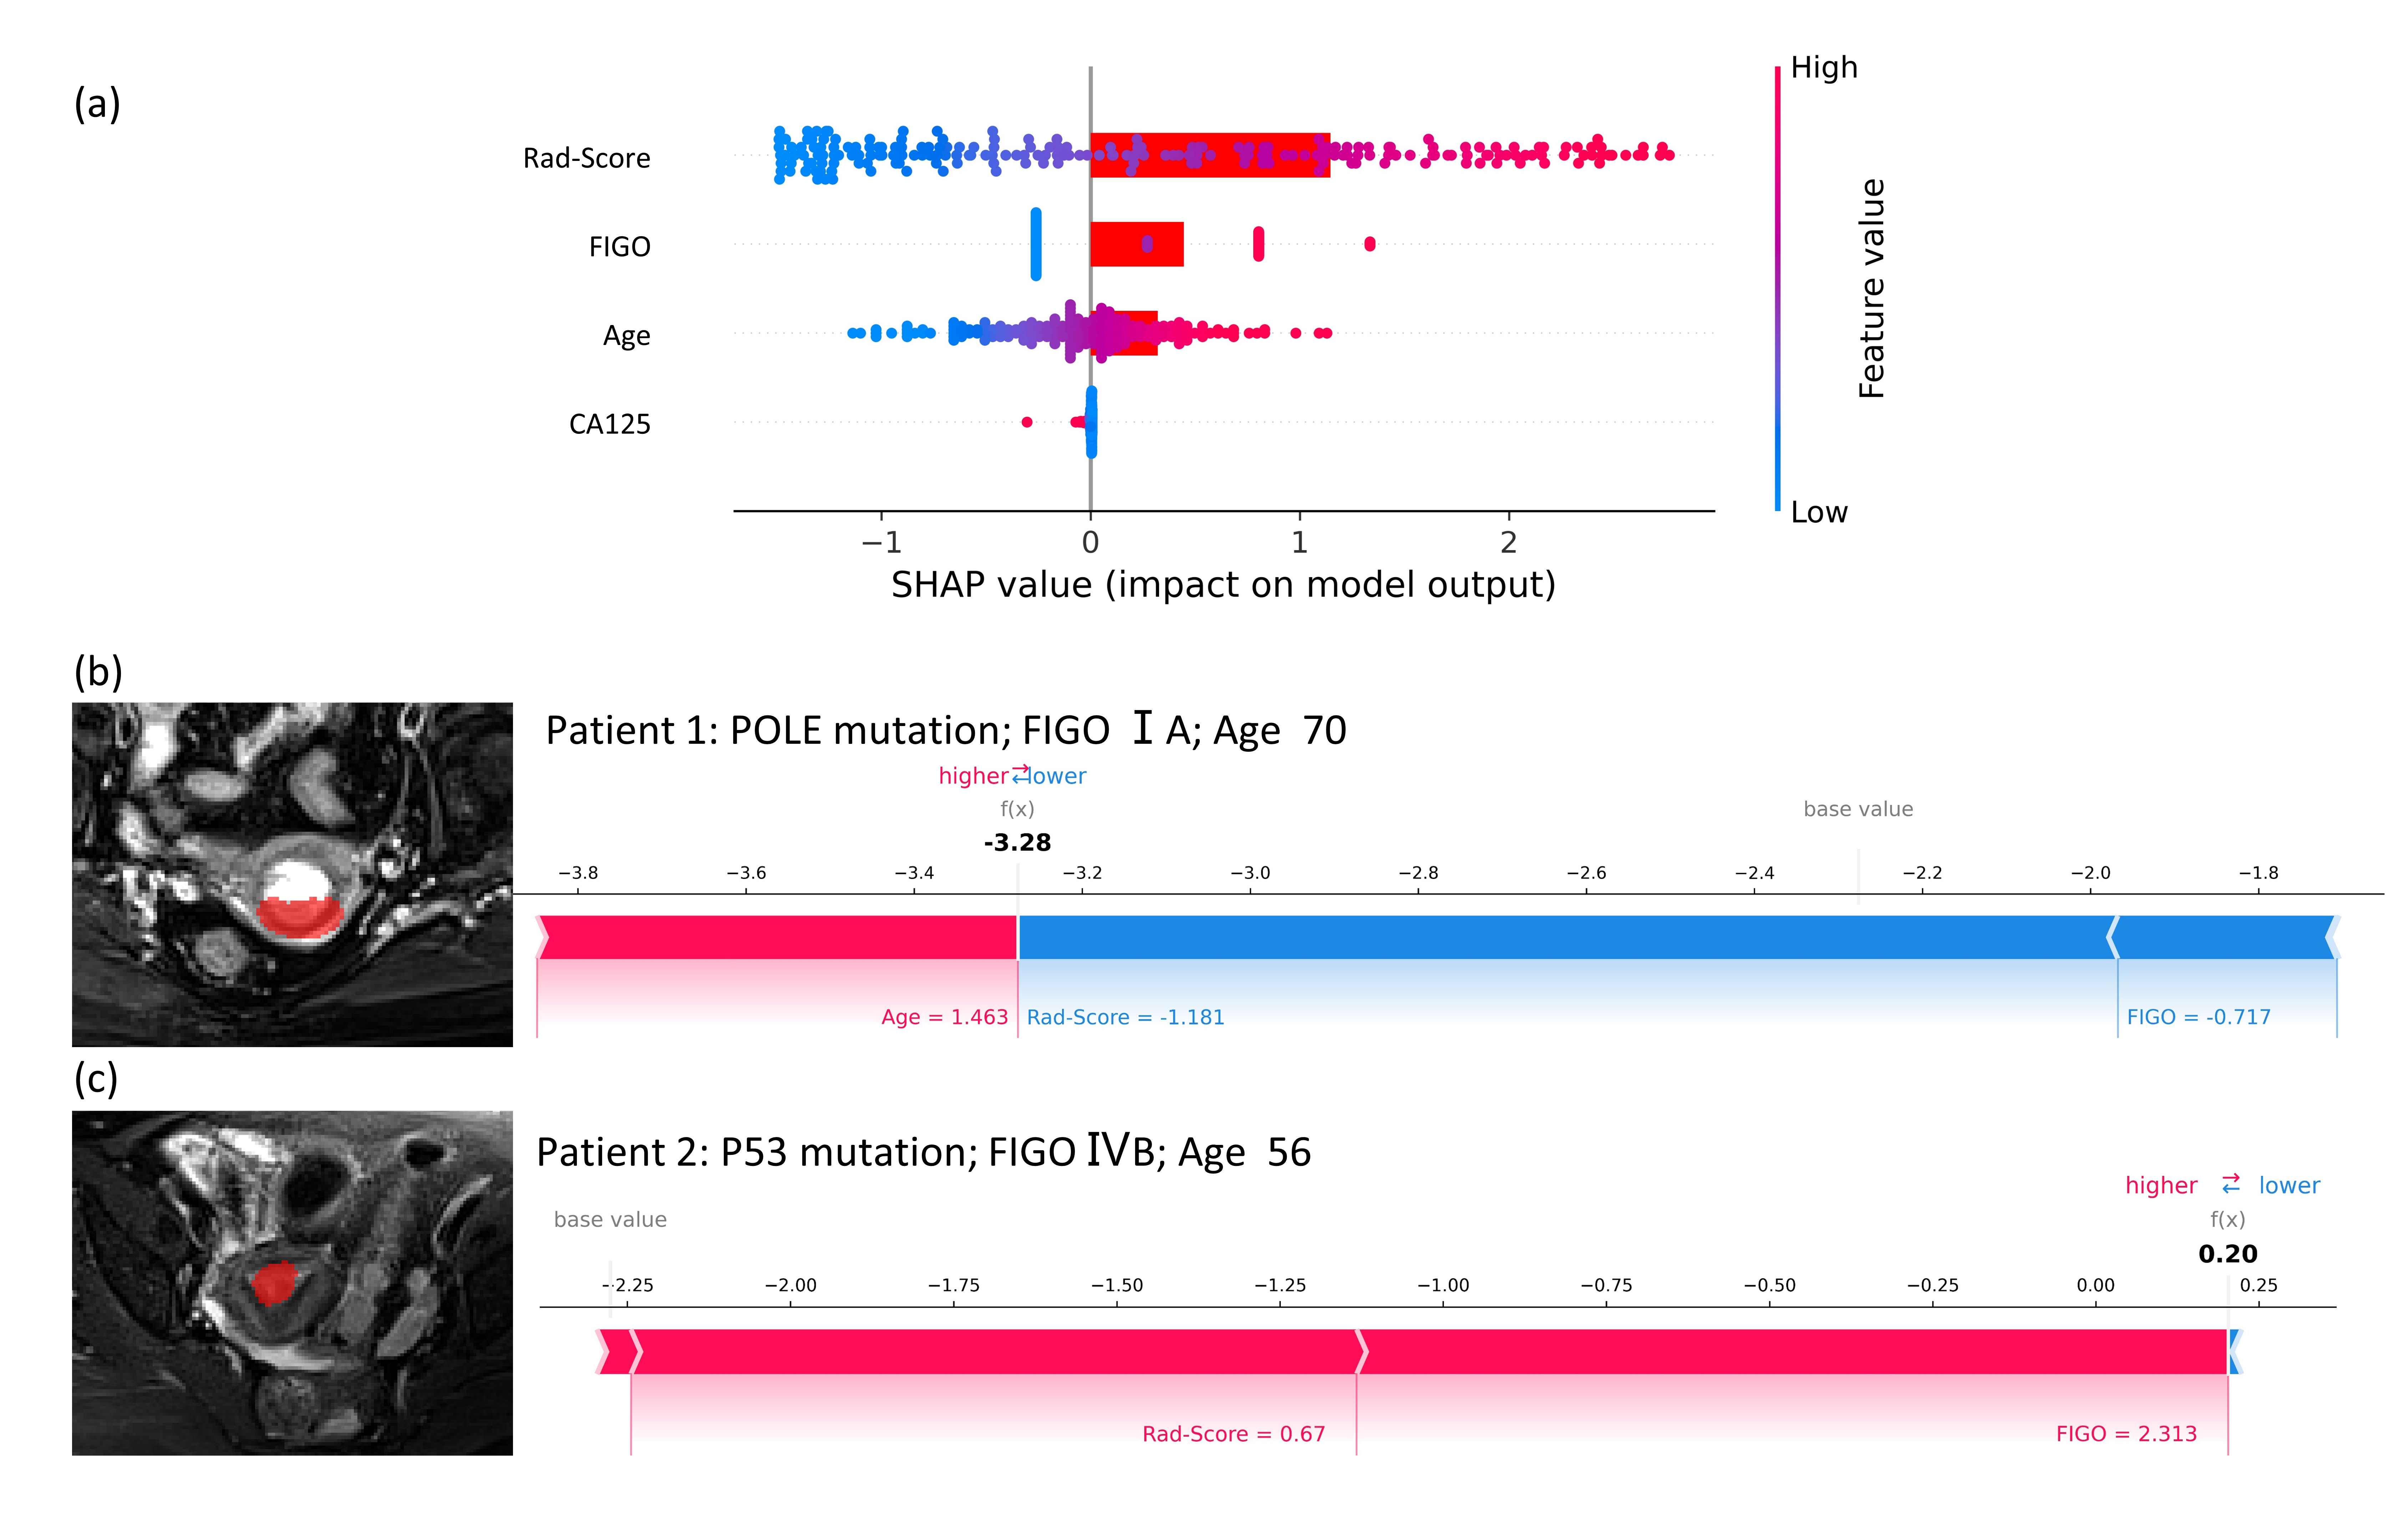
The clinical and pathological characteristics of the two institutions are summarized in the results section (Table 1). Institution 1 included 19 POLE-EDM, 86 MMR-D, 69 NSMP, and 43 p53abn patients, while Institution 2 had 1 POLE-EDM, 8 MMR-D, 21 NSMP, and 7 p53abn patients. The optimal radiomics model, consisting of 19 features selected from 4 sequences, demonstrated an AUC of 0.760 (95% CI: 0.626-0.884) and 0.652 (95% CI: 0.543-0.855) in the internal and external test sets,respectively. However, the AUC value of the final model improved by 0.849 (95% CI: 0.754-0.924) and 0.673 (95% CI: 0.582-0.764) in the internal and external test set (Table 2). Notably, SHAP (SHapley Additive exPlanations) showcased the significance of the Rad-score compared with clinical features (Figure 2).Discussion
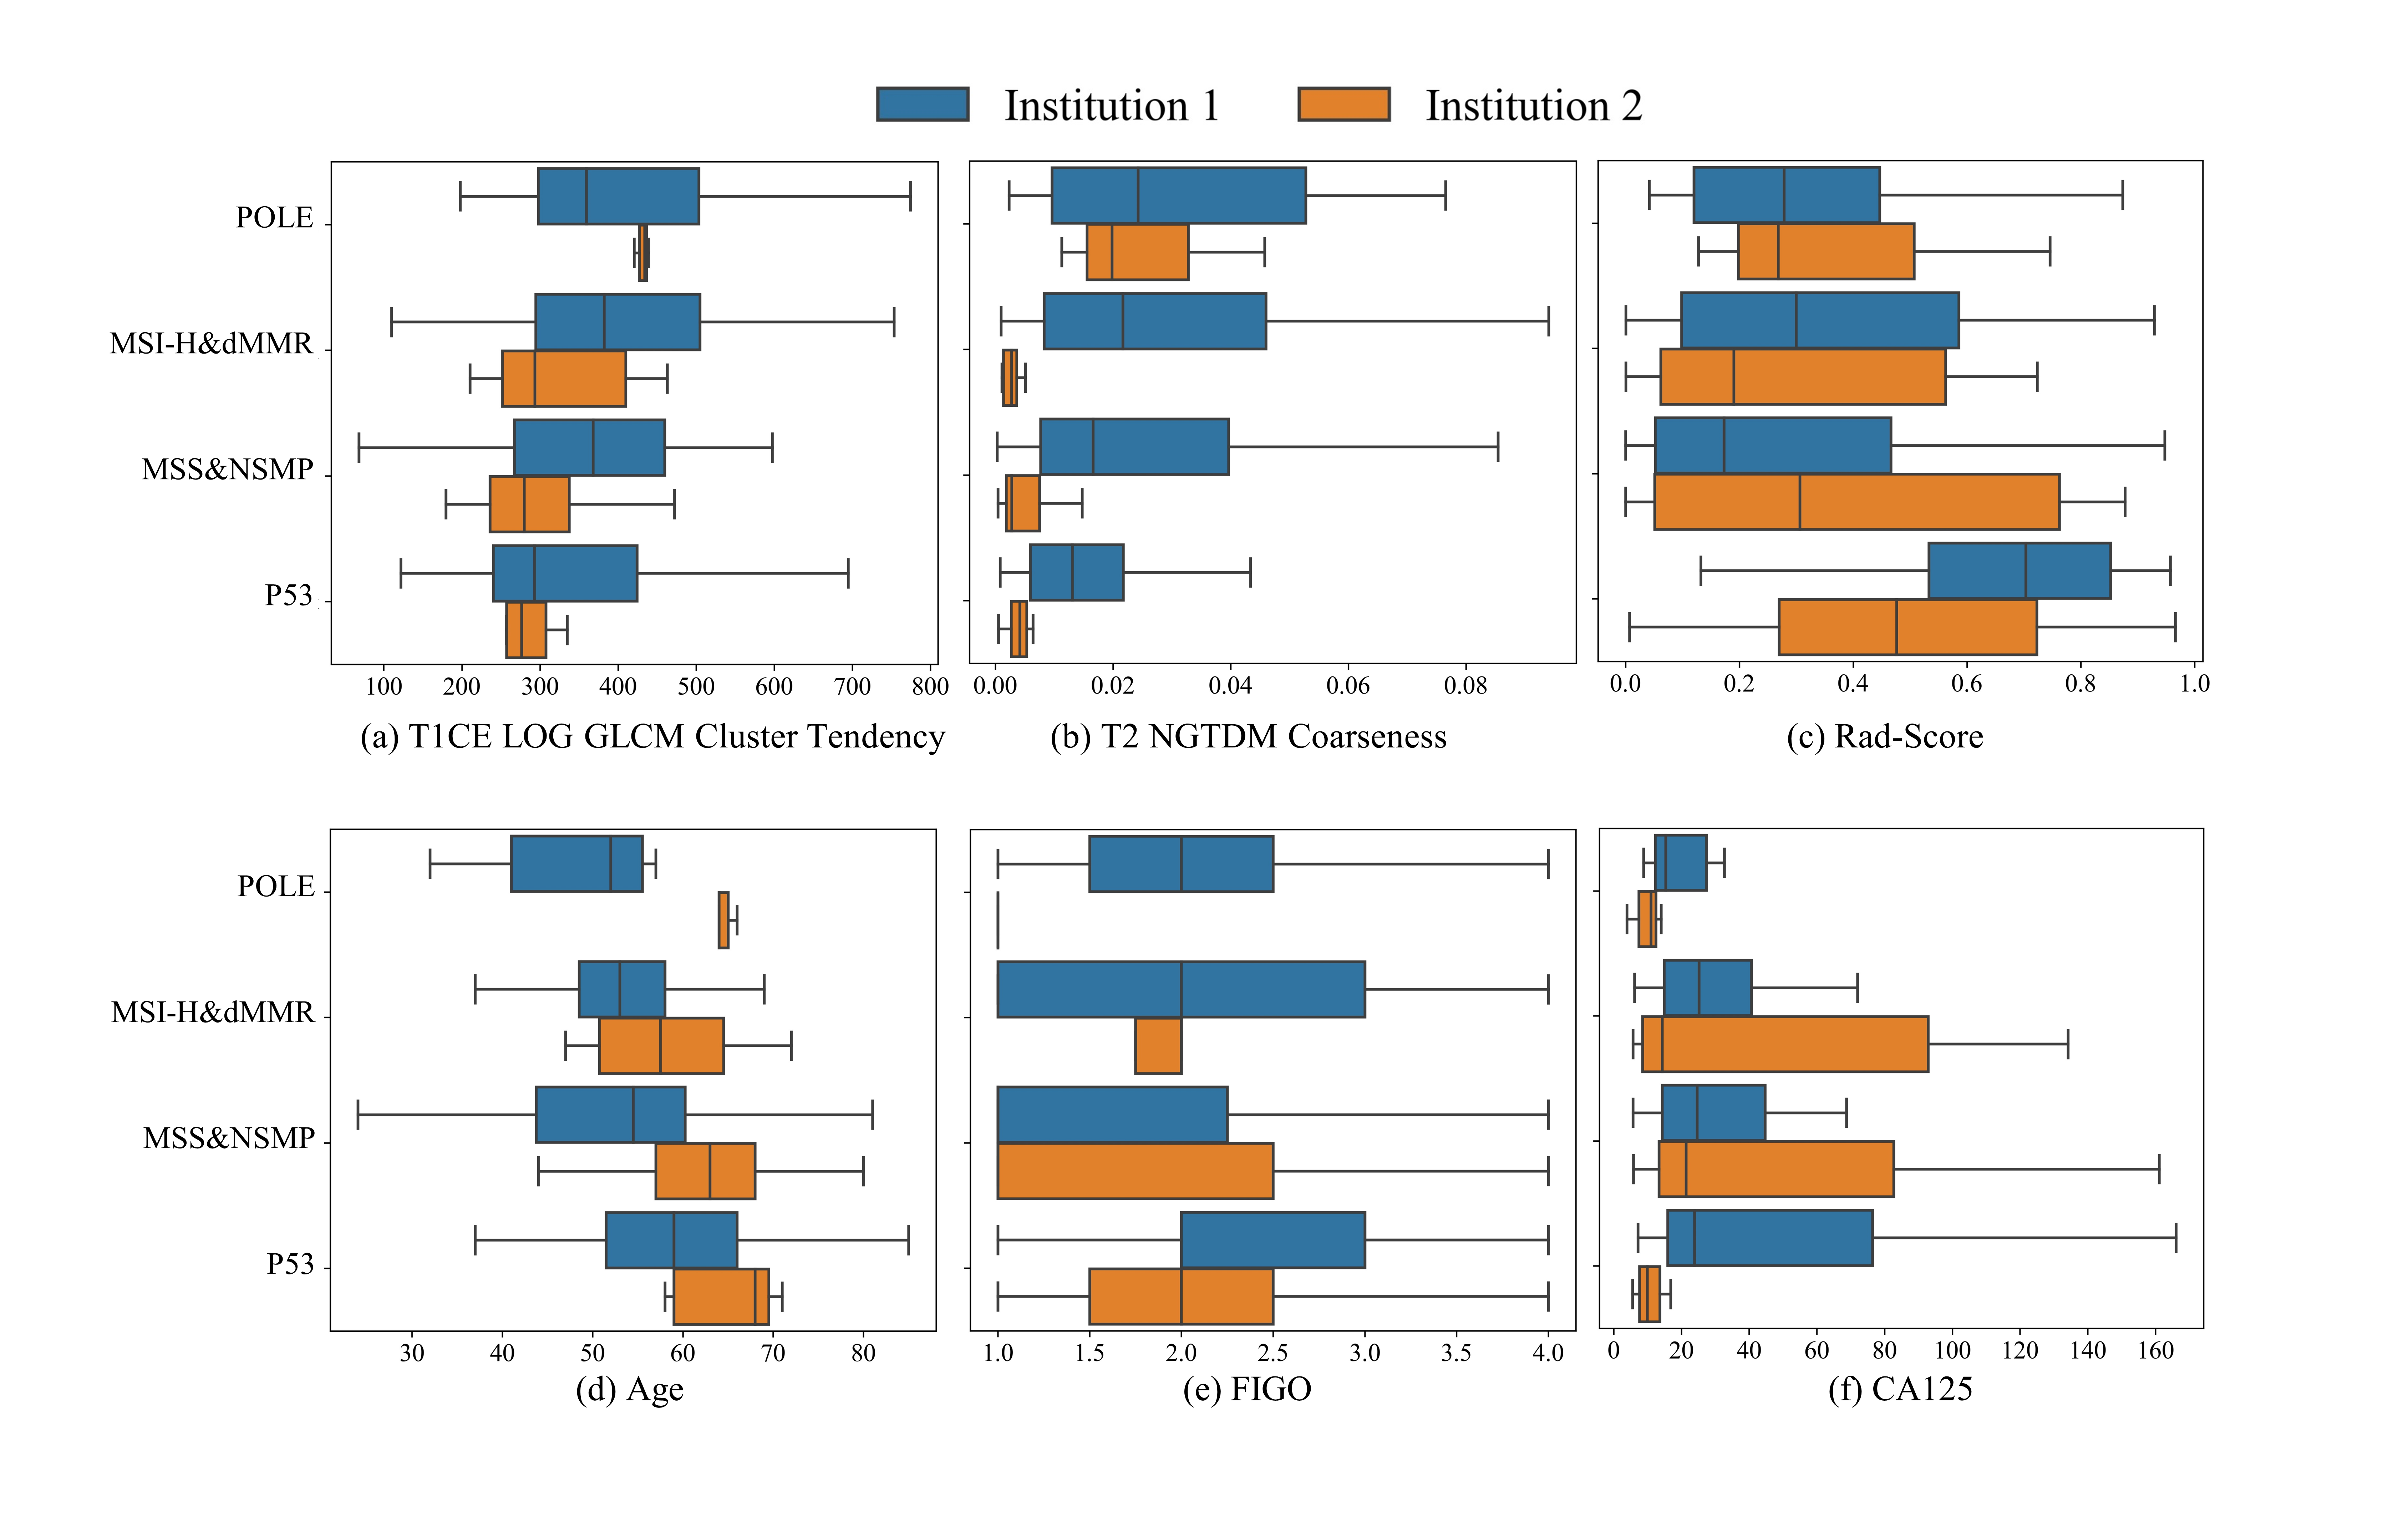
In our study, the radiogenomics-based analysis displayed the moderate-to-high diagnostic performance in distinguishing molecular subtypes of EC. This study demonstrated how the model supports the differentiation of molecular subtypes, in line with previous research [4], but our study adds external test, combining clinical and pathological information to give a richer model. Future studies in radiogenomics should focus on evaluating different imaging modalities to directly identify the molecular subtype spectrum of TCGA from radiomic data in larger populations. The limitation of the present study is the performance on the external test set was suboptimal. Figure 3 revealed variations in the distribution of imaging features and clinical characteristics between the two institutions, which may be due to sample size inadequacies and differences in MRI scanners. Generalizability can be enhanced in future studies with larger sample sizes and standardized methods.Conclusion
In conclusion, our results demonstrate that the predictive model derived from MRI imaging features holds significant promise in identifying molecular subtypes in EC. This model has the potential to guide clinicians in tailoring individualized treatments for EC patients.Acknowledgements
Wenyi Yue and Ruxue Han contributed equally to this work.References
[1] Lin Z, Wang T, Li Q, et al. Development and validation of MRI-based radiomics model to predict recurrence risk in patients with endometrial cancer: a multicenter study. Eur Radiol. 2023 Aug;33(8):5814-5824.
[2] Kobayashi-Kato M, Fujii E, Asami Y, et al. Utility of the revised FIGO2023 staging with molecular classification in endometrial cancer. Gynecol Oncol. 2023 Sep 23;178:36-43.
[3] Berek JS, Matias-Guiu X, Creutzberg C, et al. Endometrial Cancer Staging Subcommittee, FIGO Women's Cancer Committee. FIGO staging of endometrial cancer: 2023. Int J Gynaecol Obstet. 2023 Aug;162(2):383-394.
[4] Hoivik EA, Hodneland E, Dybvik JA, et al A radiogenomics application for prognostic profiling of endometrial cancer. Commun Biol. 2021 Dec 6;4(1):1363.
[5] Lee G, Lee HY, Ko ES, et al. Radiomics and imaging genomics in precision medicine[J]. Glioma Imaging, 2017, 1(1): 10-31.
[6] Song, Y. et al. FeAture Explorer (FAE): A tool for developing and comparing radiomics models. Plos One. 2020;15(8).
Figures