0180
APTw Combined with Multiple Models DWI of Endometrial Cancer: Correlations between Multimodal Parameters and HIF-1α Expression1Department of Radiology,, The First Affiliated Hospital of Dalian Medical University, Dalian, China, 2Department of Medicine, Dalian University of Technology, Dalian, China, 3Clinical and Technical Support,, Philips Healthcare, Beijing, China
Synopsis
Keywords: Pelvis, Pelvis
Motivation: Hypoxia inducible factor (HIF-1α) is a major transcriptional factor regulating gene expression under hypoxic conditions and could serve as an important biomarker for tumor aggressiveness or radiation resistance.
Goal(s): This study aimed to investigate whether the multimodal functional MRI technique can be used for quantitatively measuring HIF-1α expression.
Approach: APT, ADC, D, D*, f, MK, and MD values were calculated and compared between HIF-1α high expression and HIF-1α low expression groups.
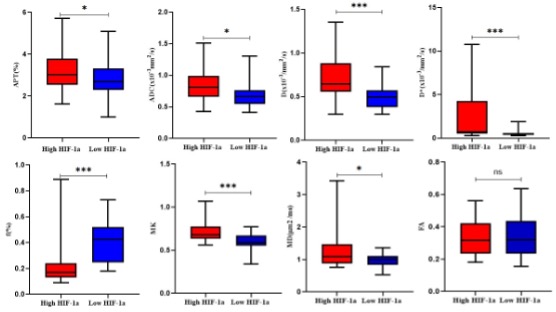
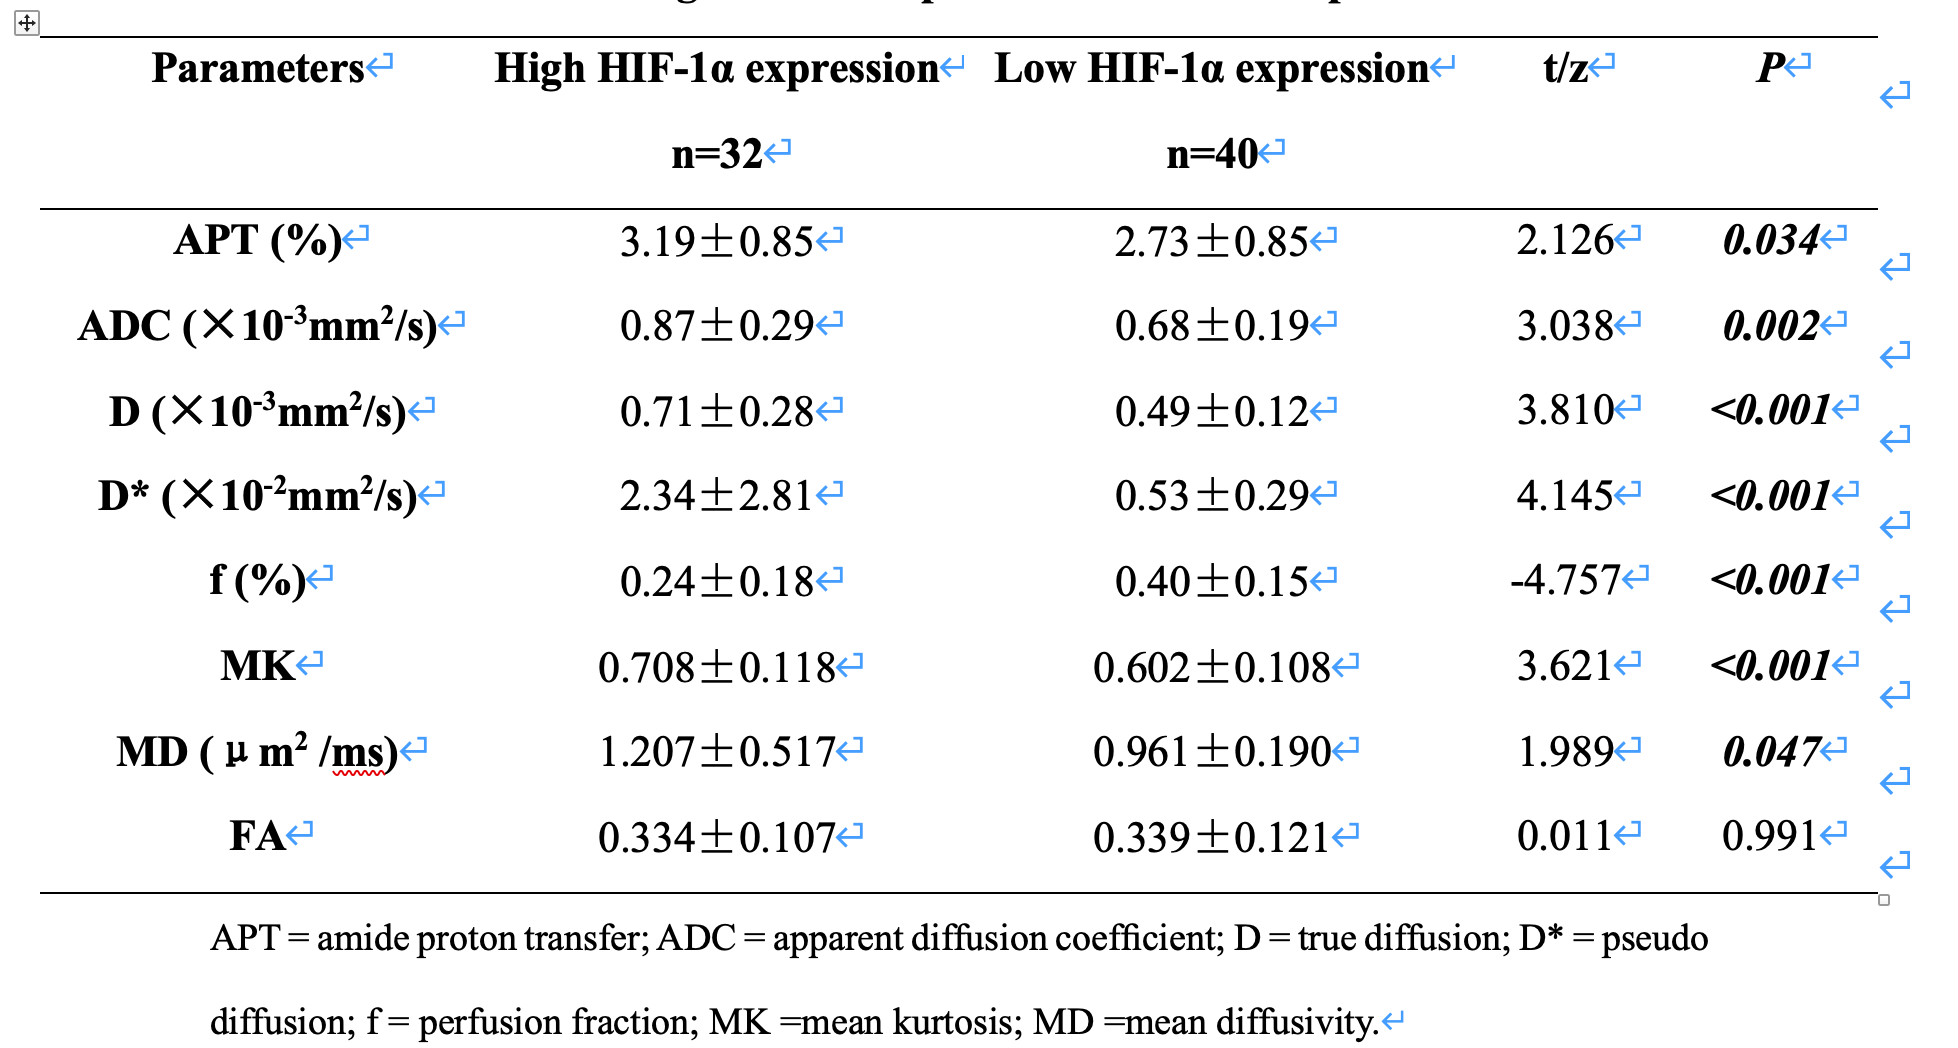
Results: APT, ADC, D, D*, MK and MD values were significantly higher in high HIF-1α expression than in low HIF-1α expression groups, whereas f value was significantly lower in high HIF-1α expression .
Impact: The quantitative parameters of APTw combined with multi-model diffusion-weighted sequences allowed quantitative assessment of EC HIF-1α expression, and the combined quantitative parameters further enhanced the assessment efficacy.
Introduction
Endometrial cancer (EC) is the second most common malignant tumour of the female reproductive system in China, and is the most common gynaecological tumour in developed countries, and its incidence continues to rise [1, 2, 3]. The treatment of EC is mainly surgical, and radiotherapy, chemotherapy and hormonal therapy are commonly used adjuvant treatment modalities. There are many factors affecting radiotherapy, such as cell growth and apoptosis, hypoxic microenvironment, angiogenesis, and temperature, among which hypoxia inducible factor-1α (HIF-1α) is directly related to hypoxic microenvironment [4]. Therefore, the present study combined amide proton transfer weighting (APTw), intravoxel incoherent motion (IVIM) and diffusion kurtosis imaging (DKI) to determine the relationship between tumour metabolism and blood flow perfusion to assess the expression status of EC HIF-1αMethods
Preoperative clinical and imaging data of 72 EC patients with HIF-1α expression findings on pelvic 3.0T MRI and pathologically confirmed were retrospectively analyzed. APT values, ADC values, D values, D* values, f values, MK values, MD values, and FA values of lesion sites were obtained from APTw, IVIM, and DKI sequences and the consistency of the measurement data of the three observers was evaluated by intragroup correlation coefficients (ICC). Statistical differences in the values of each parameter were evaluated by two independent samples t-test or Mann-Whitney U-test; independent predictors of high EC HIF-1α expression were predicted by binary logistic regression analyses; and statistically different parameters were evaluated using subject's work characteristic curves (ROCs) to assess the value of EC HIF-1α expression; the Delong test was used to compare the variability among the areas under the curve (AUC); the correlation between the APT value and the quantitative parameter of the multi-model dispersion-weighted sequences was assessed by the Pearson or Spearman correlation test.Results
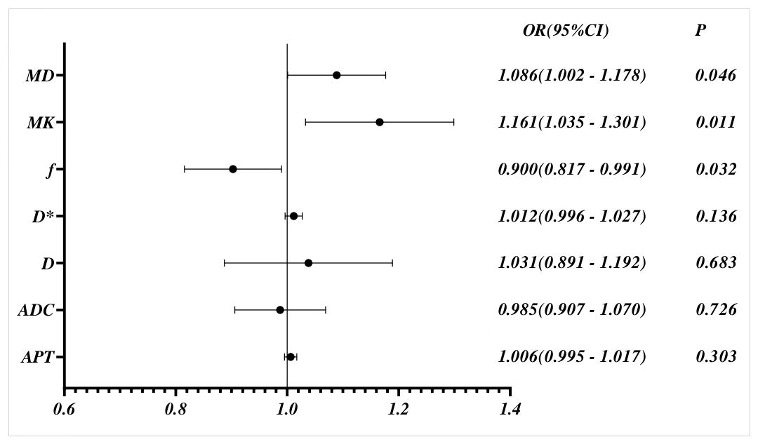
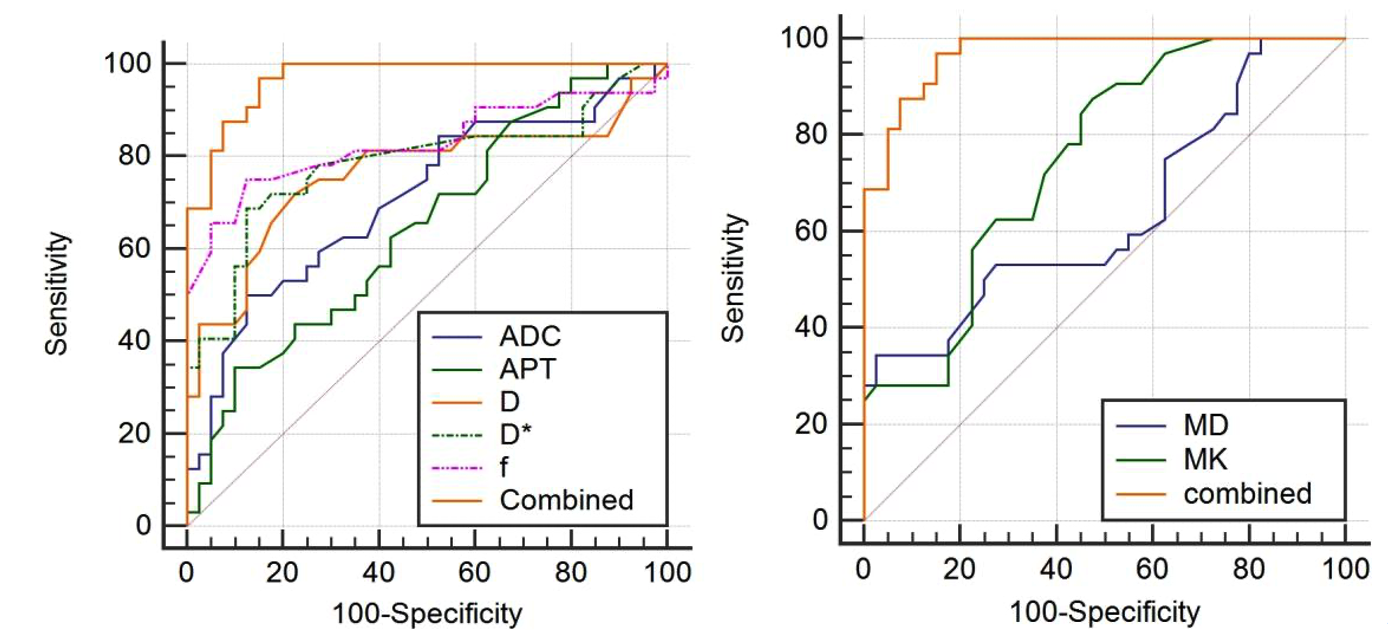
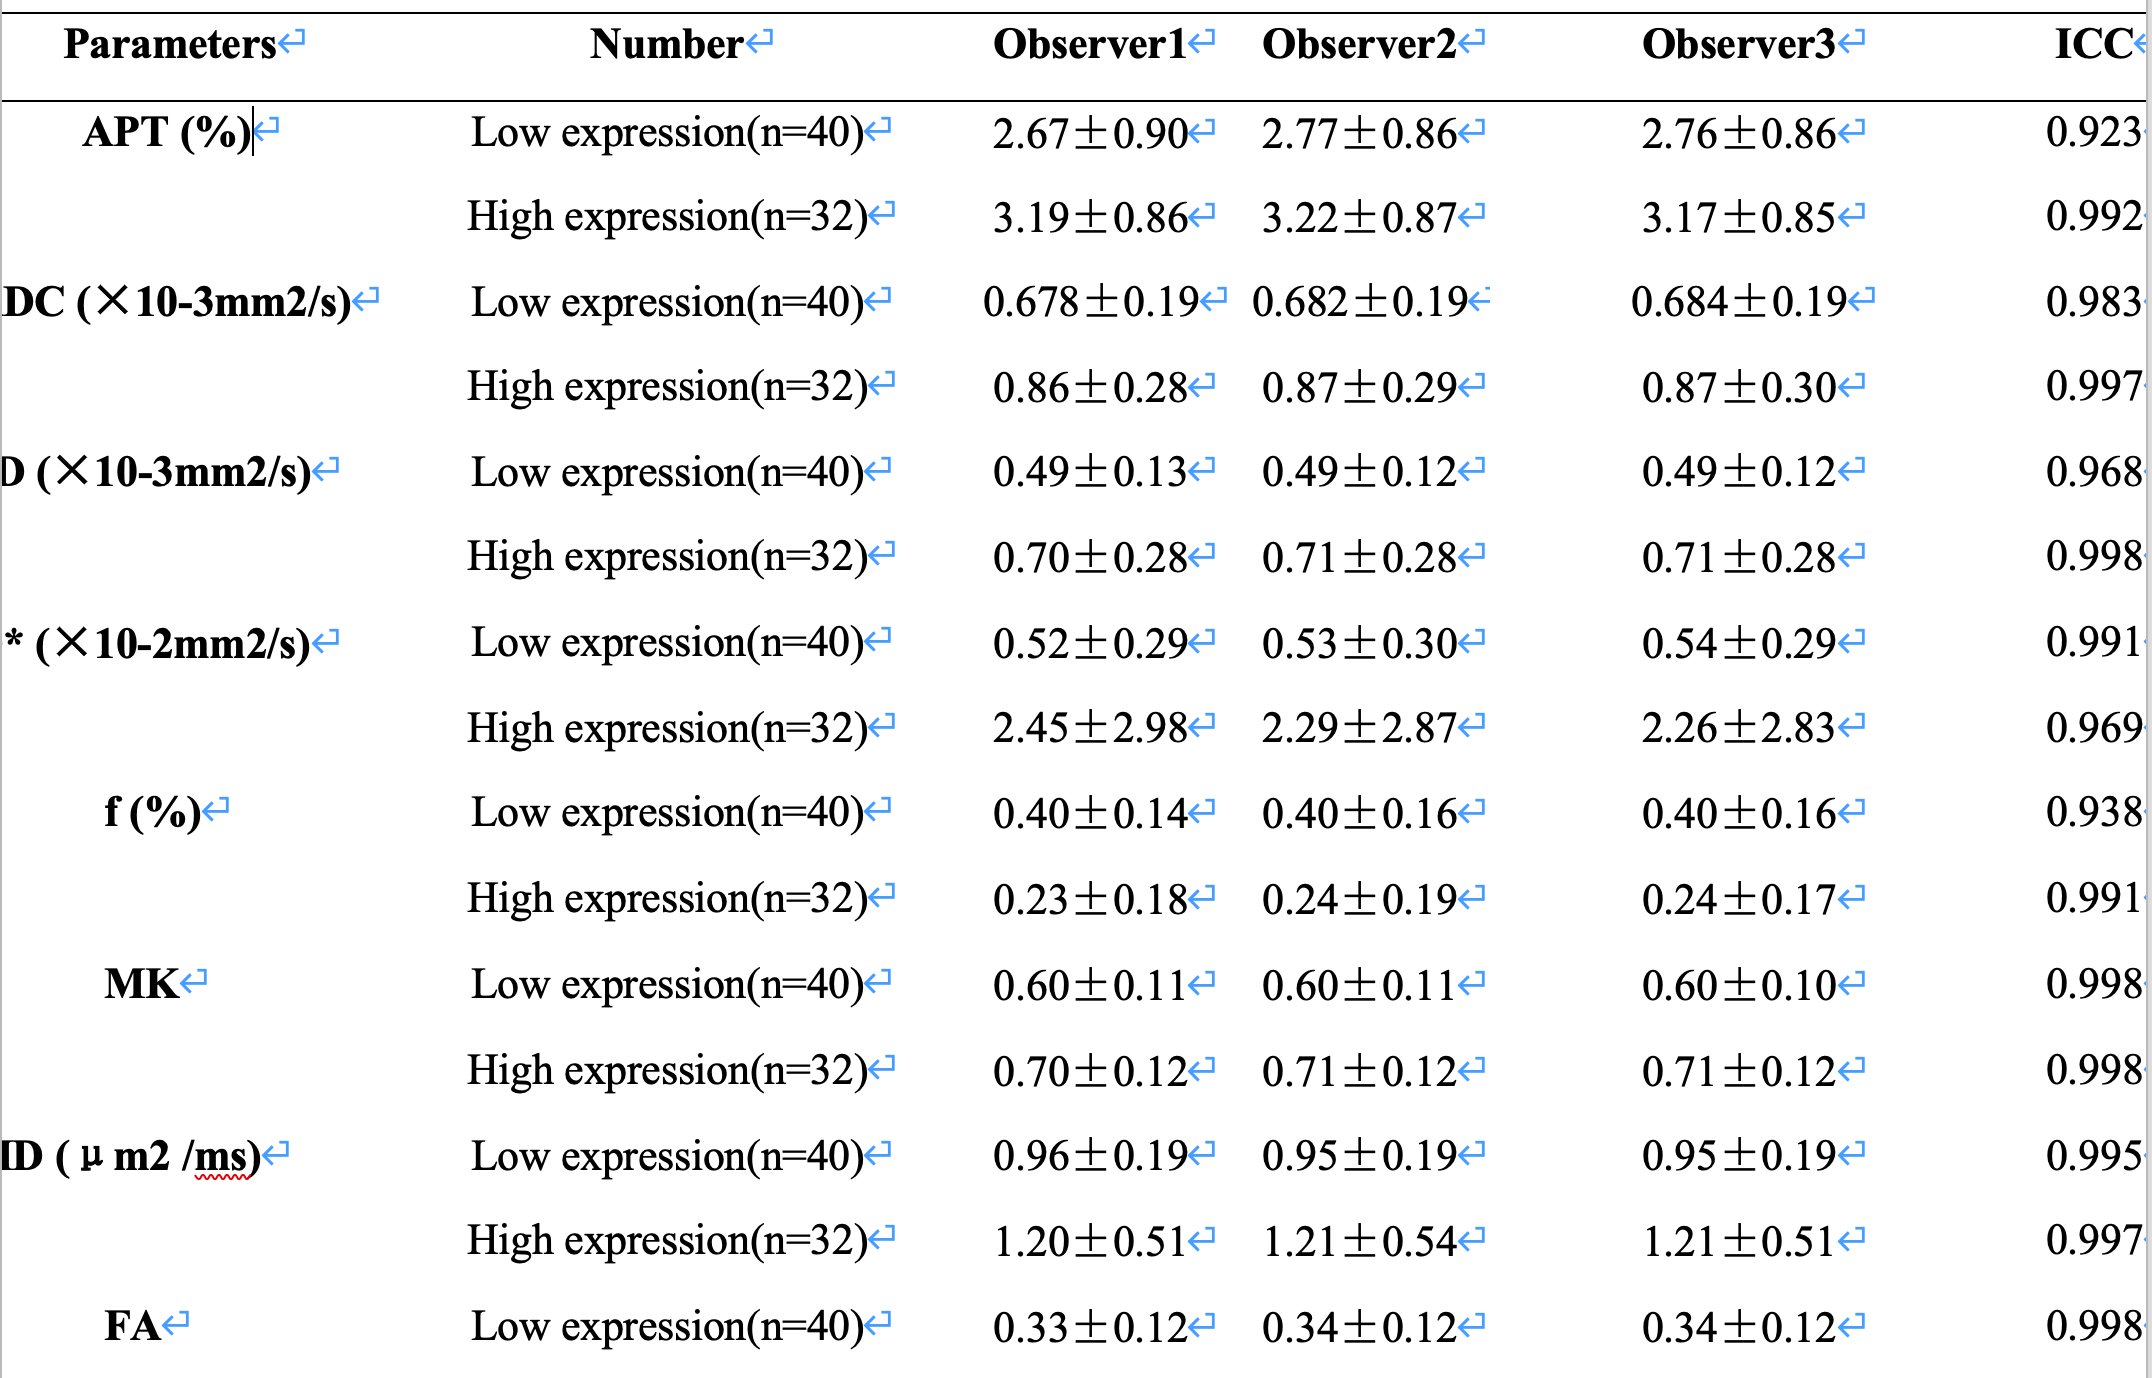
The three observers had high consistency on measurements of the APT, ADC, D, D*, f, MK, FA, and MD values (Table 1). APT, ADC, D, D*, MK and MD values were significantly higher in high HIF-1α expression than in low HIF-1α expression groups, whereas f value was significantly lower in high HIF-1α expression than in low HIF-1α expression groups (Table 2, Fig 1). The irregular vaginal bleeding, APTw and multi-model diffusion derived parameters were included in the regression analysis. Although univariate analysis showed that irregular vaginal bleeding, APT, ADC, D, D*, f, MK and MD were all favorable for evaluating HIF-1α expression in EC, multivariate analysis revealed that only f, MK, and MD were independent predictors for evaluating HIF-1α expression in EC (Fig 2). Spearman rank correlation analysis showed that there was an inverse correlation between f and HIF-1α expression level. There were positive correlation between the MK value, MD value and the HIF-1α expression level . APT, ADC, D, D*and f values had good specificity, while moderate sensitivity. Combination of the combined diagnosis had excellent sensitivity (96.90%) and specificity (85.00%). The ROC showed that the AUC was significantly improved in the combined image sets of APTw, DKI and IVIM compared with the APTw set , the IVIM setand the DKI set alone(Table 3, Fig 3).Discussion
In this study, the APT value of the HIF-1α high-expression group was greater than that of the low-expression group. The reason for this may be that the expression of HIF-1α regulates the local tumour metabolism and proliferation [5], and the increase in the number of cells in the local tumour and the exuberant metabolism make the tumour local proteins or peptides increase. ADC value, D value and MD value were higher than those of the low-expression group, which may be due to the fact that HIF-1α mediates the expression of hypoxia-related genes by modulating its upstream and downstream molecular signaling pathways [6] which ultimately leads to the occurrence of tumour hypoxia, resulting in hypoxic necrosis of tumour cells, lower cell density, wider interstitial space of tumour cells, freer diffusion of water molecules. In this study MK value was also higher in the HIF-1α high expression group than in the low expression group, which was related to the fact that the expression of HIF-1α could regulate the proliferation of tumour cells and epithelial-mesenchymal transition [5, 6], which resulted in exuberant proliferation of tumour cells in the local area, an increase in the epithelial-mesenchymal transition, and the local structure of the tumour becoming complex, and that the MK value was an independent predictor for the prediction of the high expression of EC HIF-1α.Conclusion
In summary, quantitative parameters based on APTw and multi-model diffusion-weighted sequences can be more effective in assessing EC HIF-1α expression, and have some clinical applications.Acknowledgements
NoReferences
[1] Ferlay J, Soerjomataram I, Dikshit R, et al. Cancer incidence and mortality worldwide: sources, methods and major patterns in GLOBOCAN 2012[J]. Int J Cancer 2015; 136: E359–86.
[2] Makker V, MacKay H, Ray-Coquard I, et al. Endometrial cancer. Nat Rev Dis Primers[J]. 2021;7(1):88.
[3] SIEGEL R L, MILLER K D, JEMAL A. Cancer statistics, 2017[J]. CA Cancer J Clin, 2017, 67: 7-30.[4] Ellingsen C, Andersen LM, Galappathi K, et al. Hypoxia biomarkers in squamous cell carcinoma of the uterine cervix[J]. BMC cancer 2015, 15:805.
[4] Bosco MC, D'Orazi G, Del Bufalo D. Targeting hypoxia in tumor: a new promising therapeutic strategy [J]. J Exp Clin Cancer Res. 2020; 39 (1): 8.
[5] Lee JW, Bae SH, Jeong JW, Kim SH, Kim KW. Hypoxia-inducible factor (HIF-1) alpha: its protein stability and biological functions[J]. Exp Mol Med. 2004; 36 (1):1-12.
Figures