0179
Evaluation of a cervical cancer-specific restriction spectrum imaging model on an independent pilot cohort using PET/MRI: pre- and post-therapy1Department of Radiology, University of California San Diego, La Jolla, CA, United States, 2Department of Surgical Sciences, Uppsala University, Uppsala, Sweden, 3Center for Medical Imaging, Uppsala University Hospital, Uppsala, Sweden, 4Department of Women's and Children's Health, Uppsala University, Uppsala, Sweden, 5GE Healthcare, Stockholm, Sweden, 6Global MR Application and Workflow, GE Healthcare, Boston, MA, United States, 7Department of Radiation Medicine, University of California San Diego, La Jolla, CA, United States, 8Department of Bioengineering, University of California San Diego, La Jolla, CA, United States, 9Department of Neuroscience, University of California San Diego, La Jolla, CA, United States, 10Department of Immunology, Genetics and Pathology, Uppsala University, Uppsala, Sweden, 11Department of Oncology, Uppsala University Hospital, Uppsala, Sweden
Synopsis
Keywords: Pelvis, Diffusion/other diffusion imaging techniques, restriction spectrum imaging, cervical cancer
Motivation: Restriction spectrum imaging (RSI) can potentially improve cervical cancer evaluation pre- and post-therapy, particularly in separating persistent malignancy from post-treatment edema.
Goal(s): To evaluate a cervical cancer-specific RSI model for assessment on an independent pilot cohort examined with combined PET/MRI.
Approach: Four patients underwent PET/MRI before (chemo)radiotherapy. Two of them also underwent PET/MRI within 4 weeks of treatment, MRI 3 months post-treatment and PET/MRI 6 months post-treatment. Two healthy volunteers underwent MRI only.
Results: Preliminary results showed increased tumor conspicuity on RSI compared to conventional pre-therapy PET/MRI and promising results early post-therapy.
Impact: Cervical cancer-specific restriction spectrum imaging (RSI), evaluated on an independent pilot cohort, indicates increased tumor conspicuity compared to conventional pre-therapy PET/MRI and promising results post-therapy. Future work will target early therapy response assessment in combined RSI-PET/MRI at a larger scale.
Introduction
Advanced cervical cancer is typically treated with (chemo)radiotherapy1. Diagnostics and surveillance include whole-body [18F]fluorodeoxyglucose-(FDG)-PET/CT and pelvic MRI for metabolic and morphologic assessment, respectively, with emphasis on late surveillance FDG-PET for identification of residual avid tumor. (Chemo)radiotherapy can induce post-treatment edema, leading to false positive imaging findings. To allow for acute inflammation to subside, surveillance is conducted at earliest 3 months post-therapy2. Techniques insensitive to post-treatment edema could allow for earlier surveillance with timely identification of poor-responders. Restriction spectrum imaging (RSI) enables separation of persistent malignancy from post-treatment edema, by compartmentalizing the diffusion signal into distinct water pools using a tissue-specific model. RSI has demonstrated clinical value in brain, prostate and breast3-5, and promising preliminary results in cervical cancer6.Aim
To evaluate a cervical cancer-specific RSI model for assessment on an independent cohort, using combined PET/MRI data.Methods
Four patients with primary cervical cancer (stage>IB2) underwent simultaneous FDG-PET/MRI (3T Signa PET/MR, GE Healthcare, Waukescha, USA) before (chemo)radiotherapy. Two of them additionally underwent surveillance with PET/MRI early (≈4 weeks) post-therapy, MRI 3 months post-therapy and PET/MRI 6 months post-therapy. Whole-body PET/MRI included routine static PET simultaneously with Dixon-MRI. Subsequently, pelvic MRI with conventional (clinical) and research sequences (e.g., multi-shell DWI for RSI) was conducted (scan parameters for relevant pelvic sequences in Table 1). Two healthy volunteers underwent pelvic MRI only. Matlab (R2020a) was used to fit the RSI model, updated from a preliminary version7, to the multi-shell DWI for estimation of the water pool signal contributions (C1–C4):$$
S_{diff}(b)=\sum_{i=1}^{4} C_{i}\cdot e^{-b D_{i}}
$$
ADCs were fixed in each compartment: D1=0, D2=0.0012, D3=0.0035, D4=0.5485 mm2/s. C1 typically represents restricted diffusion, pronounced in malignancy. C2 corresponds to hindered and restricted/hindered diffusion. C3–C4 represent even faster components (i.e., free diffusion, flow). The PET-derived standardized uptake value (SUV) maps were used for comparison of tumor conspicuity with RSI. Conspicuity was approximated by tumor contrast:8
$$
contrast = \frac{S_{T}-S_{REF}}{\mid S_{T} \mid+\mid S_{REF} \mid}
$$
The $$$S_{T}$$$ and $$$S_{REF}$$$ correspond to mean signal intensity within a single-slice region-of-interest in tumor and myometrium (reference tissue due to lack of healthy cervix in patients), respectively. Representative slices of PET and MRI were chosen. Differences were evaluated using Student’s t-test with Bonferroni correction (Matlab R2022b). As benchmark, the contrast between healthy cervix and myometrium was assessed for the volunteers. The radiologist surveillance report specified metabolic and morphologic tumor regression based on PET and conventional MRI, respectively. Inconclusive findings from conventional PET/MRI at 6-months surveillance were supplemented by histological examination from post-treatment incisional biopsy.
Results
Pre-treatment: Tumor, but not healthy cervix, was enhanced in the C1, C2 and C1C2 maps (Fig. 1). C2 also demonstrated pronounced signal in certain surrounding tissues (e.g., the intestines). C3–C4 maps showed low tumor signal and were therefore omitted in subsequent analysis. C1 and C1C2 demonstrated superior tumor conspicuity to SUV in the quantitative analysis (Fig. 2). The visual correspondence between SUV and RSI is shown in Fig. 3.Post-treatment: Pre- and post-therapy images of Patient I–II are shown in Fig. 4 alongside the radiologist report.
Patient I: Early and 3-months surveillance showed no residual tumor on conventional MRI and the C1 and C1C2 maps, but persistent C2 signal and partial metabolic regression on PET. At 6 months, inconsistent metabolic and morphologic findings were determined as post-treatment reaction by histological analysis. The C1, C2 and C1C2 maps showed local cervical signal.
Patient II: Early and 3-months surveillance showed partial metabolic and complete morphologic regression, whereas no RSI signal on C1 and C1C2. At 6 months, MRI demonstrated complete imaging response concordant with complete metabolic regression assessed by PET.
Discussion and Conclusion
This pilot study shows the potential of RSI for evaluation of cervical cancer. Preliminary results indicated improved pre-therapy tumor conspicuity using the C1 and C1C2 maps, compared to conventional PET/MRI. At post-treatment surveillance, the C1 and C1C2 maps agreed with conventional PET/MRI for the patient demonstrating complete metabolic and morphologic tumor regression at 6 months. Additionally, they showed no signs of tumor early post-therapy despite residual signal on PET. The patient with complete morphologic regression but suspicious metabolism at 6-months surveillance (assessed as post-treatment reaction) also showed signal on RSI. This might either reflect residual minimal malignancy or be artifact-related, which warrants further investigation. Limitations of this study include the simplified statistics for assessing tumor conspicuity based on minimal data. Future work will focus on larger-scale evaluation of RSI in differentiating malignancy from post-treatment reactions early after (chemo)radiotherapy. The potential synergistic value of RSI and PET in combined PET/MRI, with respect to locoregional, lymph node and metastatic assessment, will also be investigated.Acknowledgements
This study was supported by the Swedish Research Council (dnr 2021-00427), NIH R37CA249659, Lions Cancer Fund Mellansverige Uppsala-Örebro, Makarna Eriksson Foundation and a research grant from GE Healthcare.References
1. Bhatla N, Aoki D, Sharma DN, Sankaranarayanan R. Cancer of the cervix uteri: 2021 update. Int J Gynaecol Obstet 2021;155 Suppl 1(Suppl 1):28-44.
2. Schwarz JK, Siegel BA, Dehdashti F, Grigsby PW. Association of posttherapy positron emission tomography with tumor response and survival in cervical carcinoma. JAMA 2007;298(19):2289-2295.
3. White NS, McDonald CR, Farid N, Kuperman JM, Kesari S, Dale AM. Improved conspicuity and delineation of high-grade primary and metastatic brain tumors using "restriction spectrum imaging": quantitative comparison with high B-value DWI and ADC. AJNR Am J Neuroradiol 2013;34(5):958-964, S951.
4. Rakow-Penner RA, White NS, Parsons JK, et al. Novel technique for characterizing prostate cancer utilizing MRI restriction spectrum imaging: proof of principle and initial clinical experience with extraprostatic extension. Prostate Cancer Prostatic Dis 2015;18(1):81-85.
5. Rodriguez-Soto AE, Andreassen MMS, Fang LK, et al. Characterization of the diffusion signal of breast tissues using multi-exponential models. Magnetic resonance in medicine : official journal of the Society of Magnetic Resonance in Medicine / Society of Magnetic Resonance in Medicine 2022;87(4):1938-1951.
6. Yamin G, Zakeri K, Schenker-Ahmed NM, White NS. Cervical cancer staging and surveillance using Restriction Spectrum Imaging (RSI)-MRI in comparison to PET-CT: Pilot Clinical Application. Proceedings of the International Society for Magnetic Resonance in Medicine 26th Annual Meeting; 2018.
7. Rodríguez-Soto AE, Lundström E, Besser A, et al. Multi-exponential model of diffusion signal with fixed ADCs in healthy and cancerous cervix tissues. Proceedings of the International Society for Magnetic Resonance in Medicine 31st Annual Meeting; 2023.
8. McRobbie DW, Moore EA, Graves MJ, Prince MR. MRI From Picture to Proton: Cambridge University Press: 2006.
Figures
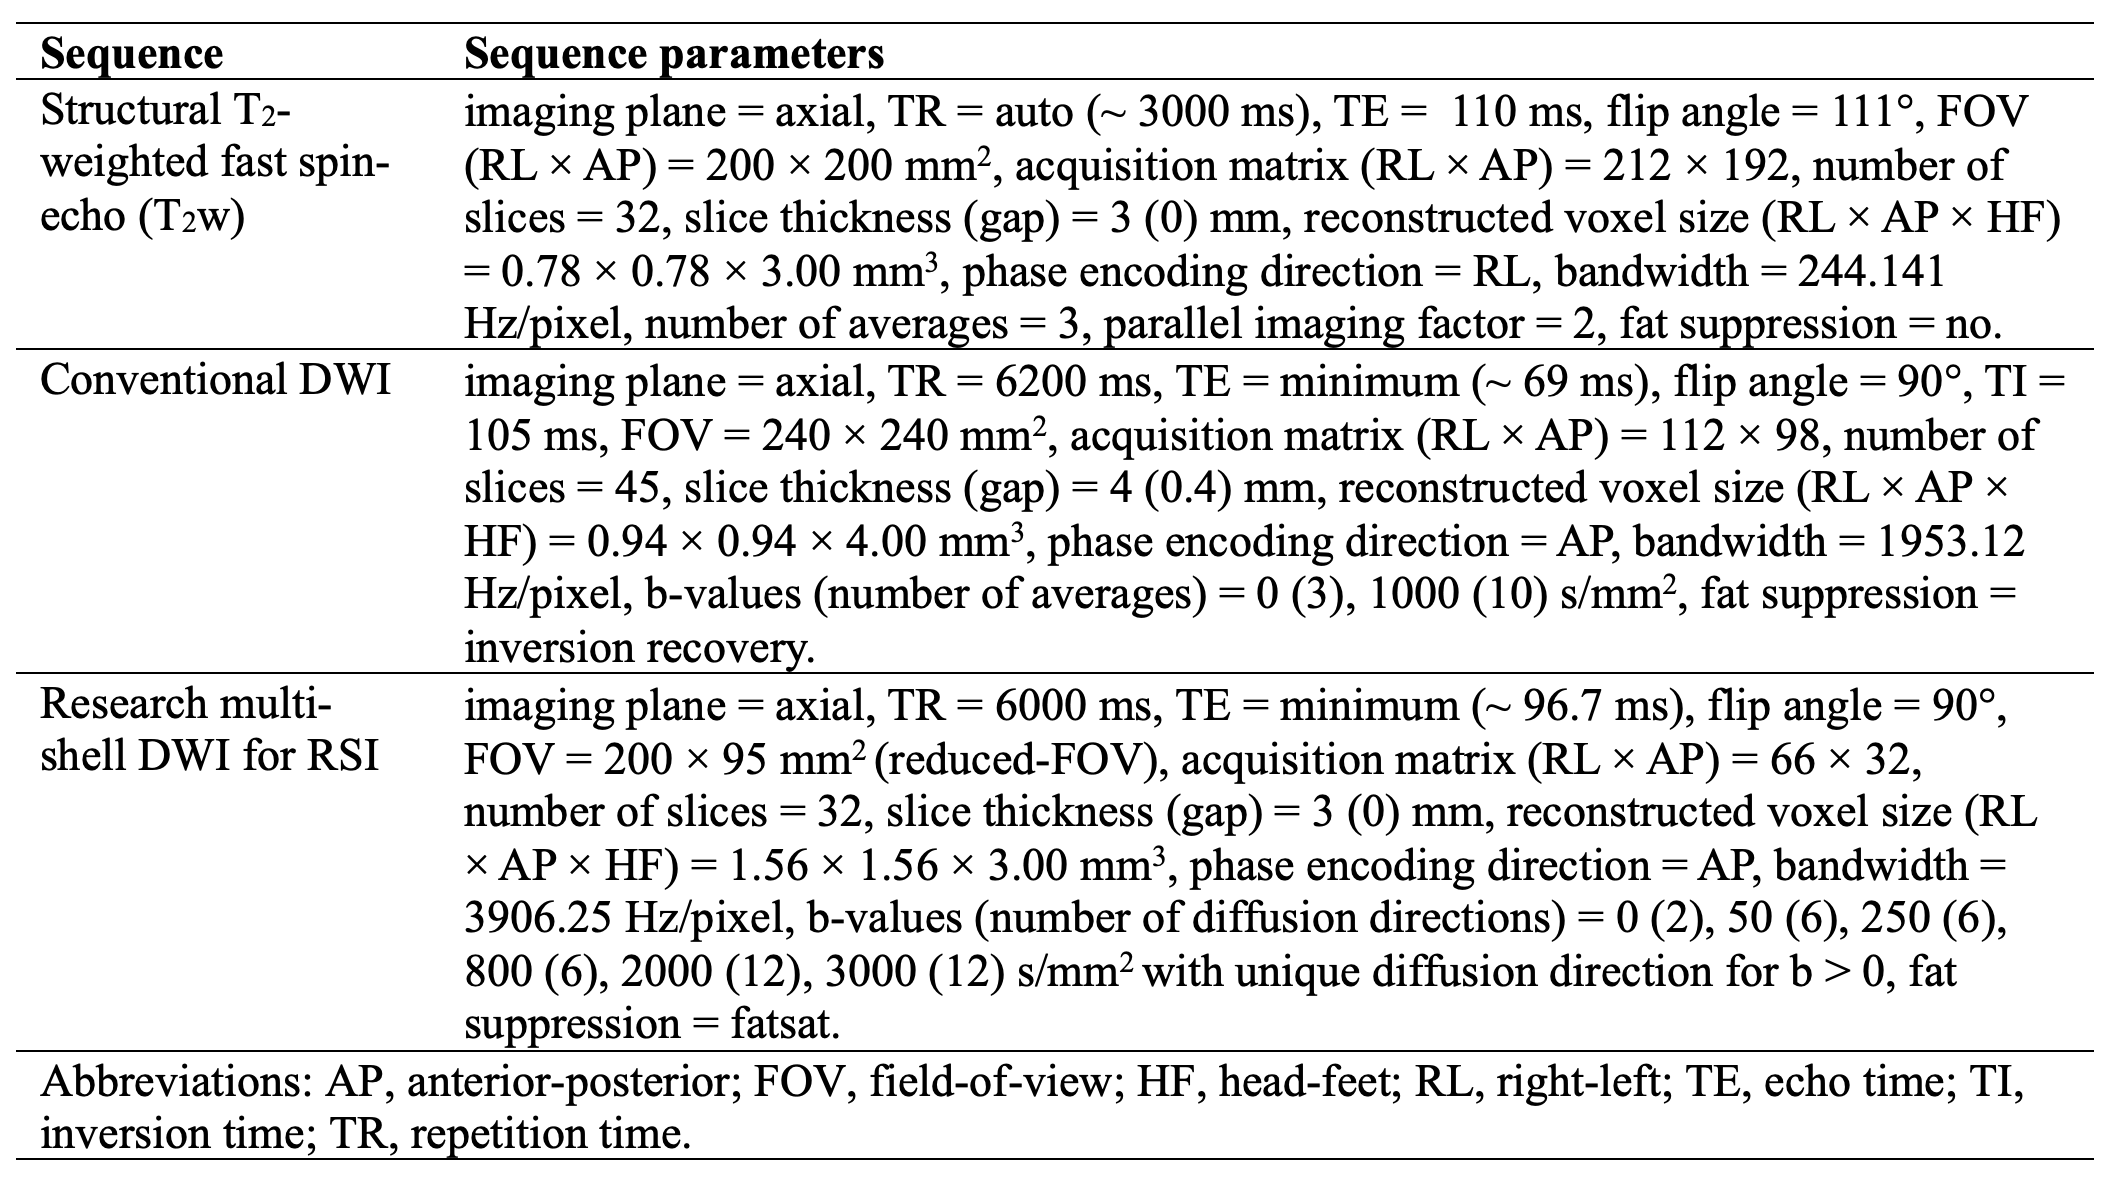
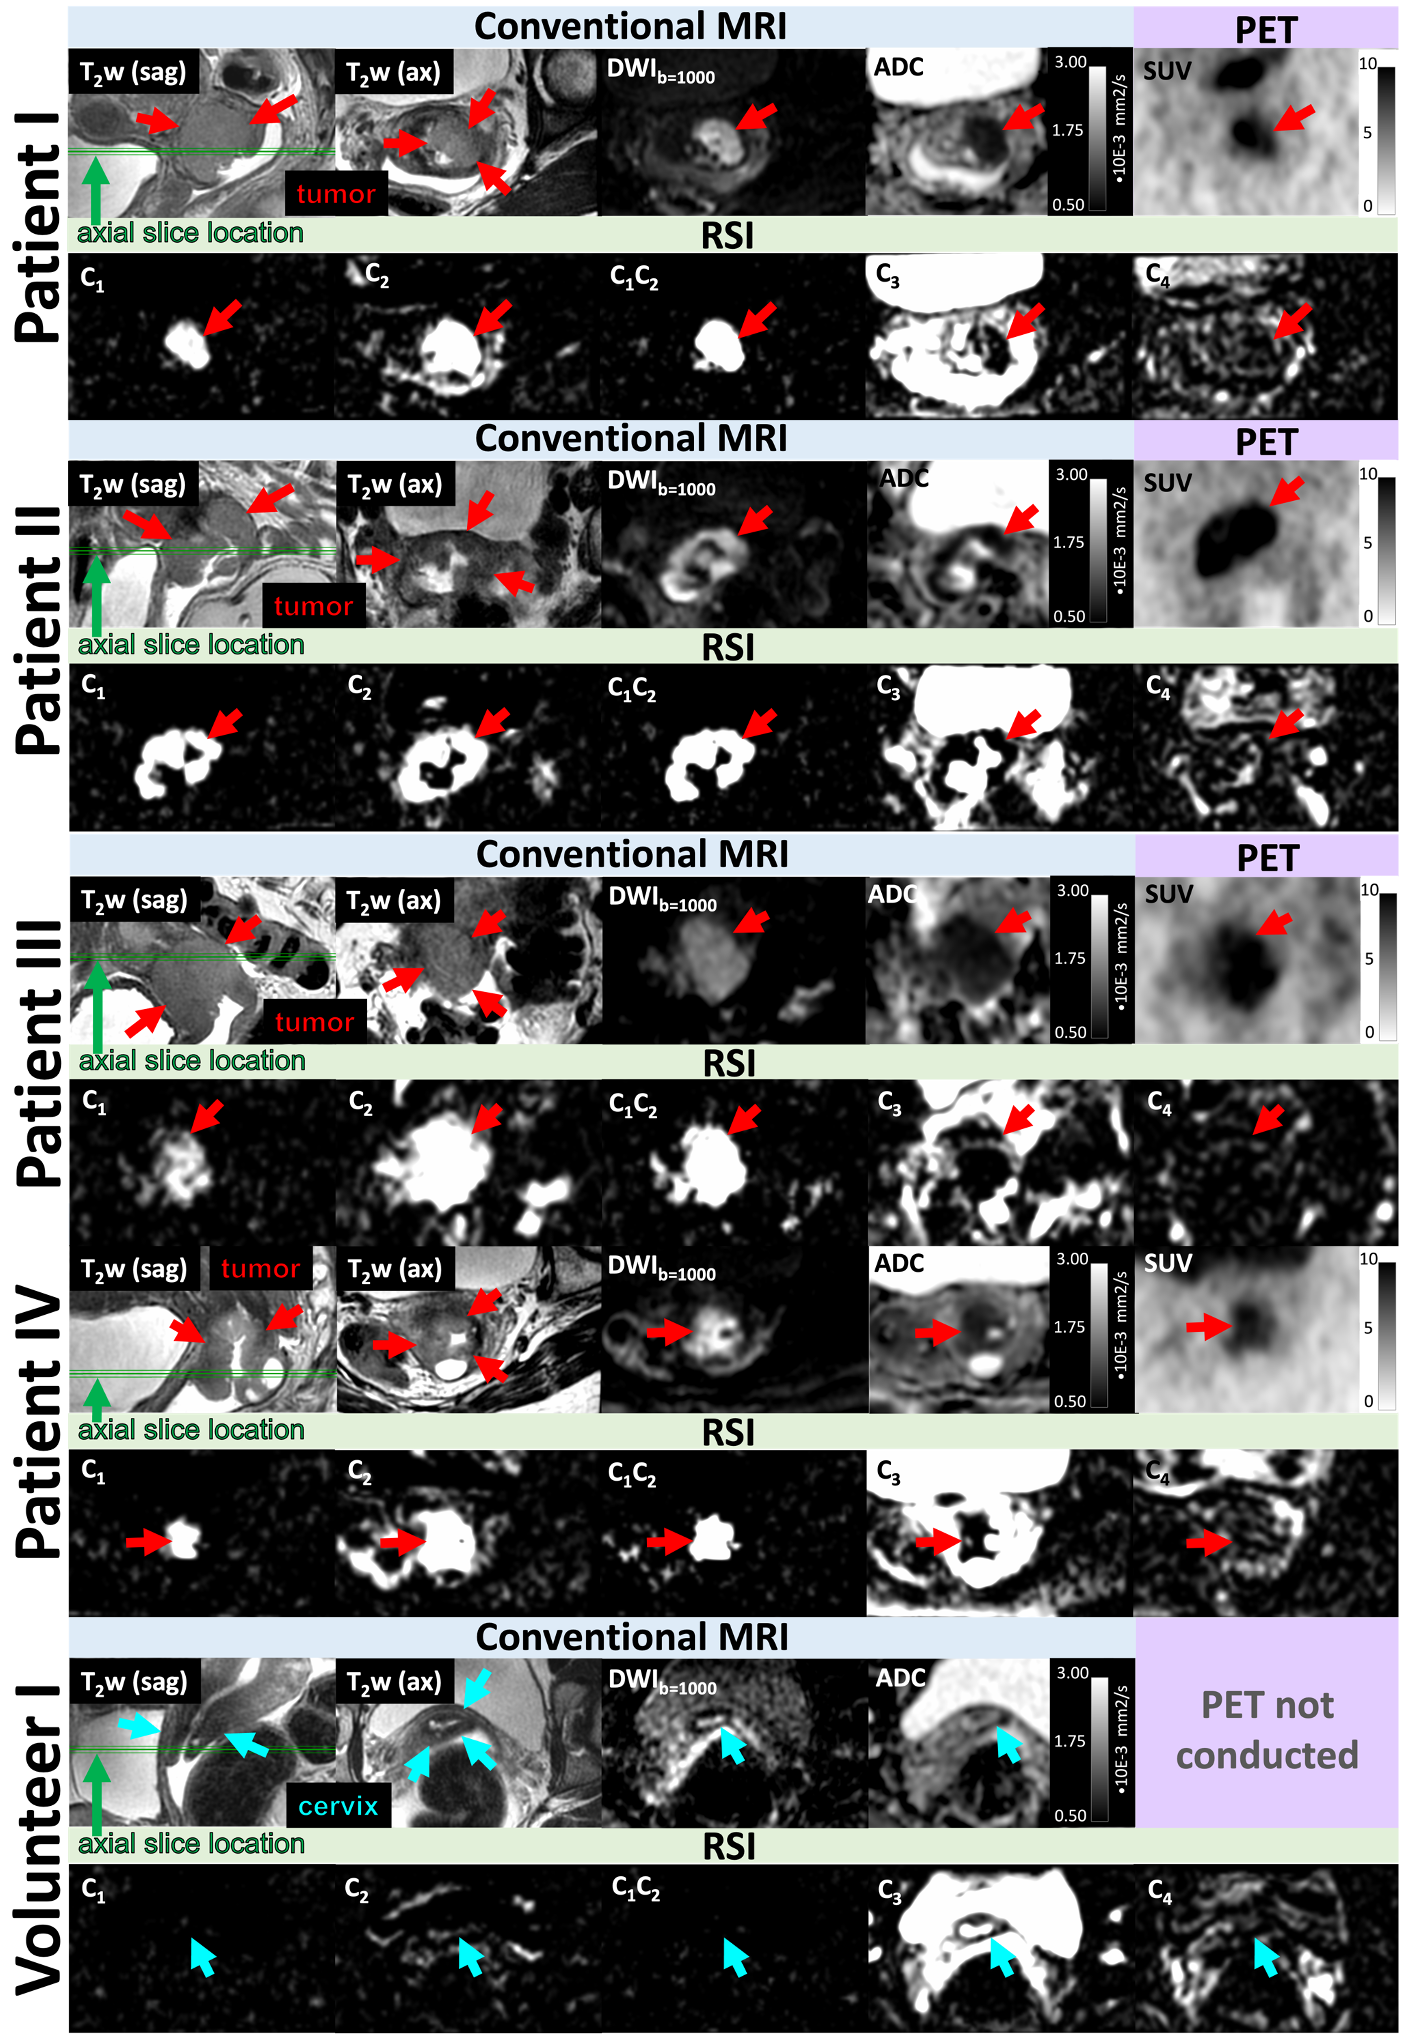
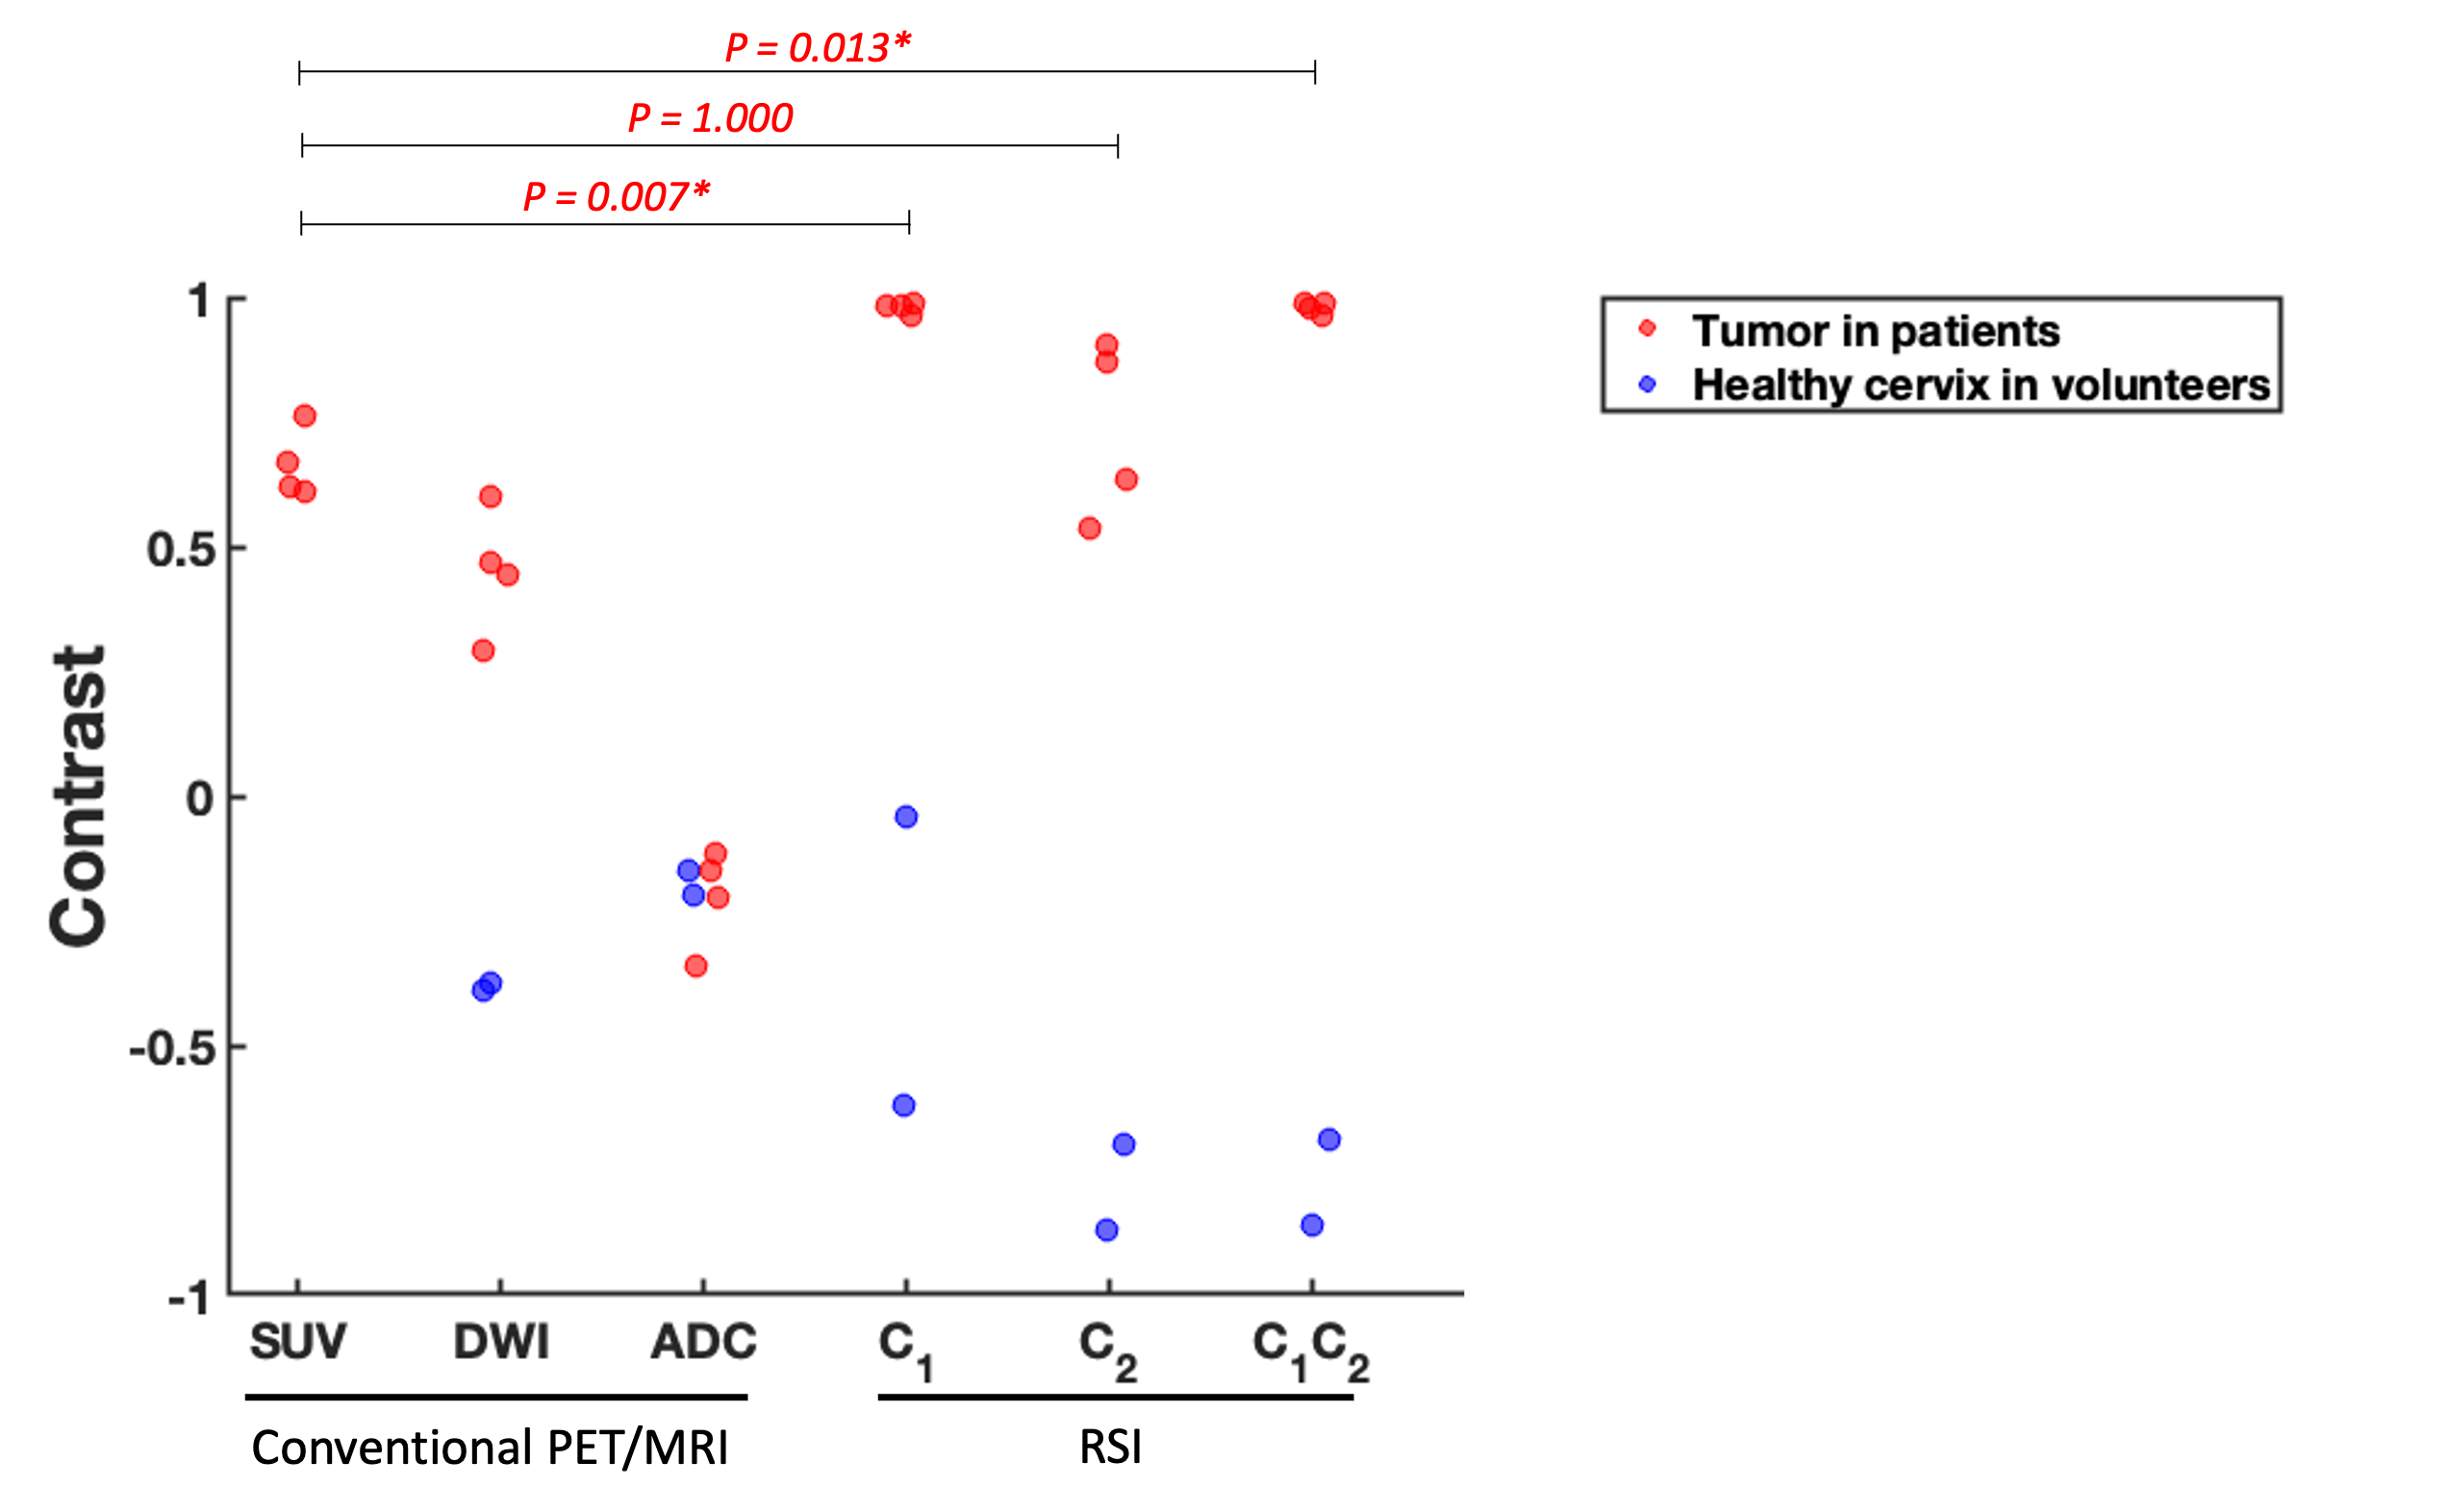
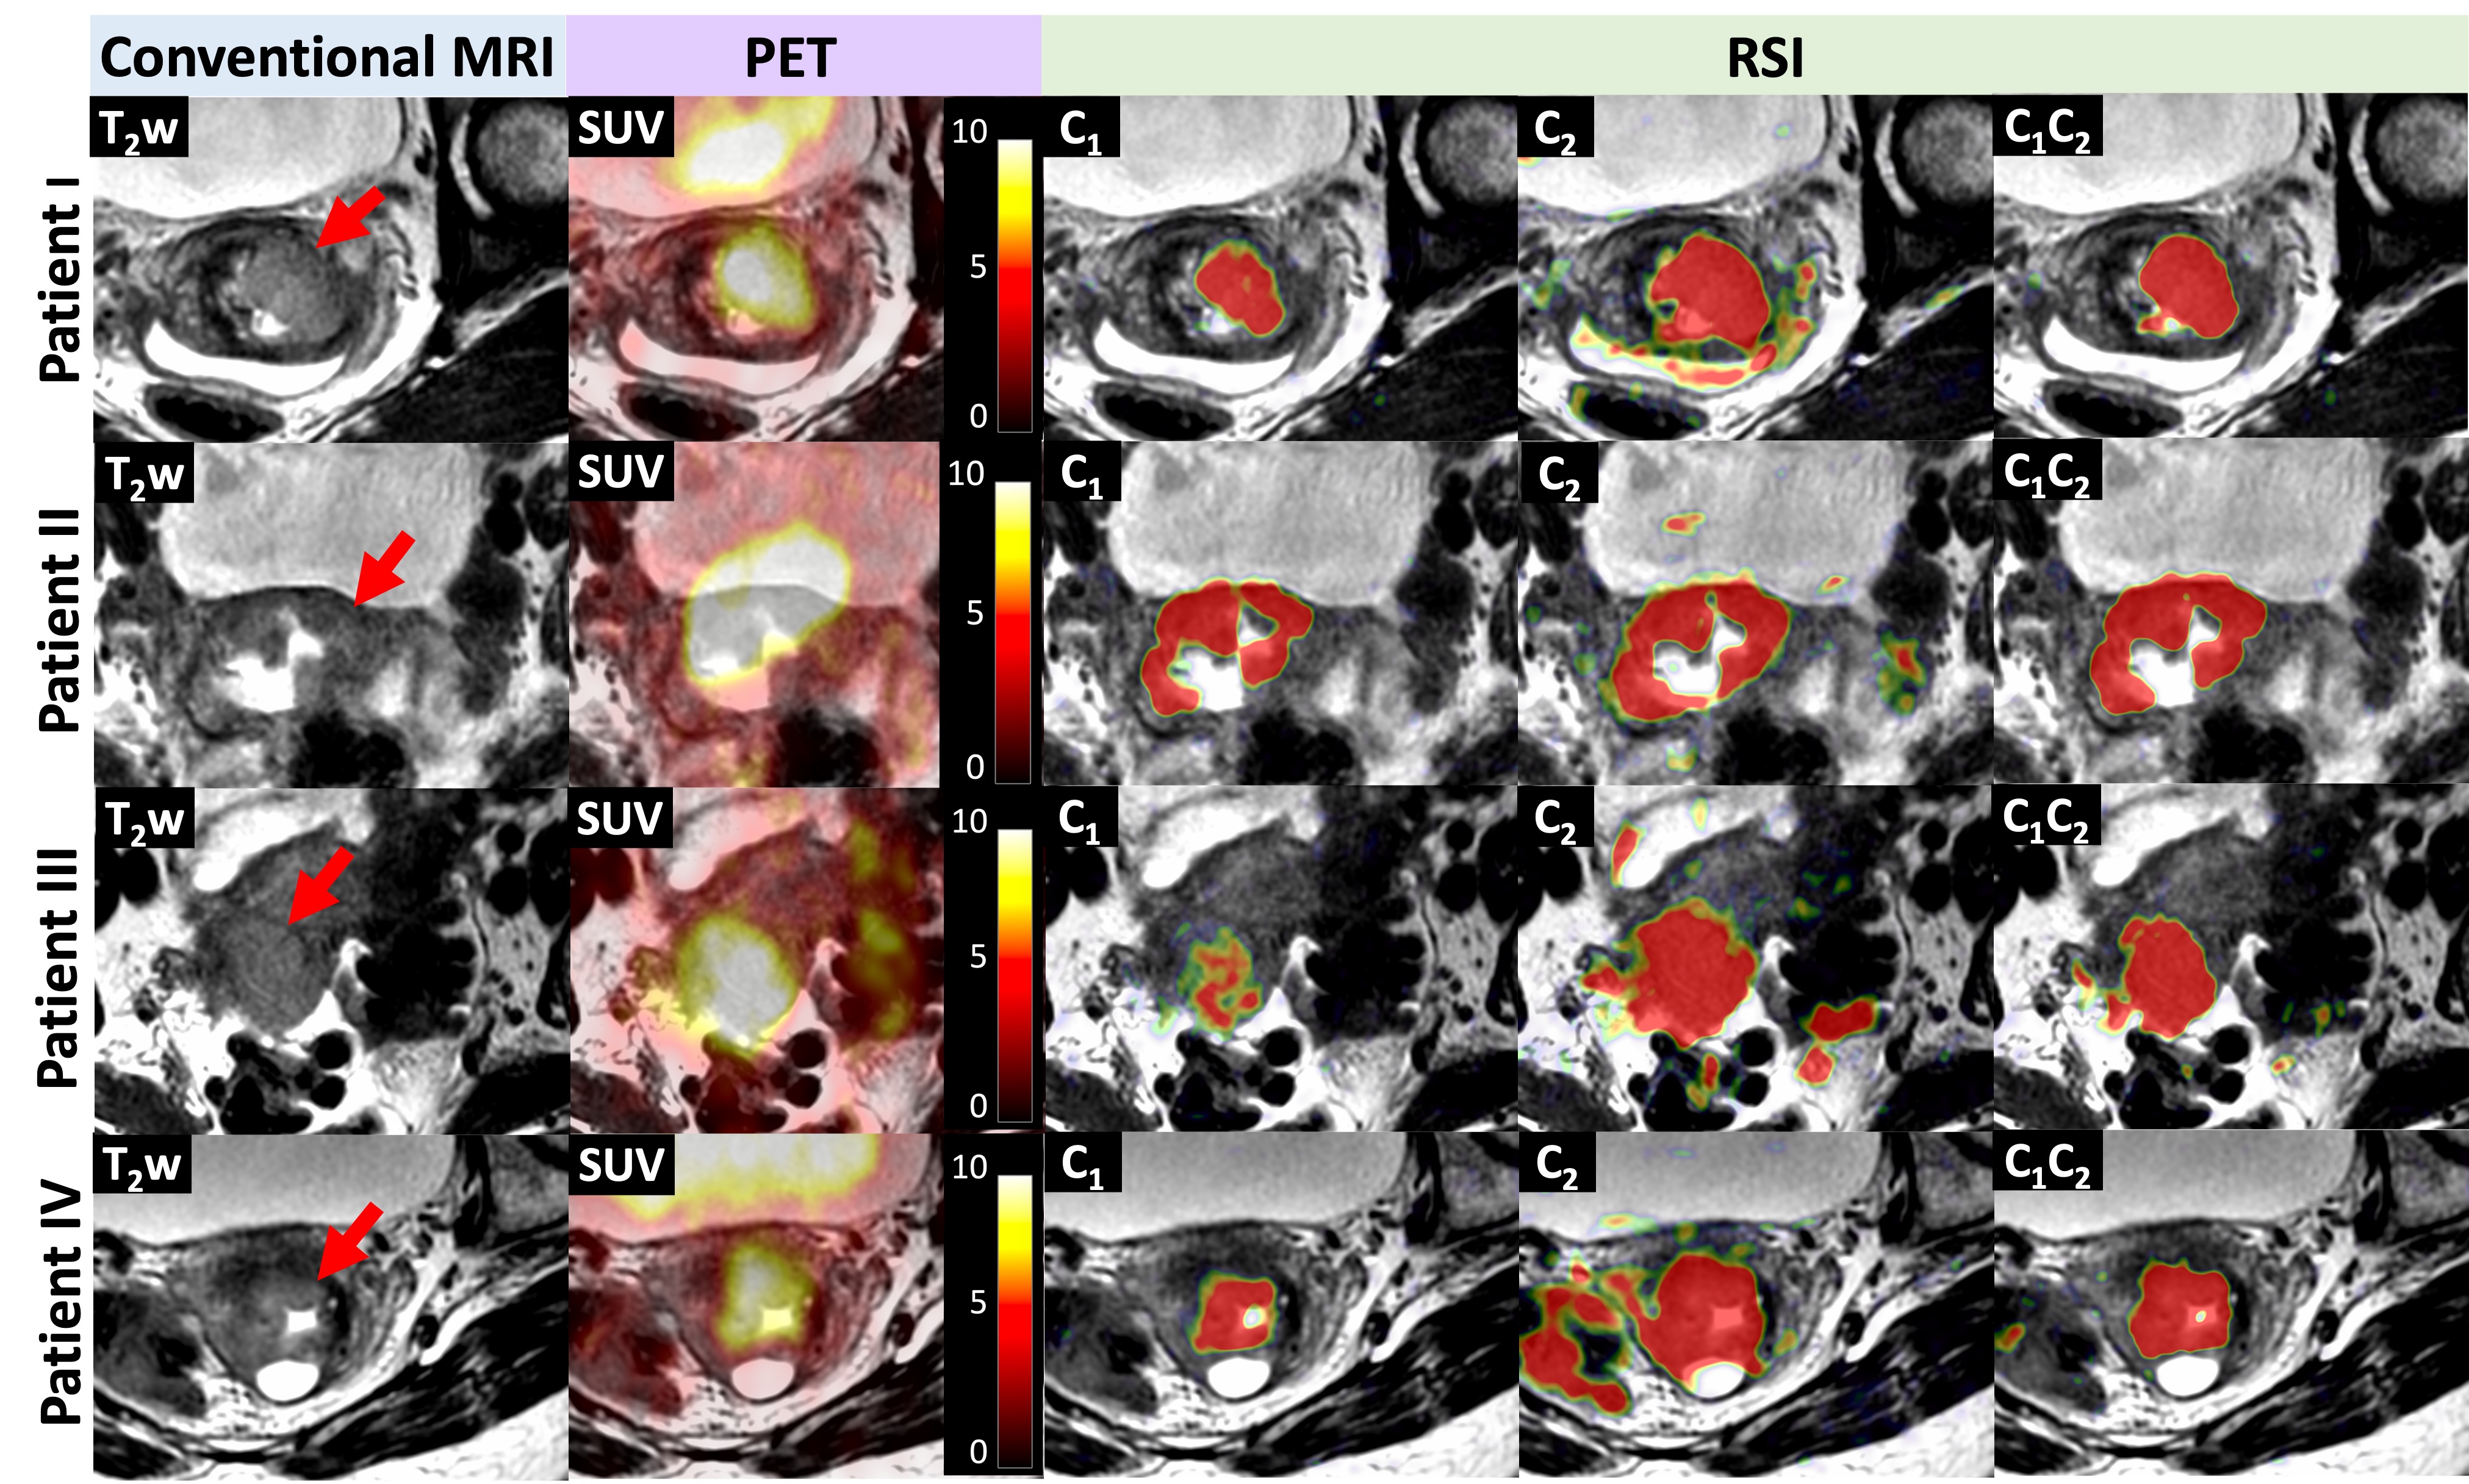
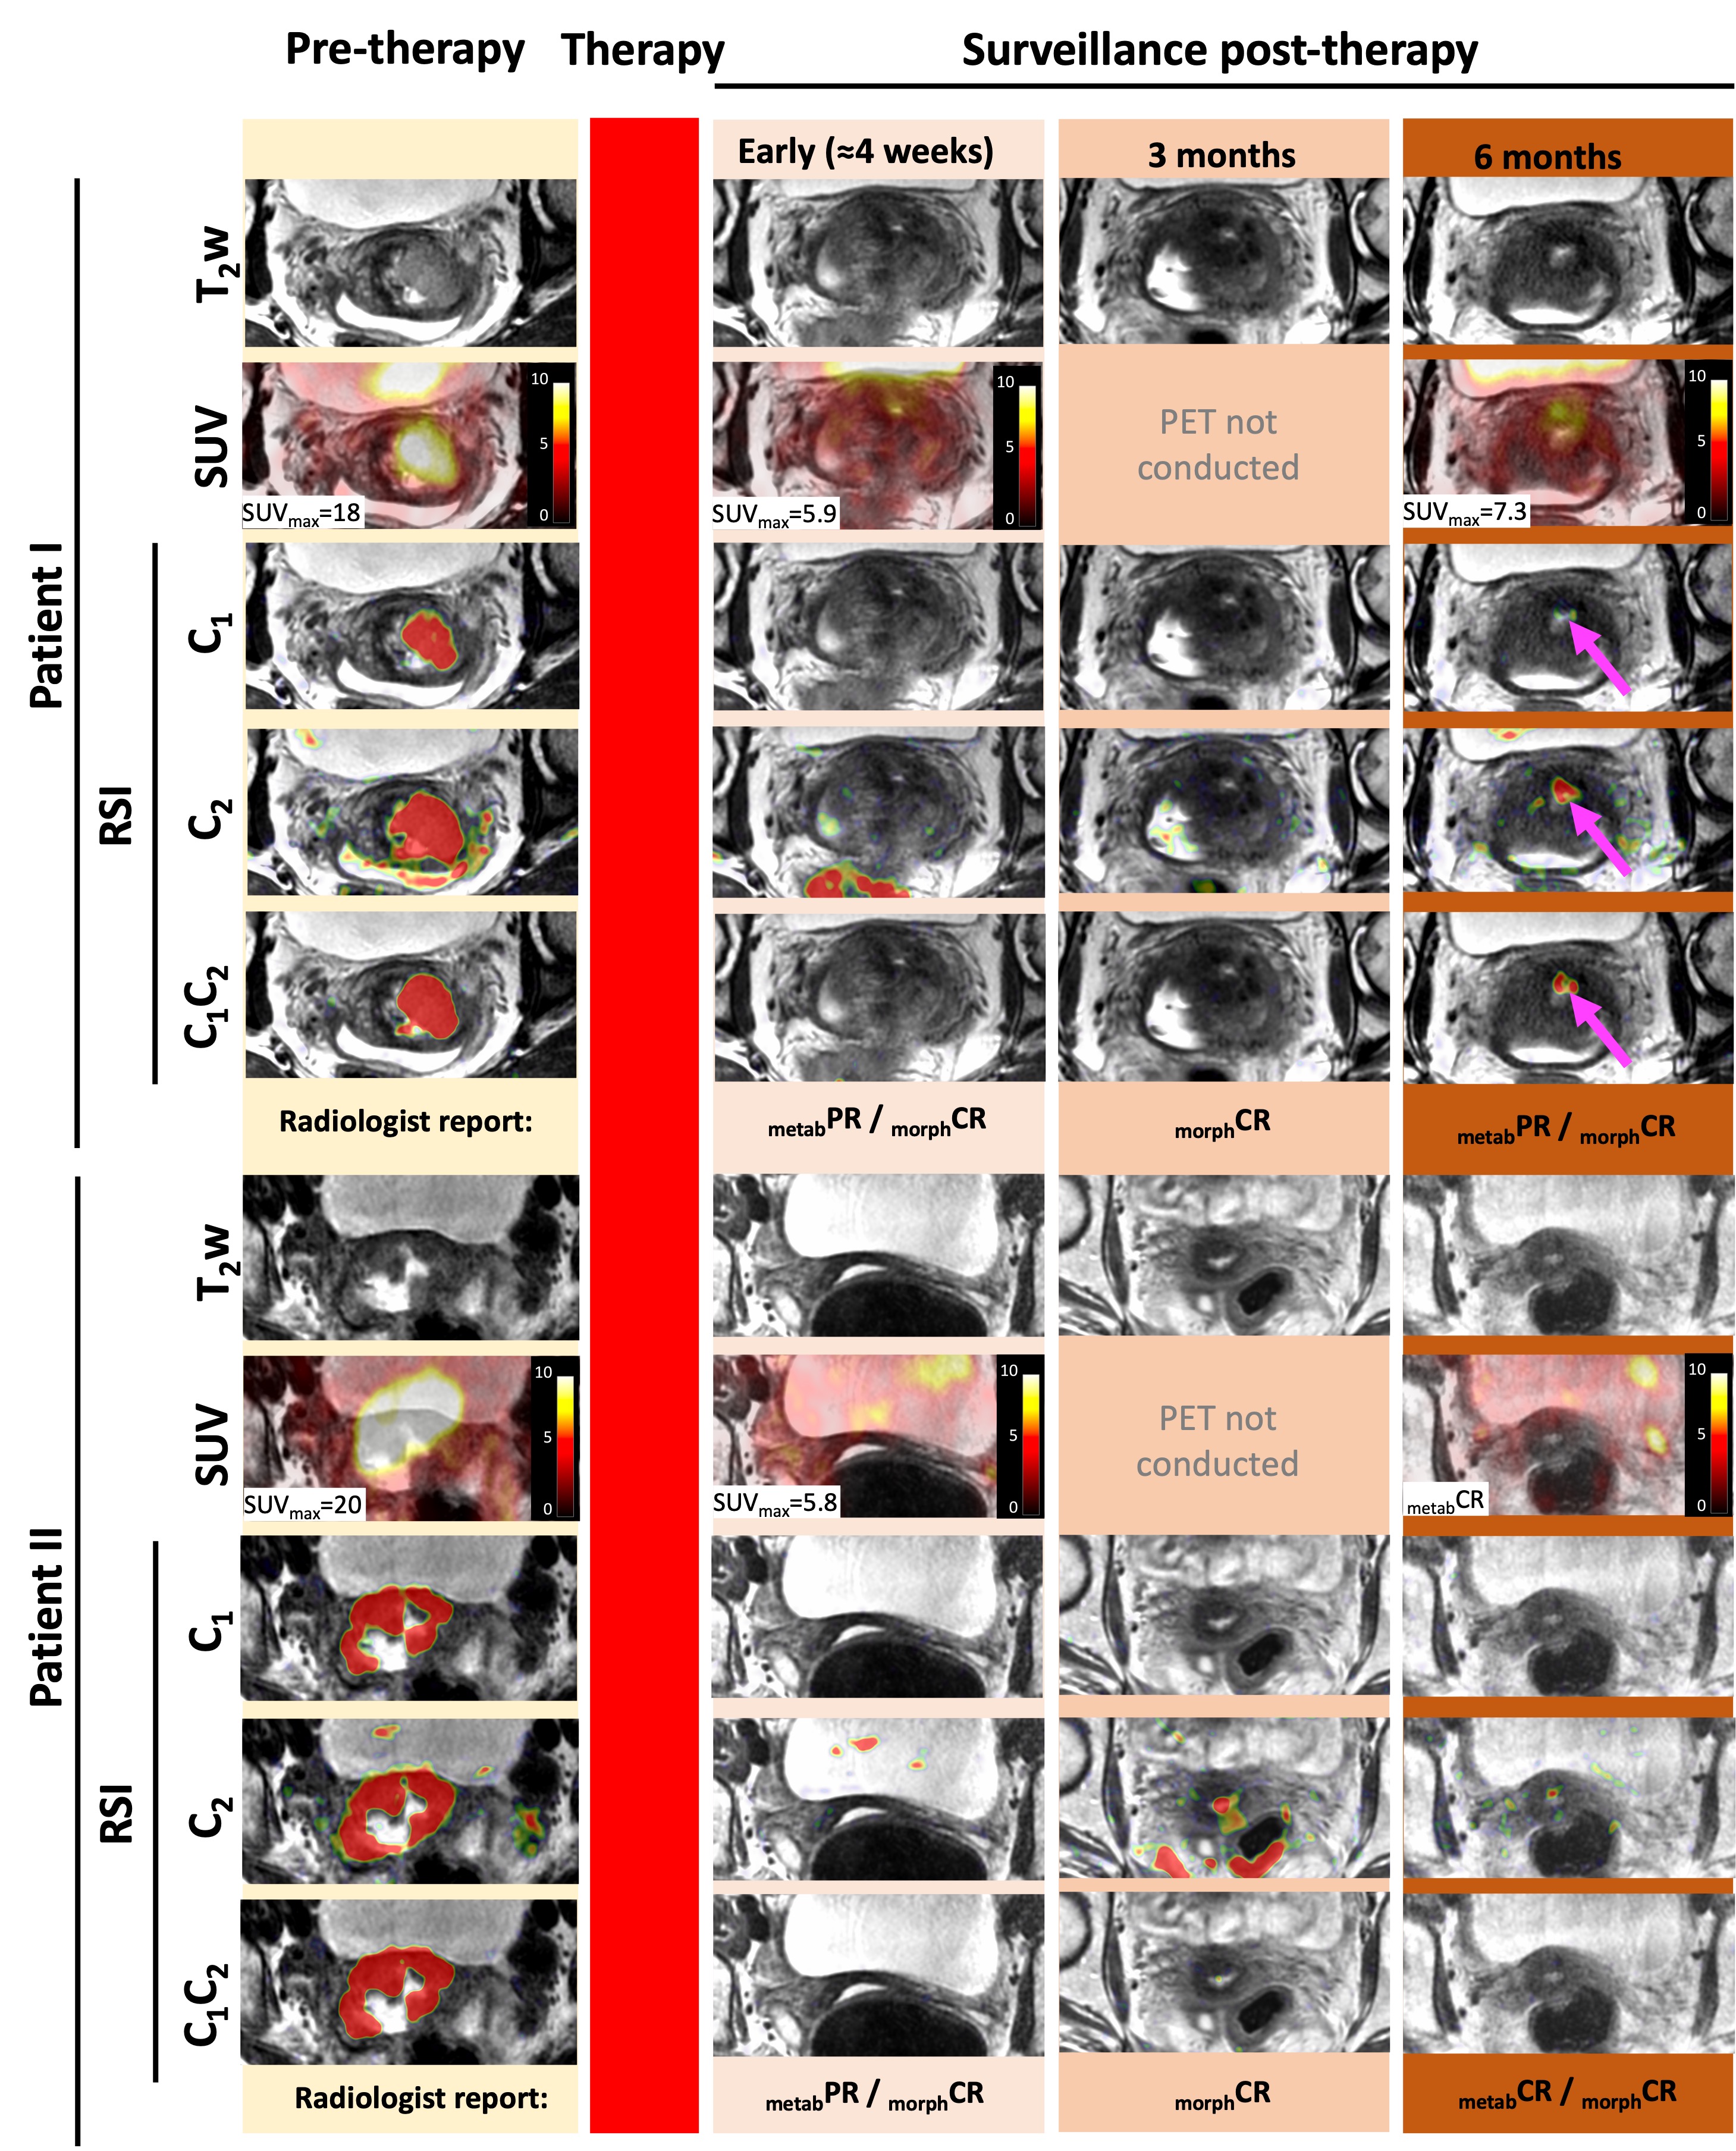
Fig. 4. Pre-/post-therapy images of Patient I–II and the radiologist report summary (metab=metabolic, morph=morphologic, PR=partial regression; CR=complete regression). PET SUV and RSI maps fused with T2w.
Patient I: No signs of tumor on C1 and C1C2 early and 3 months post-therapy but local signal 6 months post-therapy (arrows). The radiologist report concluded metabPR and morphCR at post-therapy surveillance.
Patient II: No signs of tumor on RSI and morphCR at post-therapy surveillance but metabPR at 3 months. At 6 months, the radiologist report concluded metabCR and morphCR.