0173
The MRI-based radiomics nomogram for predicting massive hemorrhage during dilatation and curettage1Shanghai first maternity and infant hospital, Shanghai, China, 2MR Research, GE Healthcare, Beijing, China
Synopsis
Keywords: Uterus, Uterus, Cesarean scar pregnancy;
Motivation: Dilation and Curettage (D&C) is the preferred treatment for Cesarean scar pregnancy (CSP) patients. However, current methods for preoperative assessment of intraoperative bleeding are limited.
Goal(s): To develop a nomogram using radiomics and MRI-based clinical information to predict massive hemorrhage during D&C in CSP patients.
Approach: 116 CSP patients were enrolled. Radiomics features and clinical variables were analyzed to conduct the radiomics and the clinical models. The nomogram was established by combining Radscore and the selected clinical variables.
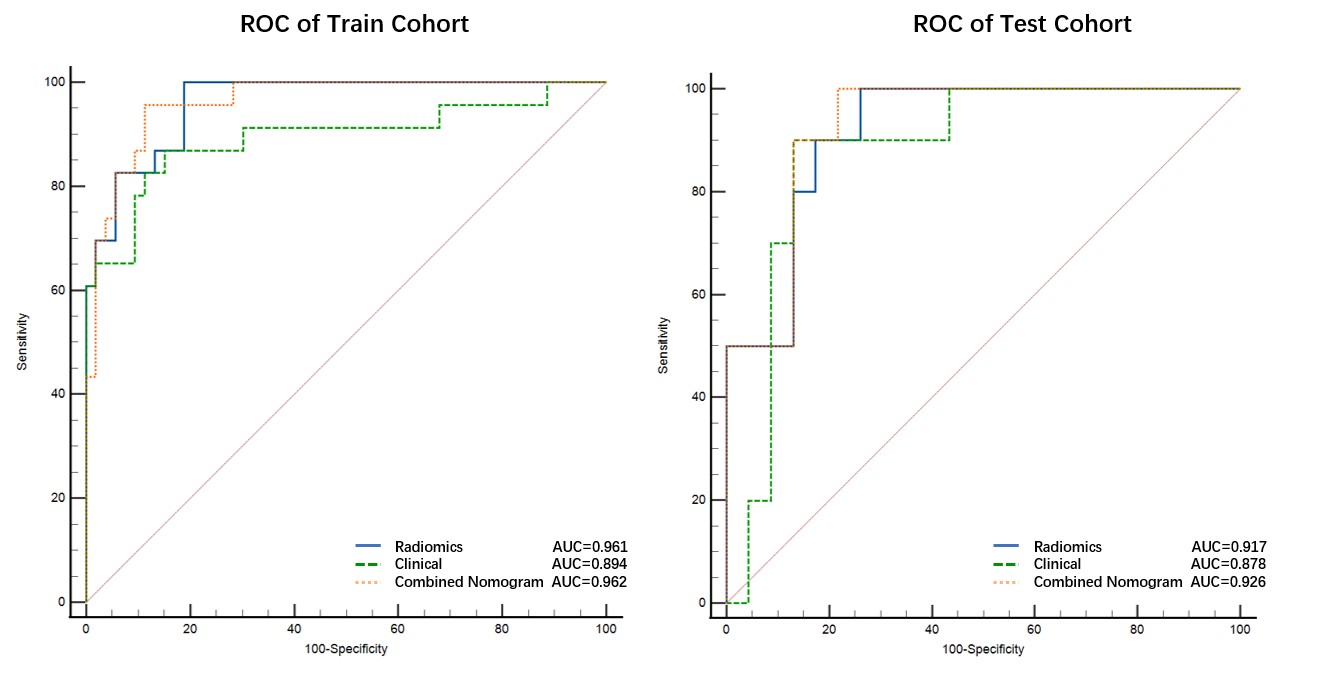
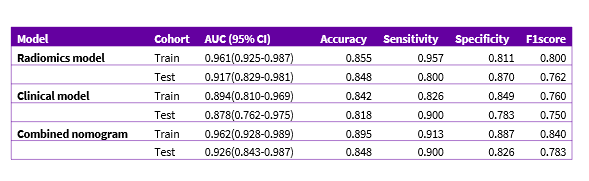
Results: Among the three models, the nomogram achieved the highest prediction performance with an AUC of 0.926 for test data.
Impact: This study first developed the MR-based radiomics nomogram to accurately predict massive hemorrhage preoperatively in CSP patients.
INTRODUCTION
Cesarean scar pregnancy (CSP) refers to an ectopic pregnancy where the gestational sac implants on a previous cesarean section scar [1]. The prevalence of CSP has risen alongside the increasing rate of cesarean sections [2]. Dilation and Curettage (D&C) is a common treatment for CSP, but it carries risks such as intraoperative bleeding, retained products of conception, and postpartum hemorrhage [3]. Identifying high-risk individuals before D&C is crucial to mitigate these complications. MRI has emerged as a valuable tool for evaluating CSP, offering clear visualization of the gestational sac and surrounding tissues [4]. Previous studies have identified factors like scar thickness, sac diameter, and cesarean section diverticulum (CSD) area, but these measurements may be prone to biases and have limited predictive accuracy [5-6]. Radiomics, a technique extensively used in the diagnosis and prognosis prediction of malignant tumors, however, to our knowledge, has not been explored for predicting massive bleeding during D&C in CSP patients. Therefore, this study aimed to develop a radiomics nomogram model to accurately predict massive hemorrhage preoperatively in patients with CSP.Materials and Methods
Patients116 CSP patients (76 non-massive hemorrhages, 33 massive hemorrhages) from January 2019 to December 2022 were enrolled and randomly divided into a training set (N = 76) and a test set (N = 33) at a ratio of 7:3.
MRI Acquisition
MR examinations were performed on a 1.5T MR scanner (OPTIMA MR360, GE Medical Systems, Milwaukee, WI) with an 8-channel phased-array coil. The sagittal CUBE sequence was selected for this study. The acquisition parameters were as follows: TR/TE, 2000 ms/91-95 ms; slice thickness, 1.6 mm; intersection gap, 0; matrix size, 228 ×228; FOV, 240x240. No gadolinium was administered in any case.
Clinical features
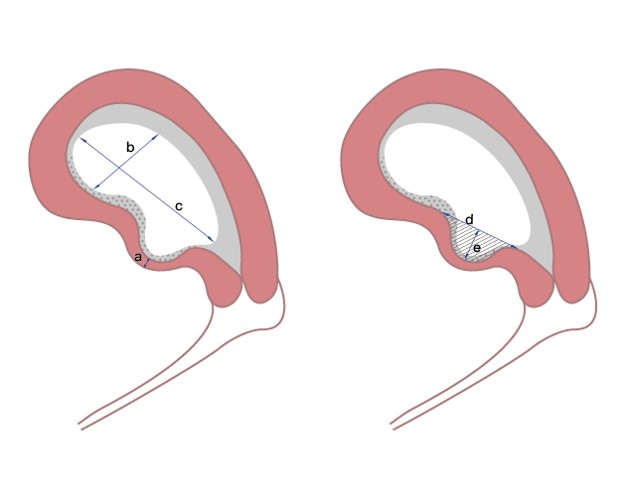
The baseline clinical data were retrieved from medical records. Several measurements were taken from sagittal MR images, including the maximum longitudinal diameter of the GS(c), the maximum transverse diameter of the GS(d), the minimum wall thickness of the CS diverticulum (CSD) defect(a), the maximum inlet diameter of the CSD(b), the maximum depth of the CSD(e), and area of the CSD (Figure 1).
Radiomics Analysis and Machine Learning Model Construction
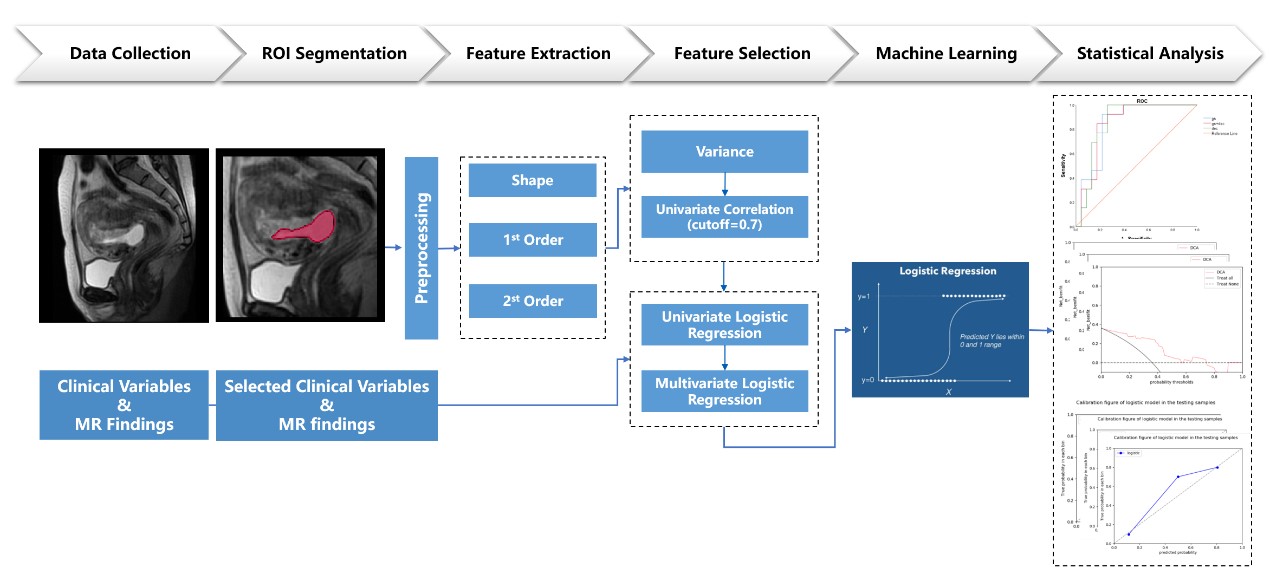
Figure 2 shows the pipeline of the GS radiomics nomogram for CSP patients. Three-dimensional ROIs were segmented on Sagittal T2W CUBE images using ITK-SNAP software (v3.8.0). PyRadiomics (v3.0.1) automatically extracted 1502 three-dimensional radiomics features, which were subsequently normalized using Z-score. Univariate correlation analysis, univariate and multivariate logistic regression analysis were employed for feature selection, radiomics score (Radscore) calculation, and radiomics model development. Statistically significant clinical variables and MR findings were chosen for the clinical model. A nomogram with 5-fold cross-validation integrated the radiomics model and the clinical model.
Statistical Analysis
Statistical analyses were performed using SPSS (version 26.0), and R software (version 4.2.2). The difference test of clinical and MR variables used an independent-sample t-test, Mann-Whitney U test, or Chi-squared test. The models were evaluated using the receiver operating characteristic (ROC) curves and the area under the curve (AUC) analysis. AUCs were compared using Delong’s test. Accuracy, sensitivity, and specificity were calculated using Youden’s J index. The goodness of fit was assessed using the Hosmer‒Lemeshow (H-L) test and calibration curve. The clinical usefulness of the models was evaluated using decision curve analysis (DCA). A two-tailed p < 0.05 indicated statistical significance.
Results
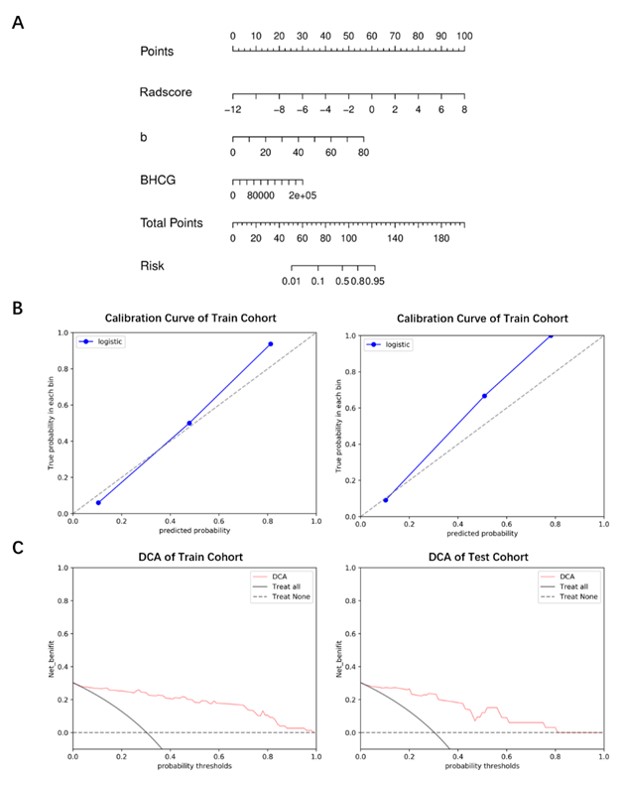
Serum β-hCG and the maximum inlet diameter of the CSD (P < 0.05) were identified as significant clinical prognostic factors for massive hemorrhage. The nomogram displayed the highest AUCs of 0.962 (95% CI 0.928-0.989) and 0.926 (95% CI 0.843-0.987) in the training and testing cohorts, respectively, outperforming the other models (Figure 3). Other evaluation matrices are shown in Table 1. The nomogram calibration curve exhibited good agreement between predicted and observed outcomes, with no significant differences found in the H-L test (all p > 0.05). DCA revealed a substantial overall net benefit for the nomogram (Figure 4).Discussion and Conclusion
In this study, we constructed a nomogram to identify preoperative massive hemorrhage, which could provide an easy-to-use and personalization tool for CSP patients. The findings indicate that the combination of radiomics and clinical characteristics leads to higher AUCs, suggesting that this combined approach is more effective in predicting the risk of massive hemorrhage in CSP patients.Acknowledgements
No acknowledgement found.References
1. Allerkamp HH, Clark AR, Lee TC, Morgan TK, Burton GJ, James JL: Something old, something new: digital quantification of uterine vascular remodelling and trophoblast plugging in historical collections provides new insight into adaptation of the utero-placental circulation. Hum Reprod 2021, 36(3):571-586.
2. Tang Y, Zhang Y, Tang H, Che J, Feng H, Yao X, Chen Q: A Comparison of Ultrasound Guided Curettage With and Without Uterine Artery Embolization on Controlling Intraoperative Blood Loss for a Cesarean Scar Pregnancy Treatment: Study Protocol for a Randomized Clinical Trial. Front Endocrinol (Lausanne) 2021, 12:651273.
3. Qiao B, Zhang Z, Li Y: Uterine Artery Embolization Versus Methotrexate for Cesarean Scar Pregnancy in a Chinese Population: A Meta-analysis. J Minim Invasive Gynecol 2016, 23(7):1040-1048.
4. Guo S, Wang H, Yu X, Yu Y, Wang C: The diagnostic value of 3.0T MRI in cesarean scar pregnancy. Am J Transl Res 2021, 13(6):6229-6235.
5. Liu S, Sun J, Cai B, Xi X, Yang L, Sun Y: Management of Cesarean Scar Pregnancy Using Ultrasound-Guided Dilation and Curettage. J Minim Invasive Gynecol 2016, 23(5):707-711.
6. Du Q, Zhao W: Exploring the value of cesarean section diverticulum area to predict the safety of hysteroscopic management for cesarean scar pregnancy patients. Int J Gynaecol Obstet 2022, 156(3):488-493.
Figures