0170
Acidic Tumor Microenvironment-Activated MRI Nanoprobes for Modulation and Visualization of Anti-PD-L1 Immunotherapy1Jiangsu Key Laboratory of Molecular and Functional Imaging, Department of Radiology, Zhongda Hospital, Medical School, Southeast University, 87 DingJiaQiao Road, Nanjing, 210009, P. R. China., Jiangsu,Nanjing, China
Synopsis
Keywords: Probes & Targets, Cancer
Motivation: Molecular imaging holds revolutionary significance in the diagnosis and treatment of tumors.
Goal(s): Clinical trials targeting immune checkpoint receptors with immune checkpoint blockade (ICB) therapies has encountered limited efficacy in pancreatic cancer.
Approach: MRI-guide ICB therapy (MRGIT) strategy for enhancing and guiding anti-PD-L1 therapy was proposed.
Results: The successful inhibition of tumor growth via MRGIT strategy in pancreatic tumor models demonstrates that it may be efficiently reverse the immunosuppressive PDAC and improve the ICB therapy with the employment of MRI technology.
Impact: The MRGIT strategy bridging the antitumor immune response with the MRI technique, which devised a potent tool that holds great promise for improving cancer diagnosis and facilitating the development of personalized treatment strategies tailored to individual patients.
Methods The pH-responsive nanoprobe (APPAM@U-104) that can modulate and indicate the tumor pH was synthesized first. The tumor pH imaging and reduction acidification of APPAM@U-104 in Panc02-tumor bearing mice were investigated by MR-T1 and T2 imaging. The switch time of the T1-MR to T2-MR enhancement were studied to confirm the best time of anti-PD-L1 administration. The flow cytometry and immunofluorescence staining of tumors were performed to analysis T cells activation after the combination of APPAM@U-104 with anti-PD-L1 treatment.
Results The APPAM@U-104 treated mice showed a leverage of TME pH from 6.5 to 7.2, accompanied by a MR signal transition from T1 to T2, and the followed treatment of anti-PD-L1 at the T2 “ON” time significant inhibited tumor growth. In addition, immunological detection revealed the increased CD8+ T cell infiltration which was enhanced in the combination with anti-PD-L1 in Panc02-tumor bearing mice.
Conclusion We developed a novel MRGIT strategy to remodel the acidic TME and guide the anti-PD-L1 administration as pH of the TME approaches neutrality. By bridging antitumor immune response with molecular imaging, we have exploited a powerful tool to improve the cancer of immunotherapy.
Keywords Pancreatic ductal adenocarcinoma · pH modulation · Molecular imaging · Anti-PD-L1 · Immunotherapy
Acknowledgements
This study was supported by the National Natural Science Foundation of China (NSFC, No. 92059202, 82302272,81830053, and 82001888), the Natural Science Foundation of Jiangsu Province (BK20220831) and the National Key R&D Program of China (2021YFF0501504).
References
1. Neutralization of Tumor Acidity Improves Antitumor Responses to Immunotherapy. Cancer Res. 2016 Mar 15;76(6):1381-90.
2. Nano-Econazole Enhanced PD-L1 Checkpoint Blockade for Synergistic Antitumor Immunotherapy against Pancreatic Ductal Adenocarcinoma. Small. 2023 Mar 10;e2207201.
3. Chemical Modulation of Glucose Metabolism with a Fluorinated CaCO3 Nanoregulator Can Potentiate Radiotherapy by Programming Antitumor Immunity. ACS Nano. 2022 Sep 27;16(9):13884-13899.
4. Targeting the bicarbonate transporter SLC4A4 overcomes immunosuppression and immunotherapy resistance in pancreatic cancer. Nat Cancer. 2022 Dec;3(12):1464-1483. 5. The Acidic Tumor Microenvironment as a Driver of Cancer. Annu Rev Physiol. 2020 Feb 10;82:103-126.
6. Targeting focal adhesion kinase renders pancreatic cancers responsive to checkpoint immunotherapy. Nat Med. 2016 Aug;22(8):851-60.
7. Arginine Supplementation Targeting Tumor-Killing Immune Cells Reconstructs the Tumor Microenvironment and Enhances the Antitumor Immune Response. ACS Nano. 2022 Aug 23;16(8):12964-12978.
8. Collagen promotes anti-PD-1/PD-L1 resistance in cancer through LAIR1-dependent CD8+ T cell exhaustion. Nat Commun. 2020 Sep 9;11(1):4520.
9. Enhanced response to PD-L1 silencing by modulation of TME via balancing glucose metabolism and robust co-delivery of RNA/Resveratrol with dual-responsive polyplexes. Biomaterials. 2021 Apr;271:120711.
10. Polyamines drive myeloid cell survival by buffering intracellular pH to promote immunosuppression in glioblastoma. Sci Adv. 2021 Feb 17;7(8):eabc8929.
11. Nanoparticle Delivery of RIG-I Agonist Enables Effective and Safe Adjuvant Therapy in Pancreatic Cancer. Mol Ther. 2019 Mar 6;27(3):507-517.
12. CA9-Related Acidic Microenvironment Mediates CD8+ T Cell Related Immunosuppression in Pancreatic Cancer. Front Oncol. 2022 Jan 27;11:832315.
13. Translation control of the immune checkpoint in cancer and its therapeutic targeting. Nat Med. 2019 Feb;25(2):301-311.
14. Oncogenic KRAS-Driven Metabolic Reprogramming in Pancreatic Cancer Cells Utilizes Cytokines from the Tumor Microenvironment. Cancer Discov. 2020 Apr;10(4):608-625.
15. Regulation of pH by Carbonic Anhydrase 9 Mediates Survival of Pancreatic Cancer Cells With Activated KRAS in Response to Hypoxia.astroenterology. 2019 Sep;157(3):823-837.
Figures
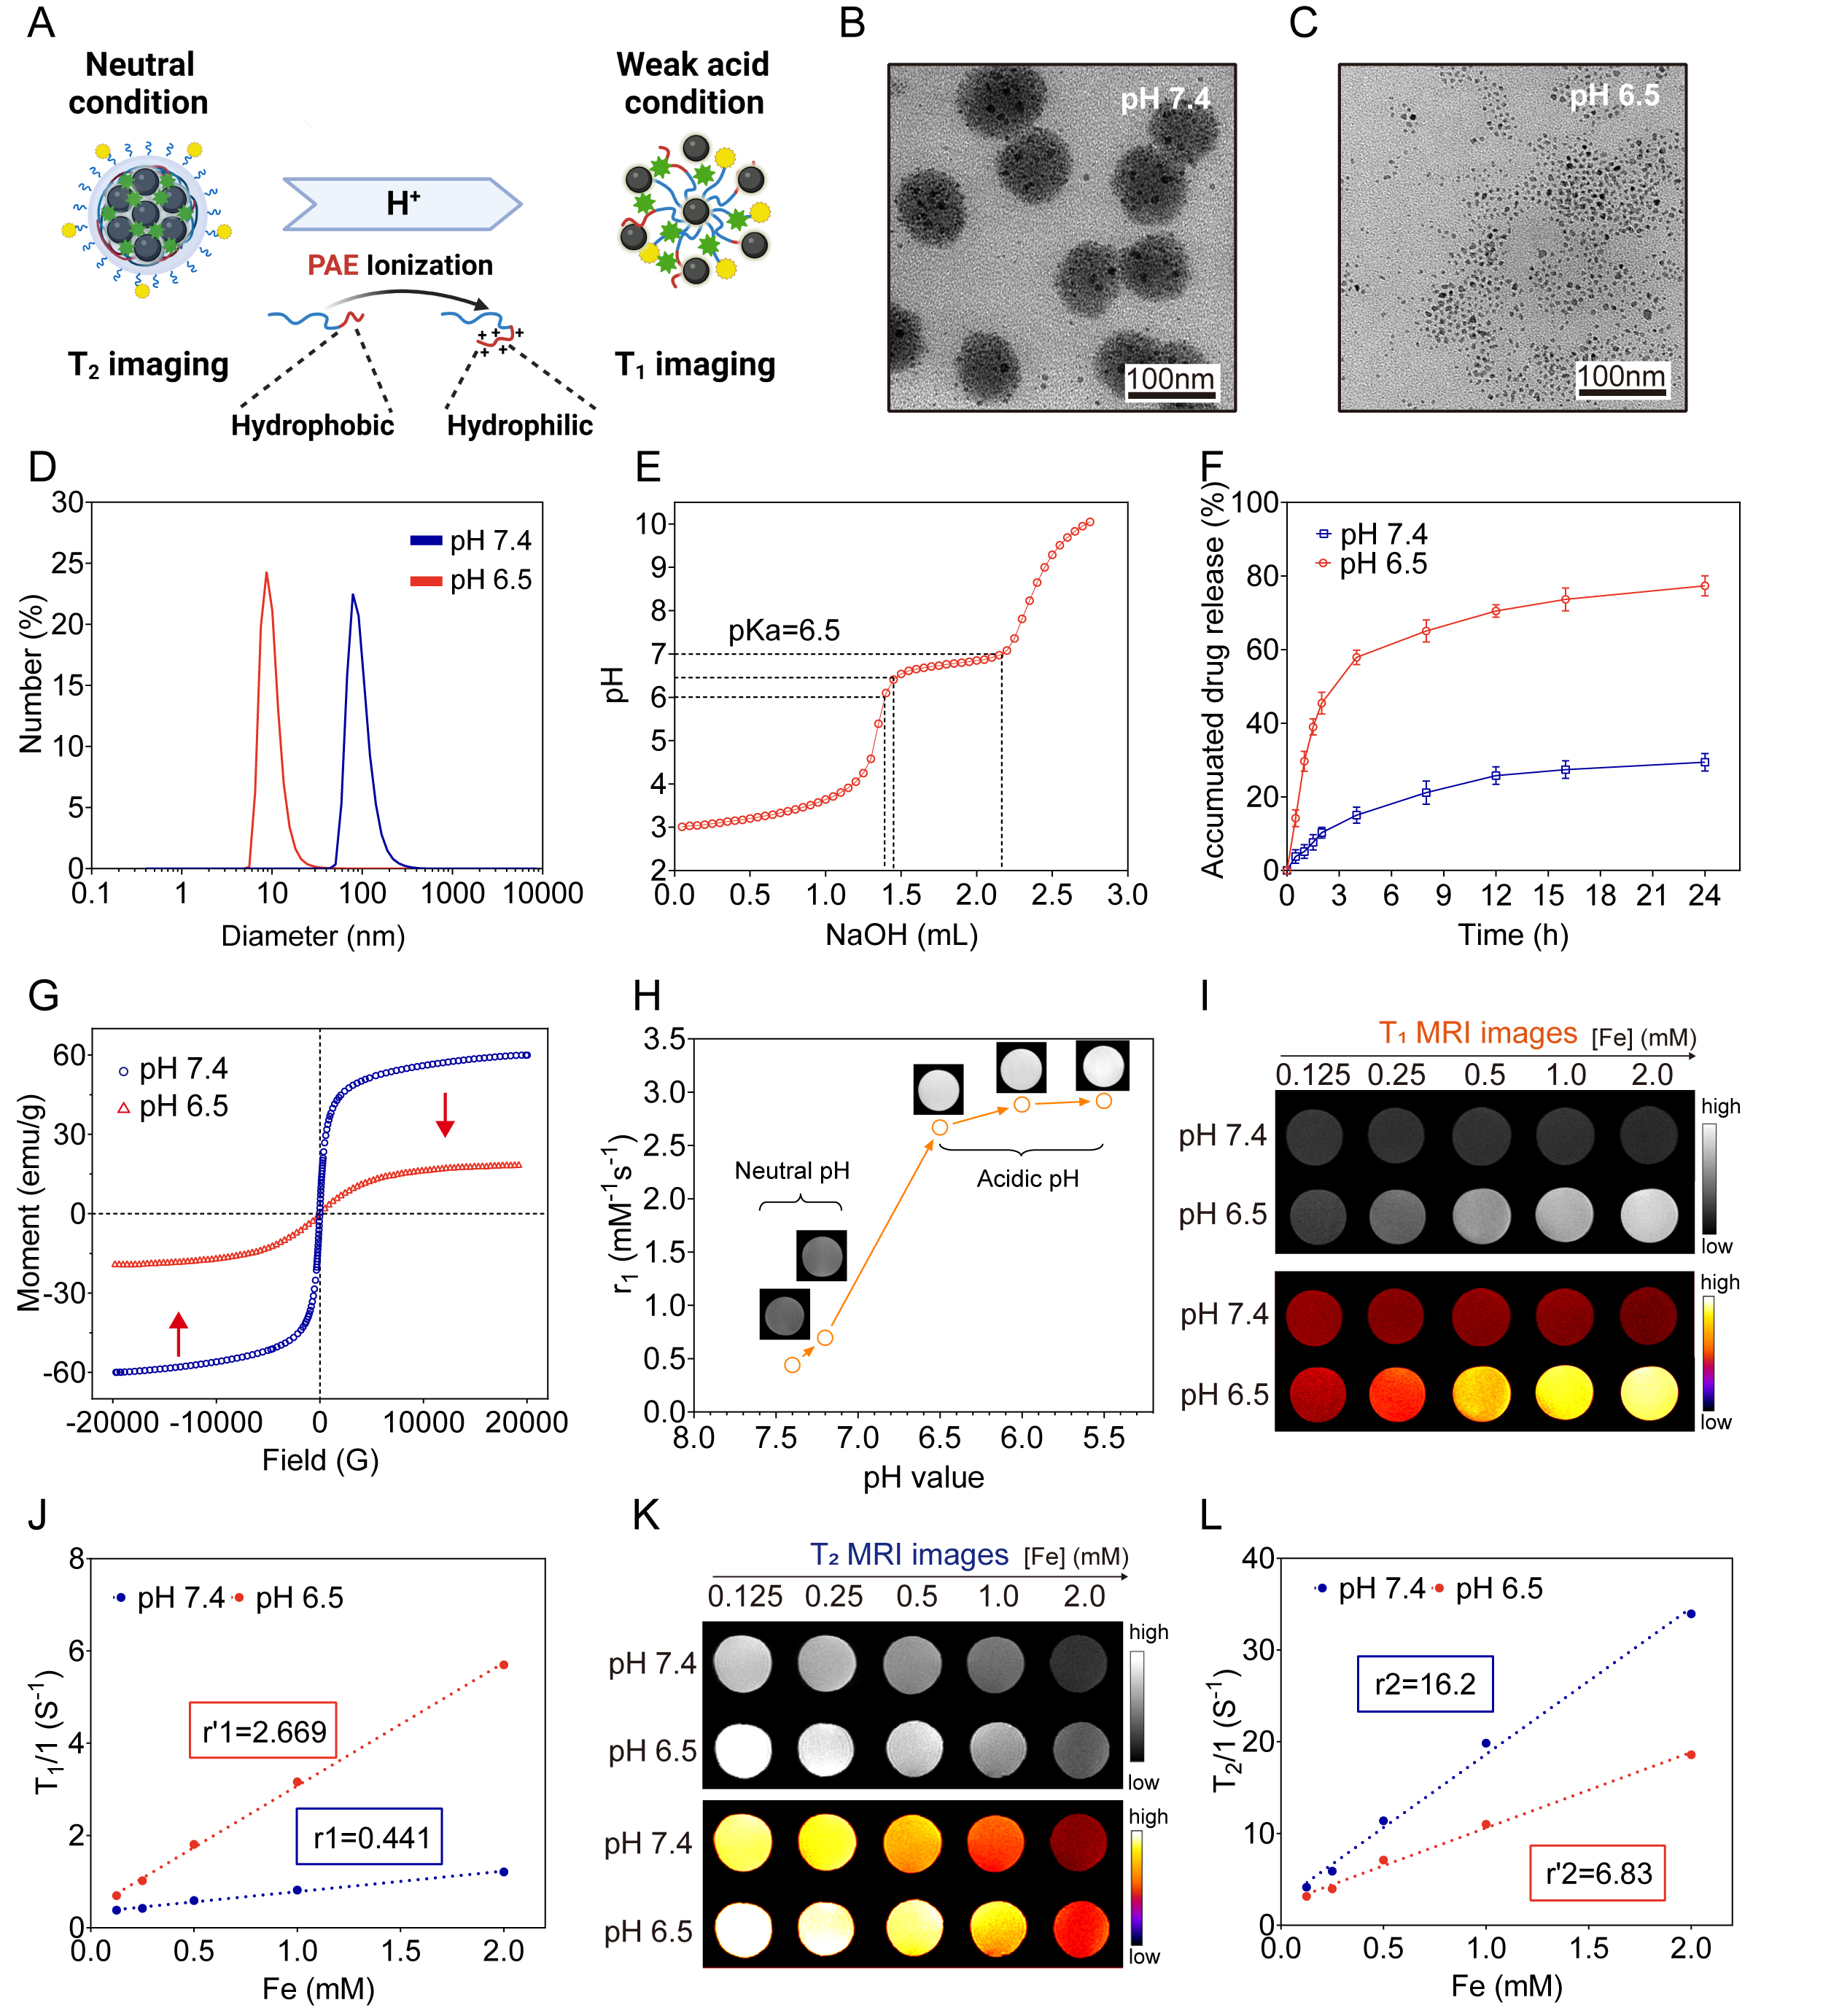
Fig. 1 (A) pH sensitive of nanoprobes. (B; C) Representative TEM images of APPAM@U-104 incubated in PBS at pH 7.4 and pH 6.5. (D) DLS size of APPAM@U-104 at pH 7.4 and pH 6.5 (E) Acid–base titration of a copolymer of OPSS-PEG-PLL-PAE. (F) Field-dependent magnetization curves of the in pH 7.4 and pH 6.5. (G) The r1 values of APPAM@U-104 nanoprobe incubated at pH 7.4 or pH 6.5. (H) Acid responsive contrast of APPAM@U-104 nanoprobes. (I-J) T1-MR and T2-MR images of of APPAM@U-104 and their corresponding relaxtion time treated with different pHs.
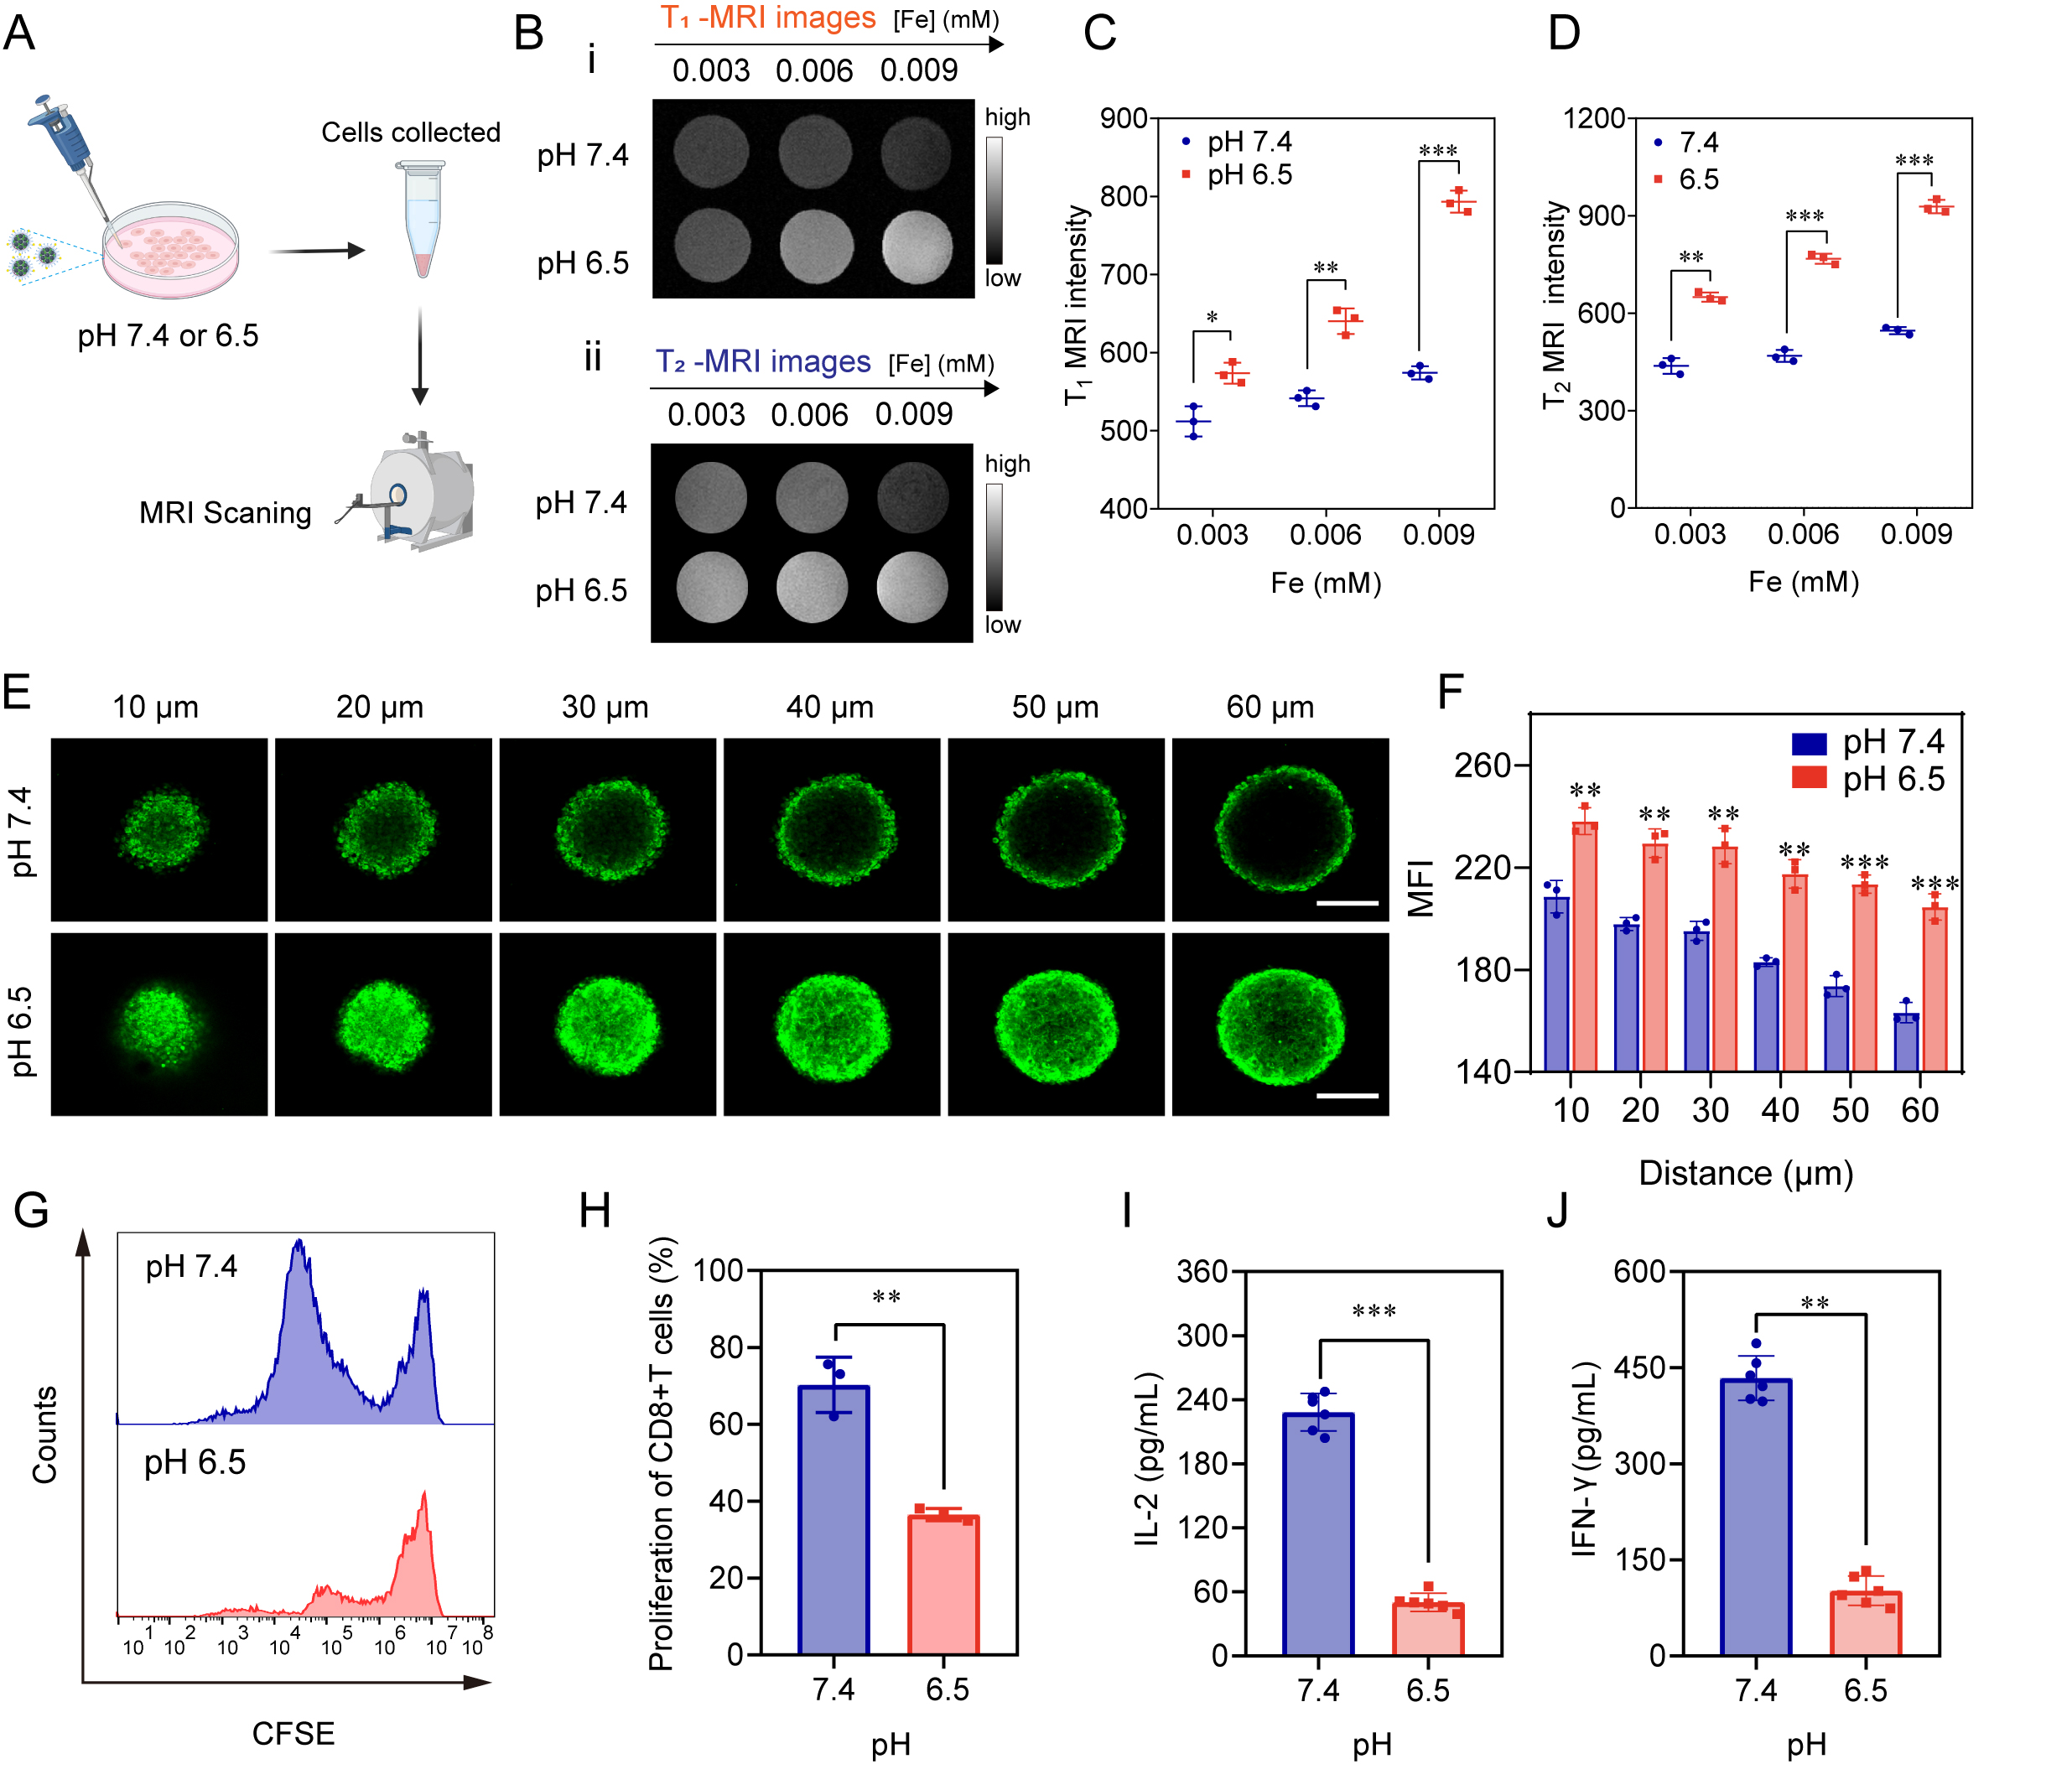
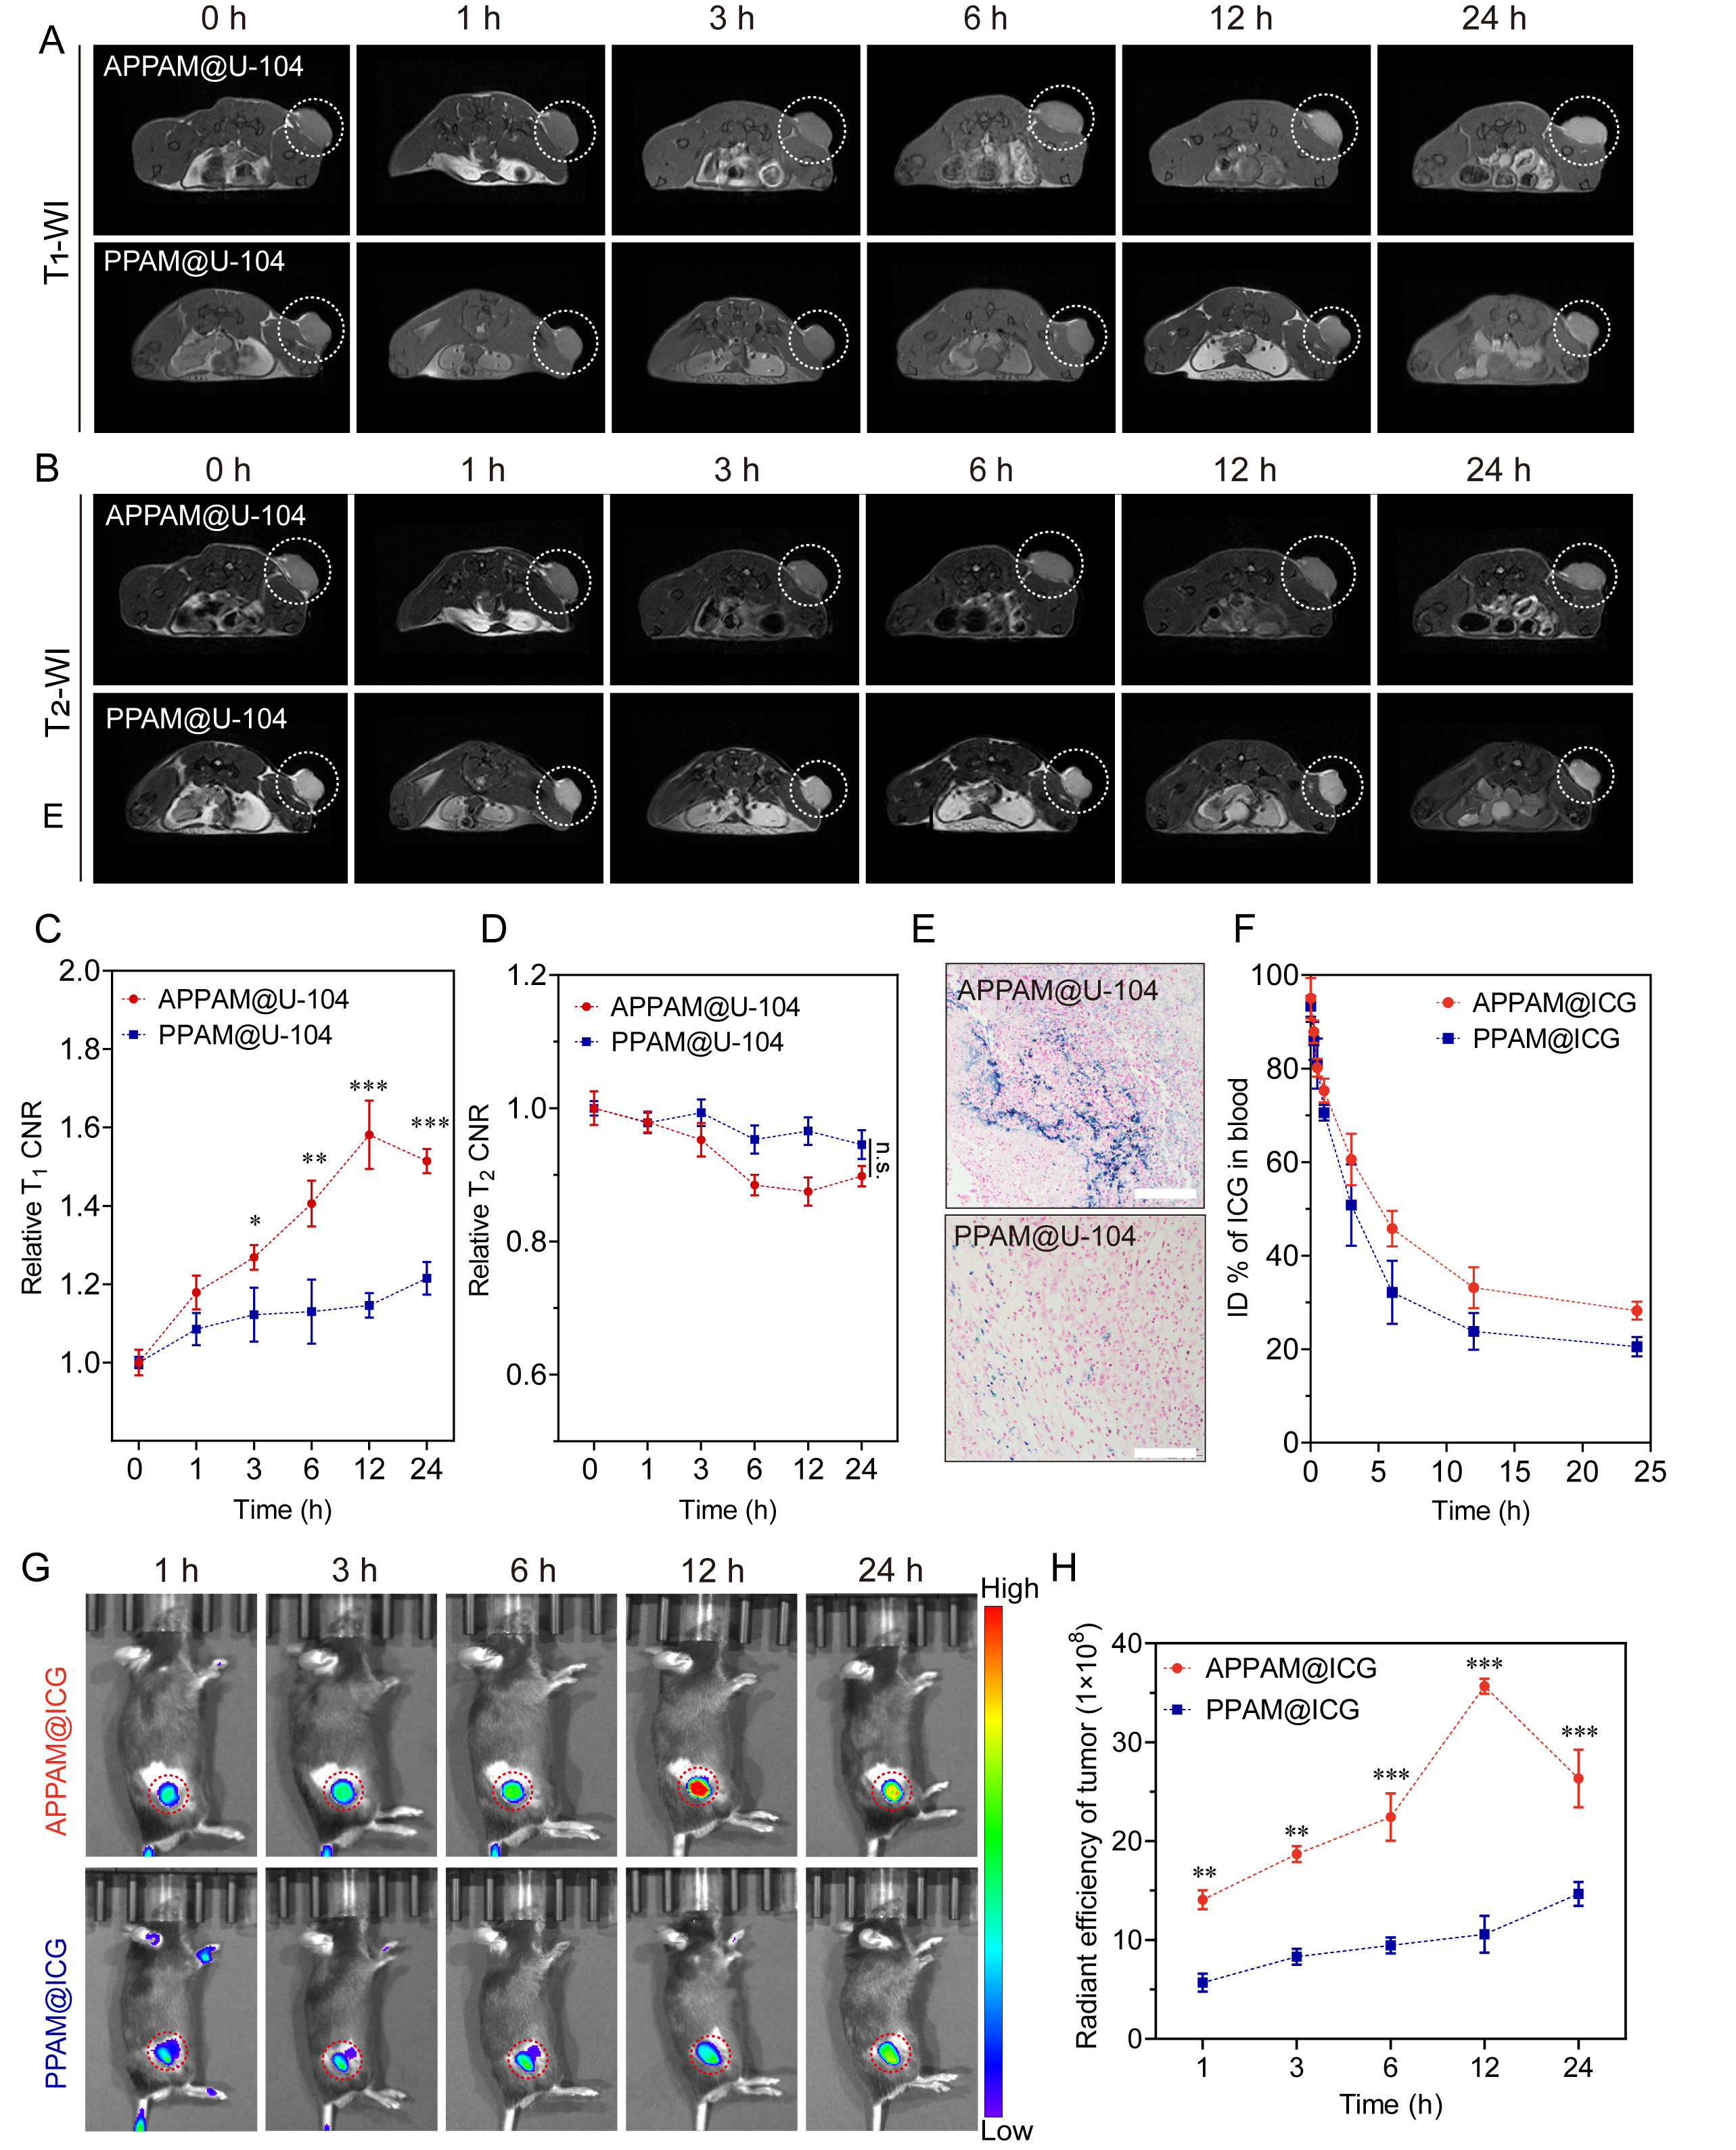
Fig. 3 (A; B) T1-WI and T2-WI images of Panc02 tumor-bearing mice treated with nanoprobes at different times. (C) Semi-quantitative analysis of the relative T1 contrast-noisy-ratio (CNR) and (D) The relative T2 CNR of tumors (E) Tumor tissue sections were stained with Prussian blue staining. (F) Plasma ICG concentration versus time after treated with PPAM@ICG or APPAM@ICG. (G) Biodistribution imaging of tumor-bearing mice with APPAM@ICG or PPAM@ICG injection at various timepoints.(H) Average fluorescence intensity of ICG in the tumor over time.
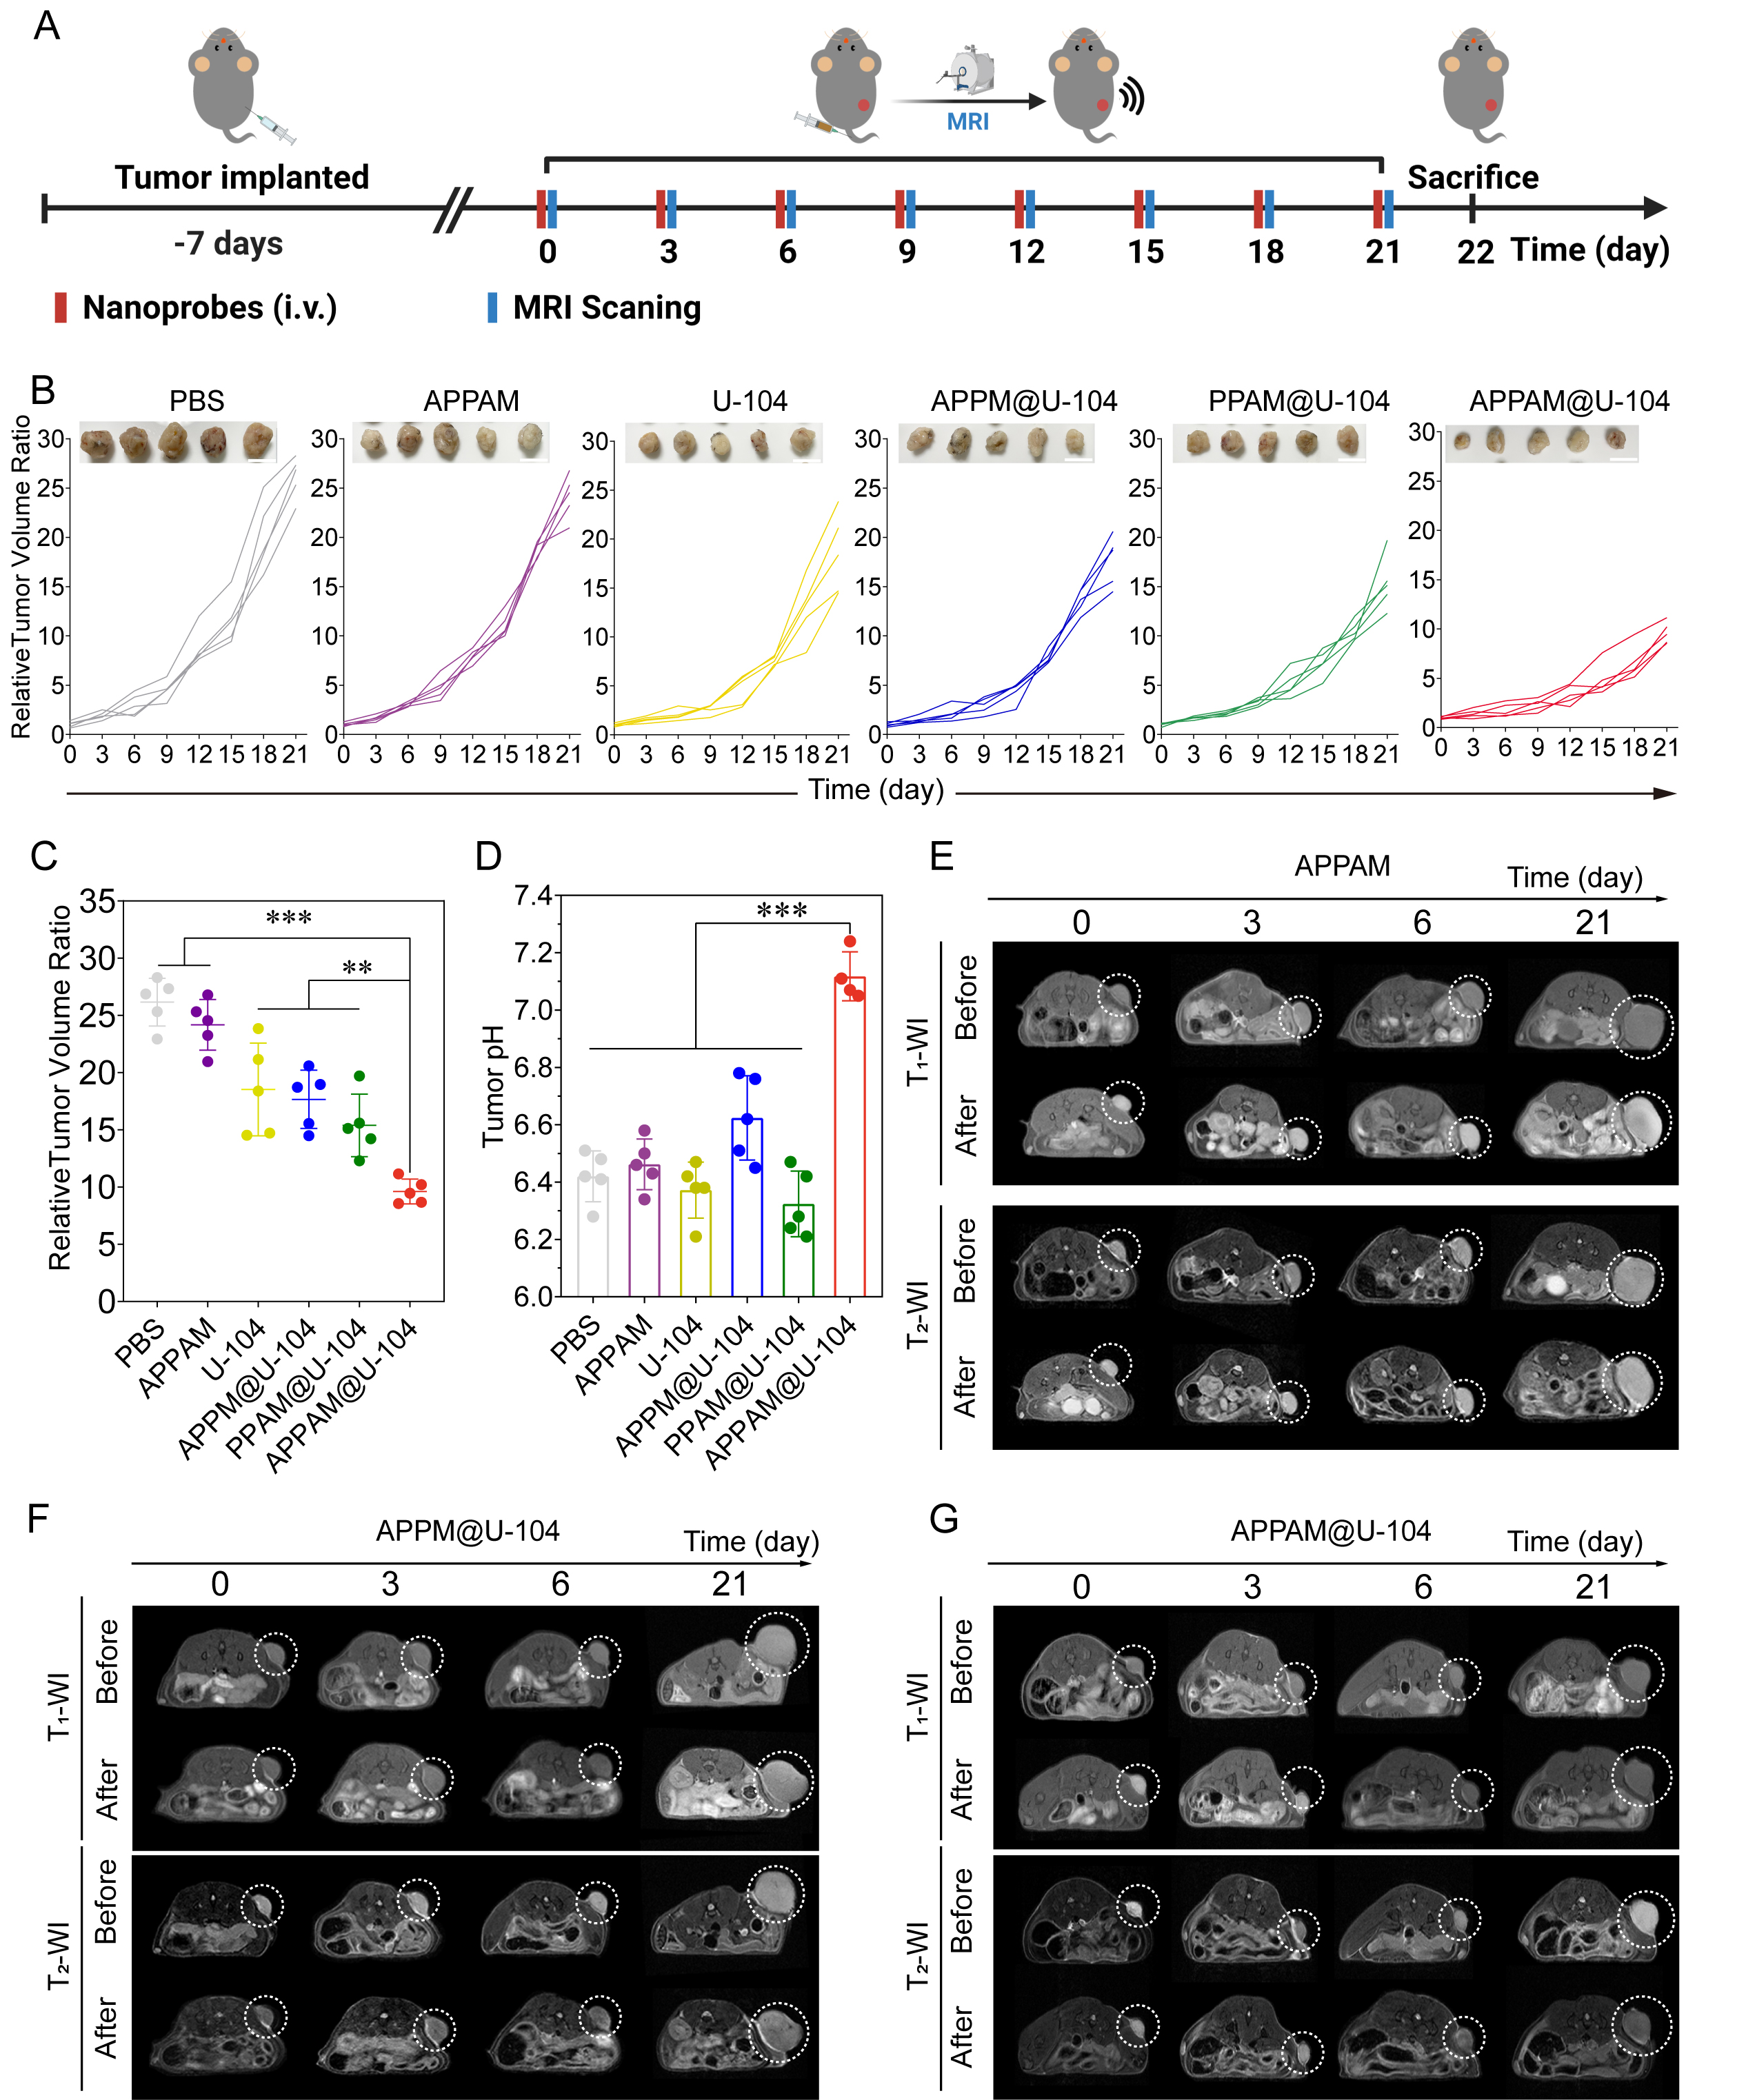
Fig. 4 (A) Time schedule of treatment and MRI monitoring program. (B; C) Relative tumor growth rates and corresponding ex vivo images of subcutaneous Panc02 tumors in mice that received different formulations. (D) The pH value of the Panc02 tumor tissues measured by needle-type pH microelectrode. (E-G) The T1 and T2-WI images of Panc02 tumor-bearing mice were acquired before and after intravenous injection of different formulations at timepoints.
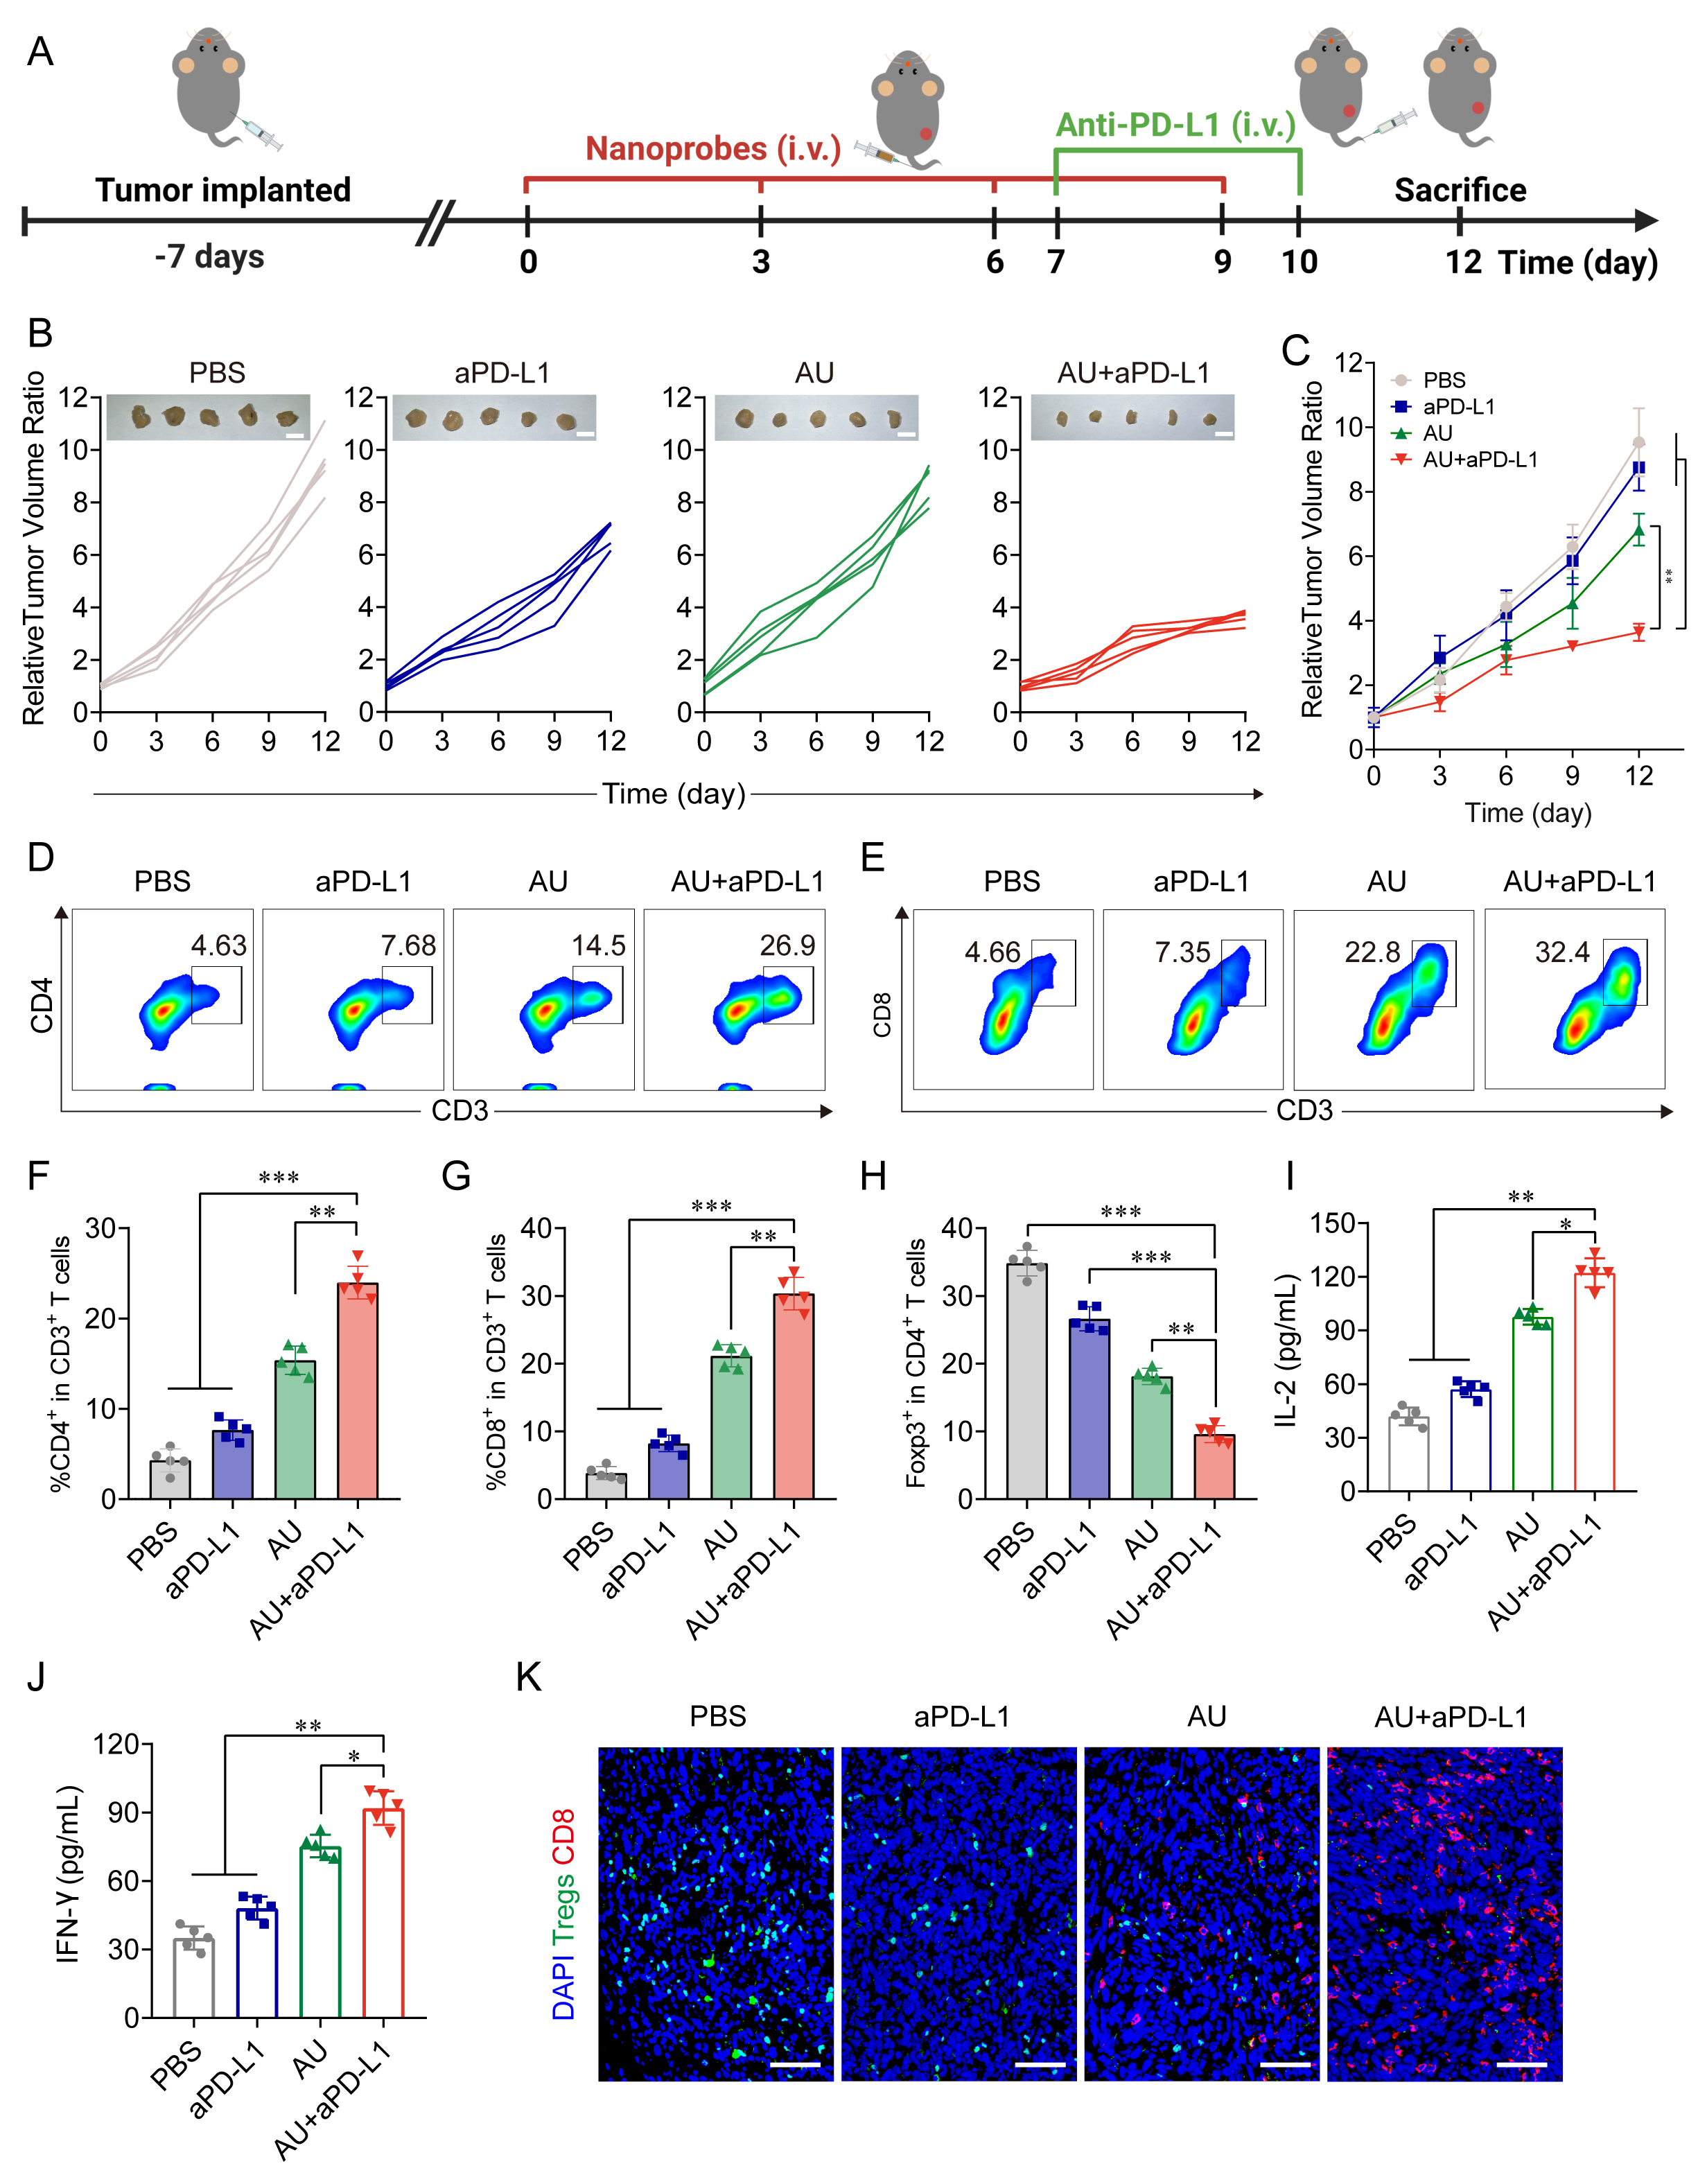
Fig. 5 (A) Treatment regimen in mice bearing Panc02 tumors. (B) Image of ex vivo Panc02 tumors and relative tumor growth curves. (C) The relative tumor growth. (D; E) Representative flow cytometry analysis of intratumoral infiltration of CD4+ and CD8+ positive T cells . (F-H) Average ratios of tumor-infiltrating CD4+ T cells (F), CD8+ T cells (G) and Tregs (H) in tumors. (I; J) The immune cell cytokines of IFN-γ and IL-2 in mice serum were detected by ELISA . (K) Infiltration of CD8+ T cells (red) and Foxp3+ T cells (green) in tumor tissues determined by immunofluorescence staining.