0168
Metabolic detection of BTK inhibition in mantle cell lymphoma models1University of Pennsylvania, Philadelphia, PA, United States, 2Fox Chase Cancer Center, Philadelphia, PA, United States, 3Advanced Imaging Research, Inc., Cleveland, OH, United States
Synopsis
Keywords: Biology, Models, Methods, Cancer, BTK inhibition, mantle cell lymphoma models, early metabolic biomarker of response, 1H MRS with slice selective double frequency Hadamard Selective Multiple Quantum Coherence transfer pulse sequence, STEAM pulse sequence
Motivation: The current approaches to assess Bruton’s kinase inhibitor (BTK) therapeutic effects in cancer are not ideal.
Goal(s): Employing metabolic imaging, we evaluated the mode of action of ibrutinib (IBR), a BTK inhibitor, in mantle cell lymphoma (MCL) cells and xenografts.
Approach: Our approach using 1H MRS demonstrated that, in sensitive MCL models, IBR significantly impacted critical metabolic pathways, including glycolysis, glutaminolysis, and phospholipid metabolism, but had far less of an impact on IBR-poorly responsive cells.
Results: Changes in 1H MRS detectable lactate, alanine, and choline concentrations on various MCL models emerged as promising biomarkers of response or resistance to IBR.
Impact: Decreased intra-tumoral concentrations of lactate, alanine, and choline measured by 1H MRS during treatment can potentially become early and sensitive biomarkers of BTK inhibition in MCL and, likely, other lymphoma treatments.
Introduction
Bruton’s tyrosine kinase (BTK) inhibitors are therapeutic agents for lymphomas, including mantle cell lymphoma (MCL). FDG PET/CT imaging is used to determine staging and tumor burden to assess treatment response in lymphomas. However, inhibitors of BTK and other kinases are often more cytostatic than cytotoxic, producing delayed tumor burden changes and thus initially appearing as not responding on the FDG PET/CT scan. Therefore, there is a critical need to develop methods to detect responses to kinase inhibitors early during BTK inhibition therapy. To address this issue, we use noninvasive 1H MRS techniques to monitor the early metabolic changes induced by IBR therapy in vitro and in vivo in MCL-derived cell lines xenotransplanted into mice with diverse response levels to IBR.Materials and Methods
MCL cells (MCL-RL, REC-1, JeKo-1 and MCL-SL) were grown as described elsewhere.1 The cell line's identity was established using various methods, including flow cytometry, FISH (Fluorescence in situ hybridization), and short tandem repeat (STR) analyses. In vitro studies: Cell growth inhibition assay was performed after treating the MCL cells with IBR or the vehicle and labeled with MTT (Promega) as described elsewhere.1 Oxygen consumption and extracellular acidification rates were determined using the Seahorse XF-96 Extracellular Flux Analyzer in the presence or absence of IBR. Glucose and lactate concentrations were measured using YSI 2300 STAT Plus Glucose & Lactate Analyzer under similar conditions. High-resolution 1H MRS experiments were performed on a 9.4 T vertical bore Varian spectrometer as described elsewhere.1 In vivo studies: Ten million cells of each MCL cell were subcutaneously injected with matrigel in NSG mice. Tumor tissues from donor NSG mice were incubated in primocin for an hour before being washed and resuspended in PBS with 2% FBS. PDX tumor tissues measuring 1×1×1 mm3 (five to ten pieces) suspended in 0.2 ml of matrigel were implanted subcutaneously in a larger cohort of male athymic nude mice. The xenografted MCL tumors were allowed to grow (~250 mm3) for subsequent in vivo, localized 1H MRS exams. In these exams, we use a slice selective double frequency Hadamard Selective Multiple Quantum Coherence (HDMD-Sel-MQC) transfer pulse sequence to detect lactate and alanine and a STEAM (Stimulated Echo Acquisition Mode) pulse sequence for choline detection on a 9.4 T horizontal bore Bruker spectrometer. The in vivo 1H MRS experiments were performed after positioning the subcutaneous tumor in a home-built slotted-tube 1H-resonator. Physiological monitoring was maintained during the experiment. Data acquisition, post processing and parameter estimation were performed as previously described.2 Immunohistochemical staining of the MCL tumor tissues were performed as described elsewhere.3Results
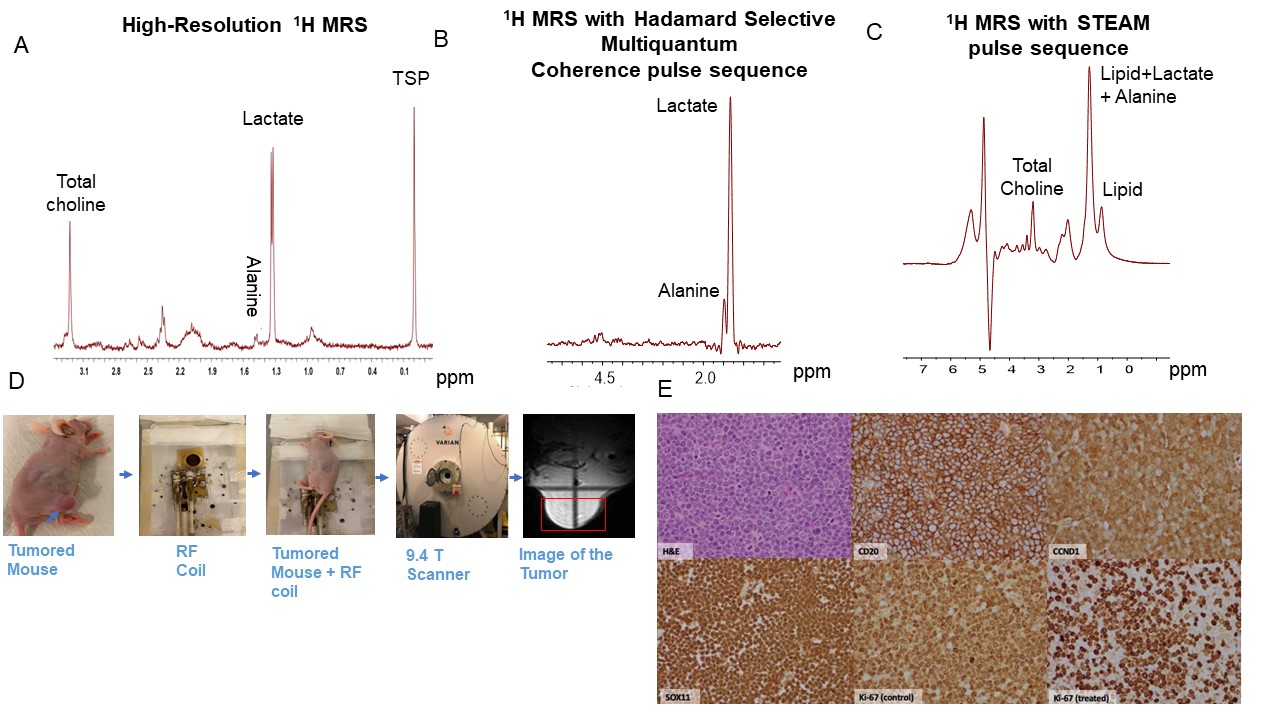
Our metabolic studies showed marked lactate accumulation inhibition by IBR in MCL-RL and REC-1 cell lines, much lesser in JeKo-1, and essentially none in MCL-SL cells, in direct correlation to IBR effect on cell growth (Figs 1 & 2). Similar results were obtained when glycolytic function and mitochondrial respiration were evaluated (data not shown). Furthermore, our in vitro (Fig. 3) and in vivo (Figs 4 and 5 B-D) noninvasive 1H MRS results showed that IBR produced an early and profound inhibition in concentrations of lactate (biomarker of glycolysis), alanine (biomarker of amino-acid metabolism) and, to a lesser degree, choline (biomarker of membrane metabolism) in the IBR-sensitive MCL-RL and REC-1 tumors and less-pronounced inhibition in JeKo-1 tumors (Figs 3-5). Conversely, tumors generated from the IBR-resistant SL cells showed no significant inhibition of the metabolic biomarkers. The effect of BTK inhibition on tumor growth was confirmed by immunostaining of resected tumors. The cell-proliferation marker, Ki-67, showed a significant drug-induced decrease in the tumor cell proliferative index when the IBR (treated) vs. drug-vehicle exposure (control) were compared (Fig 5E).Discussion
The central role of BTK in the B-cell receptor (BCR)-driven cell signaling pathway in normal and malignant B lymphocytes is well-established. Based on the known metabolic control exerted by the BCR/BTK pathway, our results further assess the role of BTK on metabolomics. They also demonstrate the BTK inhibition effect on specific metabolite levels and their correlation with response to treatment in isolated MCL cell lines and tumors xenotransplanted from these cell lines. Whereas the BTK inhibition impairment of the MCL's proliferation rate and cell cycle progression observed in our study is due to reduced supply of DNA nucleotides directly preventing DNA synthesis needs to be elucidated.Conclusions
We identified index metabolites impacted by BTK inhibition that are dependable, sensitive, and early biomarkers of the successful inhibition. Given that these metabolites are detectable using a noninvasive 1H MRS-based tumor imaging exam, it demonstrates the translational implications of these noninvasive metabolic biomarkers secondary to the BTK-driven regulation of cell metabolism.Acknowledgements
This work was supported in part by grants from National Cancer Institute 1R01CA250102, 1R01CA228457, 1R01CA268601.References
1. Lee SC, Shestov AA, Guo L, et al. Metabolic Detection of Bruton's Tyrosine Kinase Inhibition in Mantle Cell Lymphoma Cells. Mol Cancer Res. 2019;17(6):1365-77.
2. Nath K, Nelson DS, Ho AM, et al. 31P and 1H MRS of DB-1 melanoma xenografts: lonidamine selectively decreases tumor intracellular pH and energy status and sensitizes tumors to melphalan. NMR Biomed. 2013;26(1):98-105.
3. Zhang Q, Basappa J, Wang HY, et al. Chimeric kinase ALK induces expression of NAMPT and selectively depends on this metabolic enzyme to sustain its own oncogenic function. Leukemia. 2023. Epub 20230929. doi: 10.1038/s41375-023-02038-0.
Figures
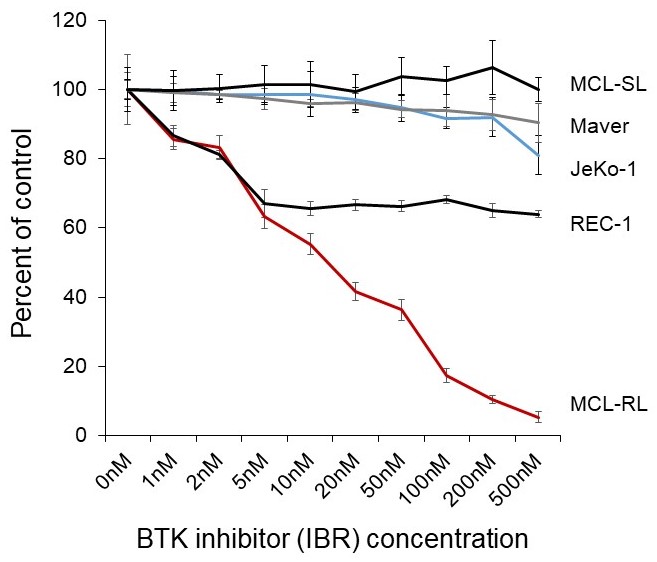
Figure 1. Effect of BTK inhibitor on growth of MCL cells
Results of MTT conversion assay with the depicted five MCL-patient derived cell lines after 72 hour (3 day) incubation in vehicle (DMSO) or various concentrations of IBR ranging from 1 to 500 nmol/L.
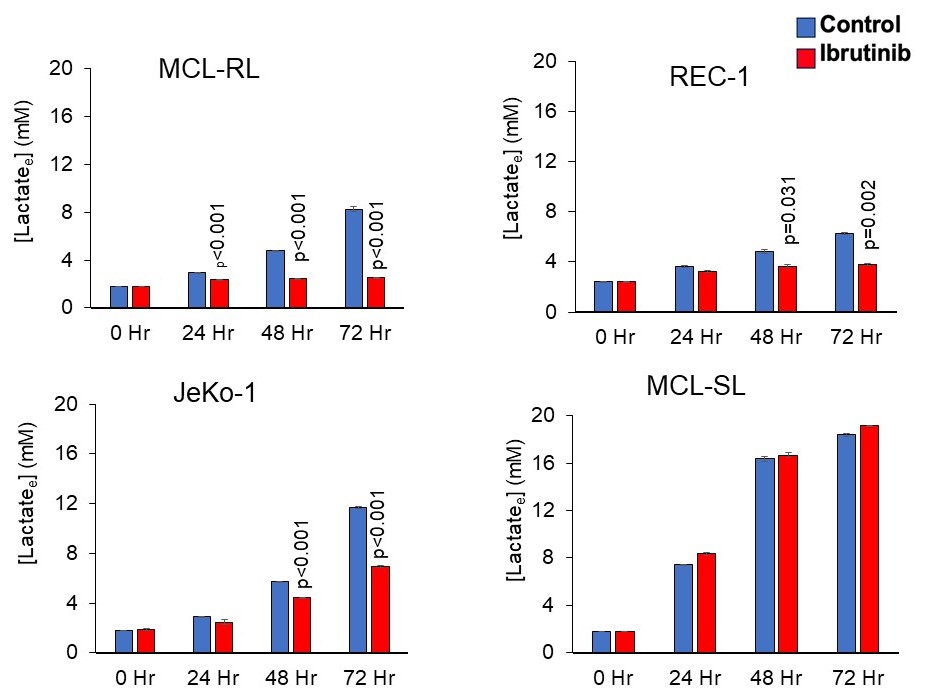
Figure 2. Effect of BTK inhibition on metabolic phenotype
The depicted four MCL cell lines that differ in their sensitivity to BTK inhibition (Fig. 1) were cultured with 500 nM of BTK inhibitor IBR and examined at the indicated time points for extracellular lactate concentration by using a YSI 2300 biochemical analyzer. All experiments were performed in triplicate and the data are presented as mean ± s.e.m. with the p values of statistical significance indicated.
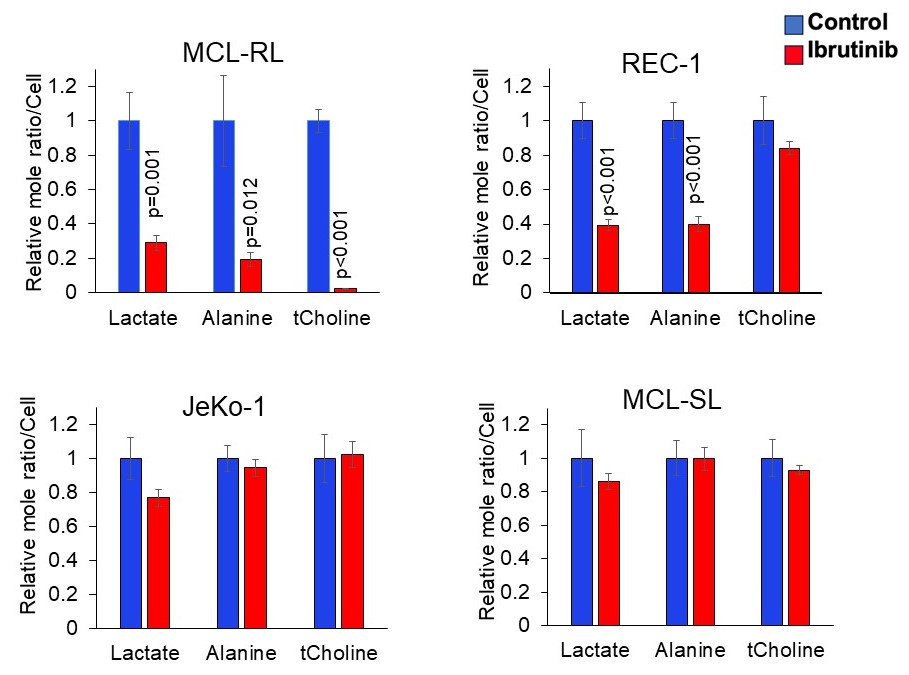
Figure 3. In vitro 1H MRS-detectable biomarkers of BTK inhibition in MCL cells
Impact of BTK inhibition in MCL cells on lactate, alanine, and total choline percent change measured by high-resolution 1H MRS with 500 nM of BTK inhibitor IBR. All data are displayed as mean ± SEM, with the statistically significant p-values of the difference between BTK inhibitor-treated vs. controls also depicted.
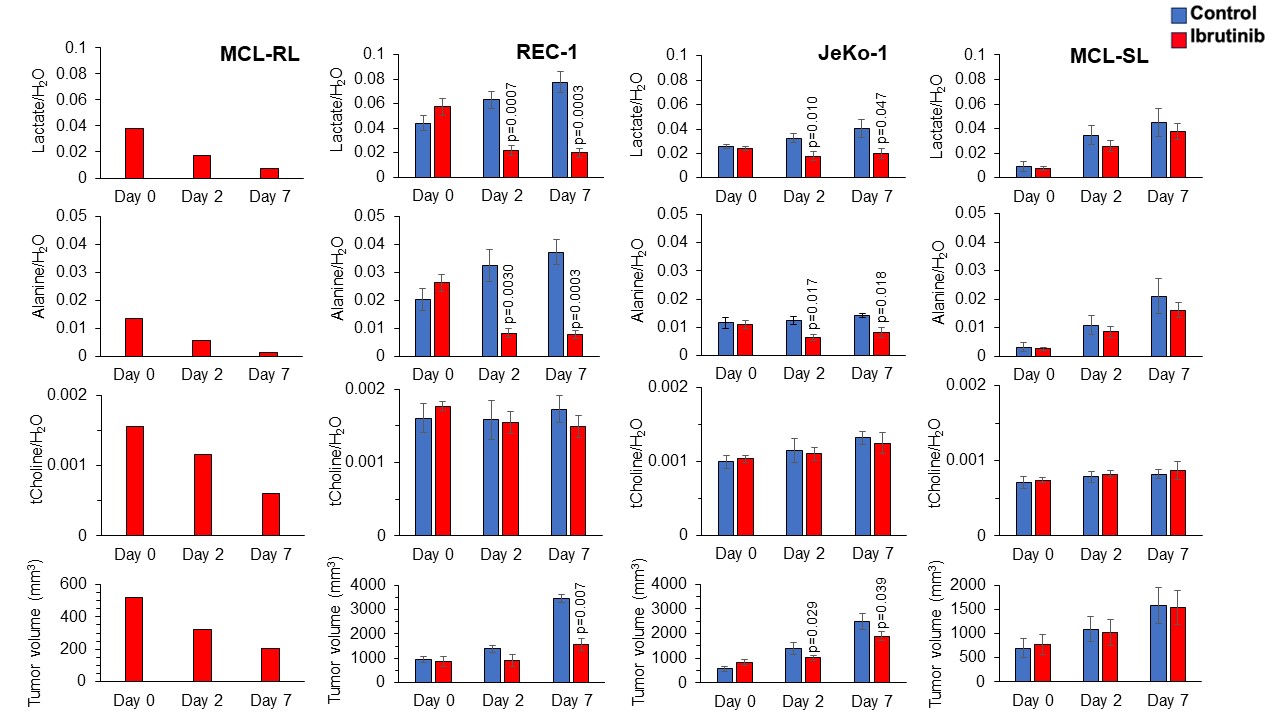
Figure 4. In vivo 1H MRS-detectable biomarkers of BTK inhibition in MCL Xenografts
The spectral peak area of lactate, alanine and choline signals normalized to the water signal measured by 1H MRS with HDMD-Sel-MQC transfer and STEAM pulse sequences, respectively, and tumor volume using calipers after treatment with IBR measured at Day 0, Day 2, and Day 7 in (A) MCL-RL (n=1), (B) REC-1 (n=5), (C) JeKo-1 (n=5) and (D) MCL-SL (n=5) PDXs. IBR was given with the dose of 256 mg/kg, orally, once daily. We have included vehicle treated controls in each MCL PDXs except MCL-RL.