0165
Hyperpolarized 129Xe MRI of the Irradiated Lung using a Chemical Shift Imaging – Chemical Shift Saturation Recovery (CSI-CSSR) Technique1University of Pennsylvania, Philadelphia, PA, United States, 2University College London, London, United Kingdom
Synopsis
Keywords: Small Animals, Hyperpolarized MR (Gas), RILI, radiation, CSSR
Motivation: Chemical shift saturation recovery (CSSR) measurements are incredibly useful for quantifying pulmonary gas exchange and uptake; because CSSR is a spectroscopic technique, however, such measures are only global in nature.
Goal(s): Our goal was to develop an imaging-based technique for spatially-resolving CSSR measurements.
Approach: We demonstrated our technique’s utility in a rodent model of radiation-induced lung injury.
Results: Images of hyperpolarized-129Xe dissolved in the pulmonary membrane (Mem) and red blood cells (RBC) showed higher Mem signal and reduced RBC signal in radiated vs non-radiated lungs. Septal wall thickness (SWT) measurements derived on a quadrant level also revealed elevated SWT in the irradiated region.
Impact: We demonstrated a new imaging technique for regionally quantifying radiation-induced alterations in pulmonary gas exchange and uptake. This study lays the groundwork for future investigations aimed at improving radiotherapy strategies, mitigating radiotoxicity, and treating radiation-associated illness.
Introduction
While direct imaging of hyperpolarized 129Xe (HXe) dissolved in the pulmonary membrane (Mem) and red blood cells (RBC) provides a qualitative picture of gas exchange capacity, it fails to provide quantitative measures1. The chemical shift saturation recovery (CSSR) technique fills this gap by enabling quantitative measures of metrics such as septal wall thickness and gas transit time2 – 4. However, since CSSR is a spectroscopic technique, these measures are only available on a whole-lung basis. Here, we developed a chemical shift imaging-based CSSR (CSI-CSSR) technique to evaluate a rodent model of radiation-induced lung injury (RILI).Methods
All animal studies were approved by the University of Pennsylvania’s IACUC. Four male Sprague-Dawley rats underwent right lung 20 Gy single-fraction irradiation using a small-animal radiotherapy device (SARRP, Xstrahl) before incubation for 6 weeks to allow RILI development. At 6 weeks, animals (470 g ± 30g) were anesthetized, intubated, ventilated using air or HXe gas mixture (21% O2, 79% N2/xenon), and imaged in a 3T horizontal-bore MRI (Bruker BioSpec). Enriched HXe was manufactured in 1.5L batches using a prototype commercial optical pumping system (XeBox-E10, Xemed LLC, NH). A chemical shift imaging sequence was modified to employ a dissolved-phase saturation pulse, fixed delay time, and dissolved-phase/gas-phase (DP/GP) excitation pulse + data readout, as common in CSSR sequences2—4, prior to each phase-encode. Entire lines of k-space were acquired during breath-holds of 2-6 s, with four HXe breaths administered between breath-holds to ensure adequate signal for each acquisition set. For a matrix size of 16×16, each image required 16 breath-holds to complete. Images were acquired using one of seven delay times: {2.5, 10, 20, 50, 75, 150, 300 ms}. The inherent delay time is 1.14 ms longer than the nominal delay time when accounting for pulse durations and post-DP saturation spoilers. Other imaging parameters were as follows: FOV = 50×50 mm2, TE = 0.34ms, spectral points = 1578, sampling duration 31.56 ms, Gaussian pulse shape, FA = 90°, pulse duration = 0.913 ms and 0.4 ms for DP-only and GP-DP excitations, respectively.Images were reconstructed offline using custom-developed software in MATLAB (Natick, MA). 700 FID points were used for DP image reconstruction to limit noise, while all points were used for GP images. FIDs were apodised and zero-filled by a factor of two. Spectra were phased and Mem, RBC, and GP images were created by summing the area under their respective peaks. Septal wall thickness (SWT) measurements were extracted on a quadrant basis by fitting Mem:GP signals to the Patz HXe diffusion model5.
Results
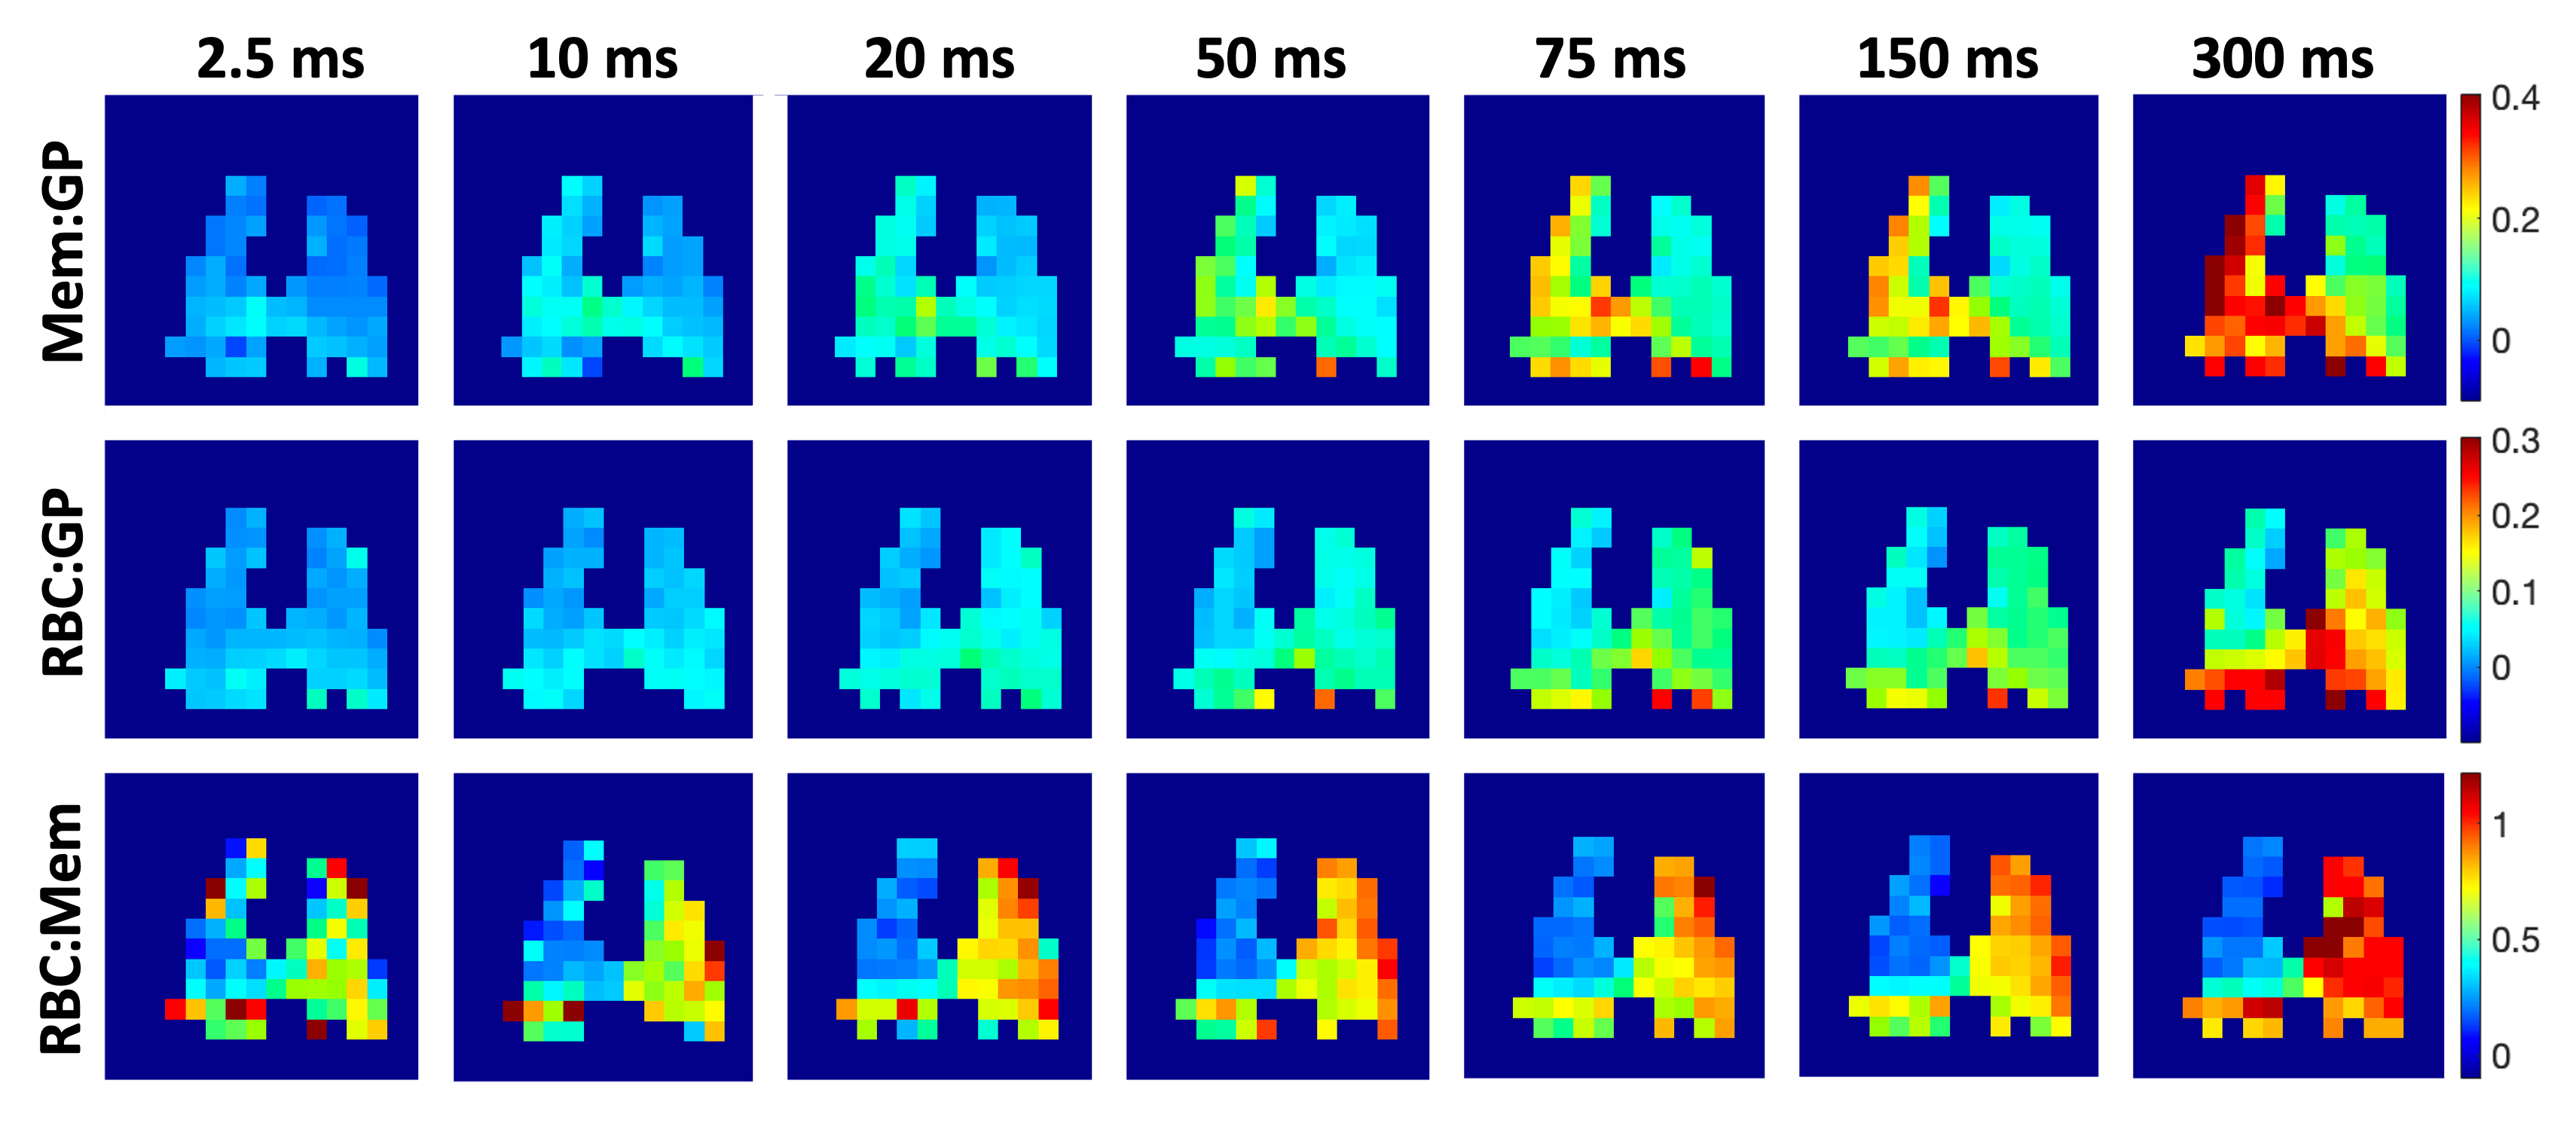
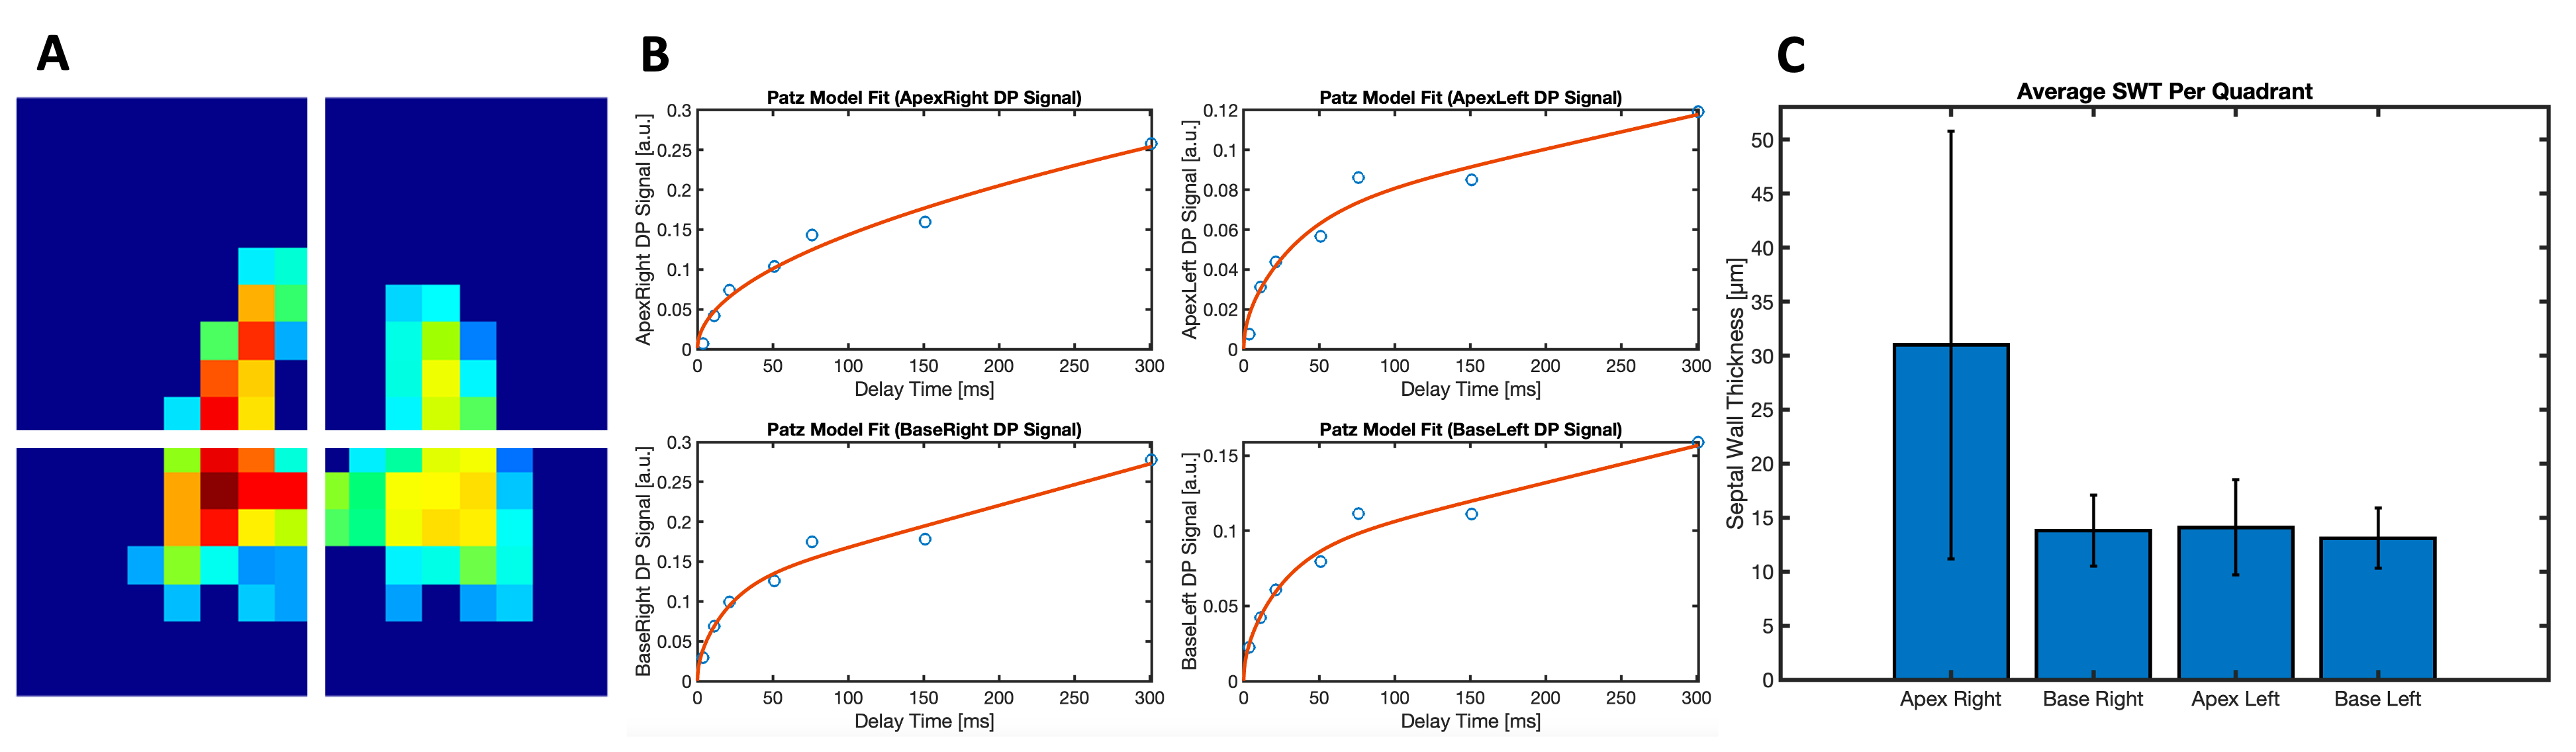
Figure 1 shows representative Mem:GP, RBC:GP, and RBC:Mem ratio maps for all delay times; the color scale is fixed for each row to emphasize the accumulation of HXe in each DP compartment. Figure 2A shows images partitioned into quadrants, whose Mem:GP ratios are summed and subsequently fit to the Patz model (Fig. 2B). Figure 2C shows the average SWT for each quadrant for all animals.Discussion
This work contributes to already existing HXe studies in animal models of RILI3,4,7. Average SWT values appear elevated in the right apex of the lung but appear very similar across the remaining quadrants despite entire right-lung irradiation. We can attribute this behavior to both a limitation in our irradiation methodology and instability in our model fitting; while this CSI-CSSR technique is a significant improvement upon traditional spectroscopic CSSR measures due to the fact that we can spatially resolve HXe exchange and uptake dynamics, the low signal-to-noise and limited number of delay times—especially at early delay times—significantly skews our SWT measurements in the presence of any deviations in our Mem:GP uptake curve. This issue is exacerbated when fitting to Mem:GP signal on a pixel-by-pixel level, leading us to omit such analysis here.Nevertheless, the ratio maps in Figure 1 show clear differences between radiated and non-radiated lungs that are consistent with known RILI pathophysiology6: elevated Mem:GP values in the radiated lung, indicative of tissue thickening, along with reduced RBC:GP and RBC:Mem values in the radiated lung, suggesting destruction of the capillary bed. While an increase in Mem:GP signal in radiated regions mirrors previous findings by Zanette et al.7, we observed a reduction in RBC:GP signal that they did not. This discrepancy may be explained by the different irradiation volumes or incubation periods used in our study.
Conclusion
This study demonstrates the first-ever application of a CSI-CSSR sequence in a rodent model of RILI; the functional maps produced proved capable of distinguishing between radiated and non-radiated lung regions.Acknowledgements
This work was funded by the NIH Project Number R01HL142258-04. We also would like to give special thanks to the University of Pennsylvania’s Cell and Animal Radiation Core for help in creating the RILI model.References
1. – Mammarappallil, Joseph G., et al. "New developments in imaging Idiopathic Pulmonary Fibrosis with hyperpolarized Xenon MRI." Journal of thoracic imaging 34.2 (2019): 136.
2. – Ruppert, Kai, et al. "Detecting pulmonary capillary blood pulsations using hyperpolarized xenon‐129 chemical shift saturation recovery (CSSR) MR spectroscopy." Magnetic resonance in medicine 75.4 (2016): 1771-1780.
3. – Fox, Matthew S., et al. "Detection of radiation induced lung injury in rats using dynamic hyperpolarized 129Xe magnetic resonance spectroscopy." Medical physics 41.7 (2014): 072302.
4. – Li, Haidong, et al. "Quantitative evaluation of radiation‐induced lung injury with hyperpolarized xenon magnetic resonance." Magnetic resonance in medicine 76.2 (2016): 408-416.
5. – Patz, Samuel, et al. "Diffusion of hyperpolarized 129Xe in the lung: a simplified model of 129Xe septal uptake and experimental results." New Journal of Physics 13.1 (2011): 015009.
6. – Hanania, Alexander N., et al. "Radiation-induced lung injury: assessment and management." Chest 156.1 (2019): 150-162.
7. – Zanette, Brandon, et al. "Detection of regional radiation-induced lung injury using hyperpolarized 129Xe chemical shift imaging in a rat model involving partial lung irradiation: Proof-of-concept demonstration." Advances in radiation oncology 2.3 (2017): 475-484.
Figures