0164
Sustained Tumour Response to Repeated STING Activation Assessed by Diffusion Weighted MRI1Radiotherapy and Imaging, The Institute of Cancer Research, London, United Kingdom, 2Boehringer Ingelheim Pharma GmbH & Co. KG, Biberach, Germany, 3Boehringer Ingelheim RCV GmbH & Co KG, Vienna, Austria
Synopsis
Keywords: Biology, Models, Methods, Cancer, Biomarker
Motivation: Cancer immunotherapy with cyclic GMP-AMP synthase (cGAS)-stimulator of interferon gene (STING) agonists aims to generate an immune response by T cell priming, activation and infiltration into the tumour microenvironment leading to cell death.
Goal(s): The clinical development of STING agonists would benefit from imaging biomarkers that inform on intratumoural pharmacodynamics and potentially anti-tumour response.
Approach: Longitudinal diffusion-weighted MRI in a thyroid xenograft model indicated sustained increase in ADC as an imaging biomarker of tumour microenvironment changes following treatment with a STING agonist.
Results: The potential use of MRI as an indicator of early STING pathway related pharmacodynamic effects in situ is demonstrated.
Impact: Increased ADC is a sensitive, clinically-translatable imaging biomarker of tumour response to a STING agonist.
Introduction
Cancer immunotherapy aims to generate or augment an immune response through potentiating T lymphocyte-mediated anti-tumour adaptive immunity. Tumour-infiltrating lymphocytes correlate with favourable prognosis in diverse malignancies and predict for a positive clinical outcome in response to several immunotherapy strategies. However, immune checkpoint inhibitors have typically failed to elicit marked and durable tumour responses in the majority of patients1.Pharmacological activation of the cytoplasmic DNA-sensing cyclic GMP-AMP synthase (cGAS)-stimulator of interferon genes (STING) pathway is being exploited to enhance tumour responses to immuno-oncology agents. Administration of STING agonists leads to T cell priming, activation and infiltration into the tumour, and ultimately tumour cell death2.
The clinical development of STING agonists would benefit from imaging biomarkers that could inform on intratumoural pharmacodynamic changes upon STING agonist therapy. We recently identified increased ADC as a sensitive, early imaging biomarker of response in the tumour 24hrs after a single dose of a STING agonist, the increased ADC being spatially associated with histologically-confirmed tumour cell death3. Treatment with a well-tolerated dose resulted in diverse temporal ADC responses, with some mice responding slowly over the experimental time frame. In this study we tested the hypothesis if consecutive dosing of the STING agonist administered repeatedly would elicit a sustained tumour ADC response.
Methods
Murine TBPt-4C4 thyroid cancer cells (2.5x10⁶) were injected subcutaneously into the right flanks of female C57BL/6J mice. MRI was performed when tumours reached ~150–200 mm3. Mice received two intravenous doses of either vehicle alone (n=4) or 7µmol/kg (n=10) STING agonist (Boehringer Ingelheim) administered three days apart (Figure 1). Imaging was performed prior to Dose1, prior to Dose2 (72hrs post-Dose1) and 24hrs-post Dose2.MRI data were acquired from anaesthetised mice (2% isoflurane in air) on a Bruker 7T microimaging system using a 40mm volume coil. Following acquisition of multi-slice T2-weighted RARE (TR/TE=4.5s/36ms) images for tumour localisation, diffusion-weighted spin echo (five b-values: 200-1000s/mm2) images were acquired from central 1mm slices using 1282 matrix and FOV 3cm.
Parametric ADC maps were calculated voxel-wise using in-house software (ImageView, written in IDL), and median values calculated from a region-of-interest encompassing the whole tumour4. Significant changes in ADC were identified using ANOVA with Bonferroni corrections.
Following the final scan, tumours were carefully excised and MRI-aligned FFPE sections were either stained with haematoxylin and eosin (H&E) for cellularity or immunohistochemically processed for cleaved caspase 3 (CC3) for detection of apoptosis. Quantitative pathology of digitised whole tumour sections was performed using using pixel classification in QuPath5.
Results
The two-dose strategy was well-tolerated, with a transient 3% reduction in mouse body weight (cohort median) 24h after each treatment with STING agonist. Whilst the signal intensity in T2-weighted images of control and pre-treatment tumours were relatively homogeneous, areas of hyperintensity were apparent in the STING agonist challenged tumours both 72h-post Dose1 and 24h-post Dose2 (Figure 2). A marked increase in water diffusivity was apparent in most of the STING agonist treated mice 72h-post Dose1, resulting in a significant (p<0.01) cohort increase in tumour ADC. No significant change in tumour ADC was determined in the control group over the experimental time course.
At 24h-post Dose2, tumour ADC either further progressed (n=5), remained static (n=1) or reduced (n=2). Two mice developed tumour ulceration rendering them inappropriate for MRI at 24h-post Dose2. Cohort tumour ADC is not significantly higher at 24h-post Dose2 compared to 72h-post Dose1. However, the cohort tumour ADC at 24h-post Dose2 was significantly (p<0.001) higher than that determined prior to Dose1.
MRI-aligned H&E-stained tumour sections revealed extensive tumour cell death associated with the tumour core 24h-post Dose2 of STING agonist (Figure 3). H&E staining showed an annulus of viable non-tumour tissue at the periphery at this timepoint. Tumour ADC positively correlated with the degree of necrosis and % of CC3 positive cells.
Discussion
We previously showed that a single 7µmol/kg dose of a STING agonist elicited an acute increase in tumour ADC 24h after treatment3. The results herein demonstrate that this increase in water diffusivity persists up to 72h post-treatment, consistent with sustained loss of cell membrane integrity, reduced cell density and increased interstitial space associated with alterations in the tumour environment, such as tumour cell death6.
Our study also shows that the increased ADC can be further enhanced in the majority of mice 24h after a second dose of the STING agonist, with no associated adverse effects on the health of those mice. This highlights the potential use of such pre-clinical MRI investigations to demonstrate tumour target engagement.
Conclusion
Increased tumour ADC is sustained following treatment with a STING agonist.
Acknowledgements
We acknowledge support from Cancer Research UK grant C16412/A27725 and The Barrow Neurological Foundation. This is a research collaboration with Boehringer Ingelheim.References
1. Amouzegar A, et al. STING agonists as cancer therapeutics. Cancers 2021;13(11):2695.
2. Jing W, et al. STING agonist inflames the pancreatic cancer immune microenvironment and reduces tumor burden in mouse models. J ImmunoTher Cancer 2019;7:115.
3. Roy U, et al. Acute tumour response to STING activation assessed with multi-parametric MRI. Proc. Intl. Soc. Mag. Reson. Med. 2023; 31:128.
4. Walker-Samuel S, et al. Robust estimation of the apparent diffusion coefficient (ADC) in heterogeneous solid tumors. Magn Reson Med 2009; 62: 420.
5. Bankhead P, et al. QuPath: Open source software for digital pathology image analysis. Sci Rep 2017; 7, 16878.
6. Galbán CJ, et al. Diffusion MRI in early cancer therapeutic response assessment. NMR Biomed 2017; 30: e3458.
Figures
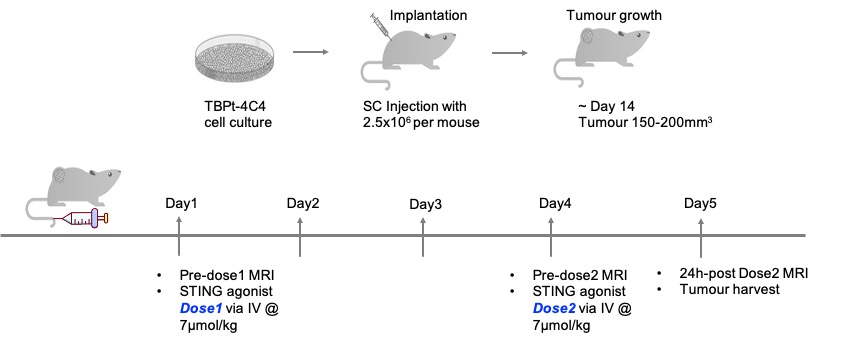
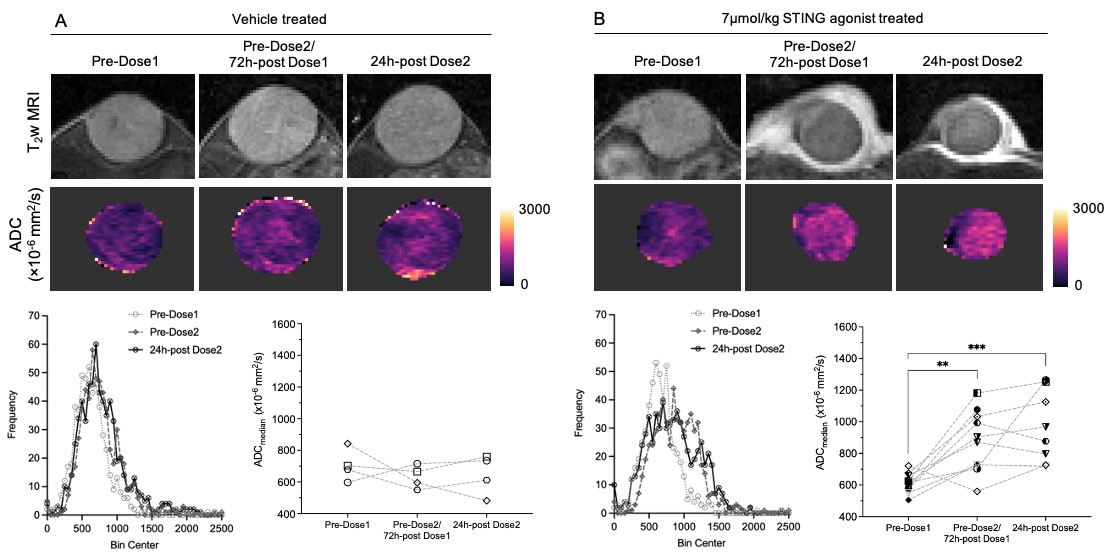
Figure 2: The effect of consecutive doses of STING agonist on water diffusivity in murine TBPt-4C4 tumours. Anatomical T2-weighted images, parametric ADC maps, ADC histograms from representative tumours, and a summary of the longitudinal changes in tumour ADC acquired prior to Dose1, prior to Dose2 and 24h-post Dose2 with (A) vehicle (n=4) and (B) 7µmol/kg (n=10) STING agonist (n=10 for time point 72h-post Dose1; n=8 for timepoint 24h-post Dose2). Data points are median values from individual tumours. **p<0.01, ***p<0.001, ANOVA.
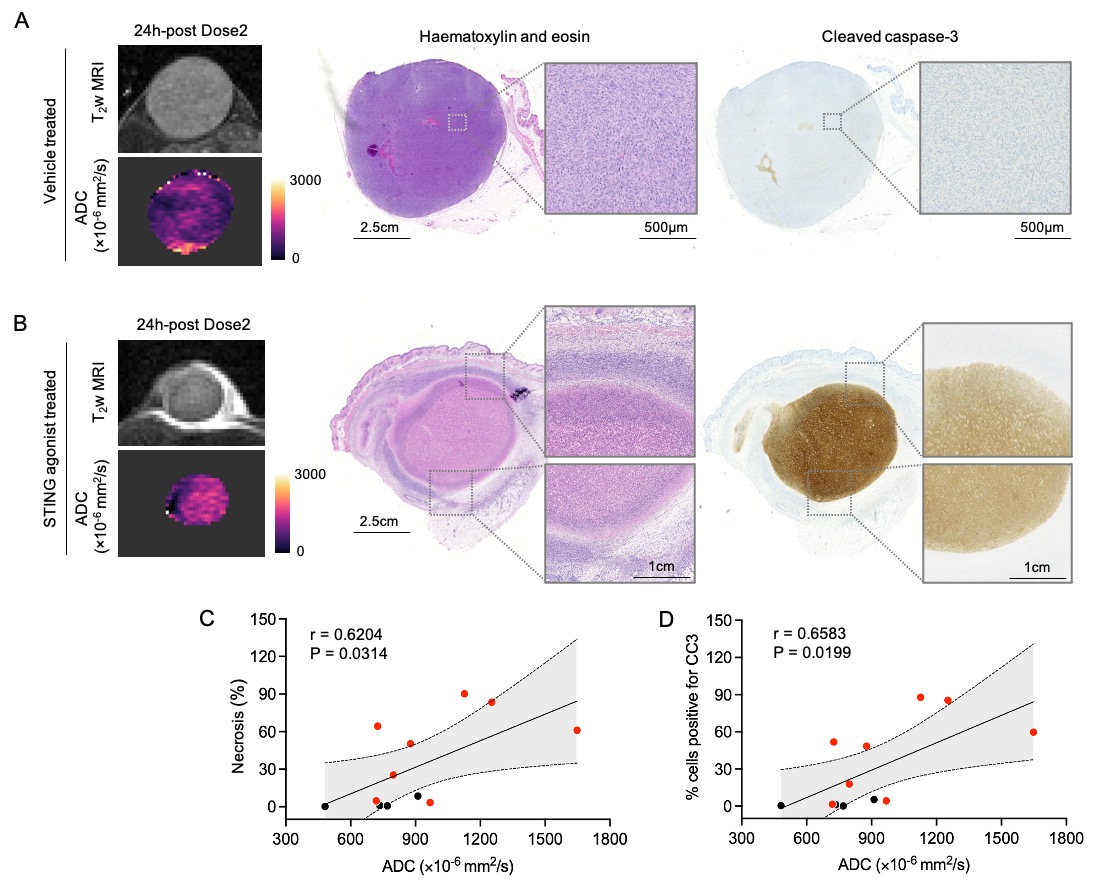
Figure 3: Histological assessment of the effect of consecutive doses of STING agonist in TBPT-4C4 tumours in MRI-aligned tissue sections. Examples of anatomical T2-weighted images and corresponding ADC maps acquired 24h-post Dose2 with either (A) vehicle (black, n=4) or (B) 7µmol/kg STING agonist (red, n=8). Whole section images and high magnification snapshots obtained from MRI-aligned tissue sections stained with H&E and CC3. Tumour ADC positively correlated (Pearson’s correlation coefficient, r) with (C) % necrosis and (D) % cells positive for CC3 quantified using QuPath.