0163
Longitudinal study tracking physiological changes through multiparametric MRI during repeated MRgFUS-induced BBB opening1Image Guided Therapy, Pessac, France, 2Univ. Grenoble Alpes, Inserm U1216, Grenoble Institut des Neurosciences, Grenoble, France, 3Université d’Orléans, CNRS, UPR 4301, Centre de Biophysique Moléculaire, Orléans, France, 4ART ARNm, Inserm UMS55 and University of Orléans, Orléans, France, 5Institut Universitaire de Paris, Paris, France, 6Univ. Grenoble Alpes, Inserm , CHU Grenoble Alpes, CNRS, IRMaGe, Grenoble, France
Synopsis
Keywords: Small Animals, Focused Ultrasound, MR-guided FUS, Multiparametric MRI
Motivation: Long-term delivery of therapeutic agents via repeated MRgFUS is an innovative approach for enhancing glioblastoma treatment but underlying mechanisms are not well documented.
Goal(s): Find the best strategy for long-term drug delivery after multiple MRgFUS mediated BBB opening.
Approach: Repeated MRgFUS treatments were delivered up to 8 sessions over one month along with a multi-parametric MRI protocol follow-up to measure physiological, hemodynamic and oxygenation parameters in order to assess the safety and effectiveness of the procedure.
Results: Intensive, repeated treatments, may lead to tissue modifications that require attention and limit the frequency of ultrasound mediated drug delivery to once a week.
Impact: Long-term delivery of therapeutics through a FUS-induced permeabilized BBB redefines therapeutic strategies as it improves patient outcomes. To ensure the best translation towards clinical treatment, evaluation of hemodynamics and oxygenation modifications in the CNS is necessary to refine treatment parameters.
Introduction
Our study assesses, using a multi-parametric MRI protocol, the cerebral blood flow (CBF), blood volume fraction (BVf), vessel size index (VSI), oxygen saturation (SO2), water apparent diffusion coefficient (ADC) in order to evaluate the bioeffects of repeated blood-brain barrier (BBB) opening using FUS. BBB permeability was assessed using a dynamic contrast enhanced sequence (DCE). The Area Under the Curve (AUC) was used as a reporter of BBB permeability.Method
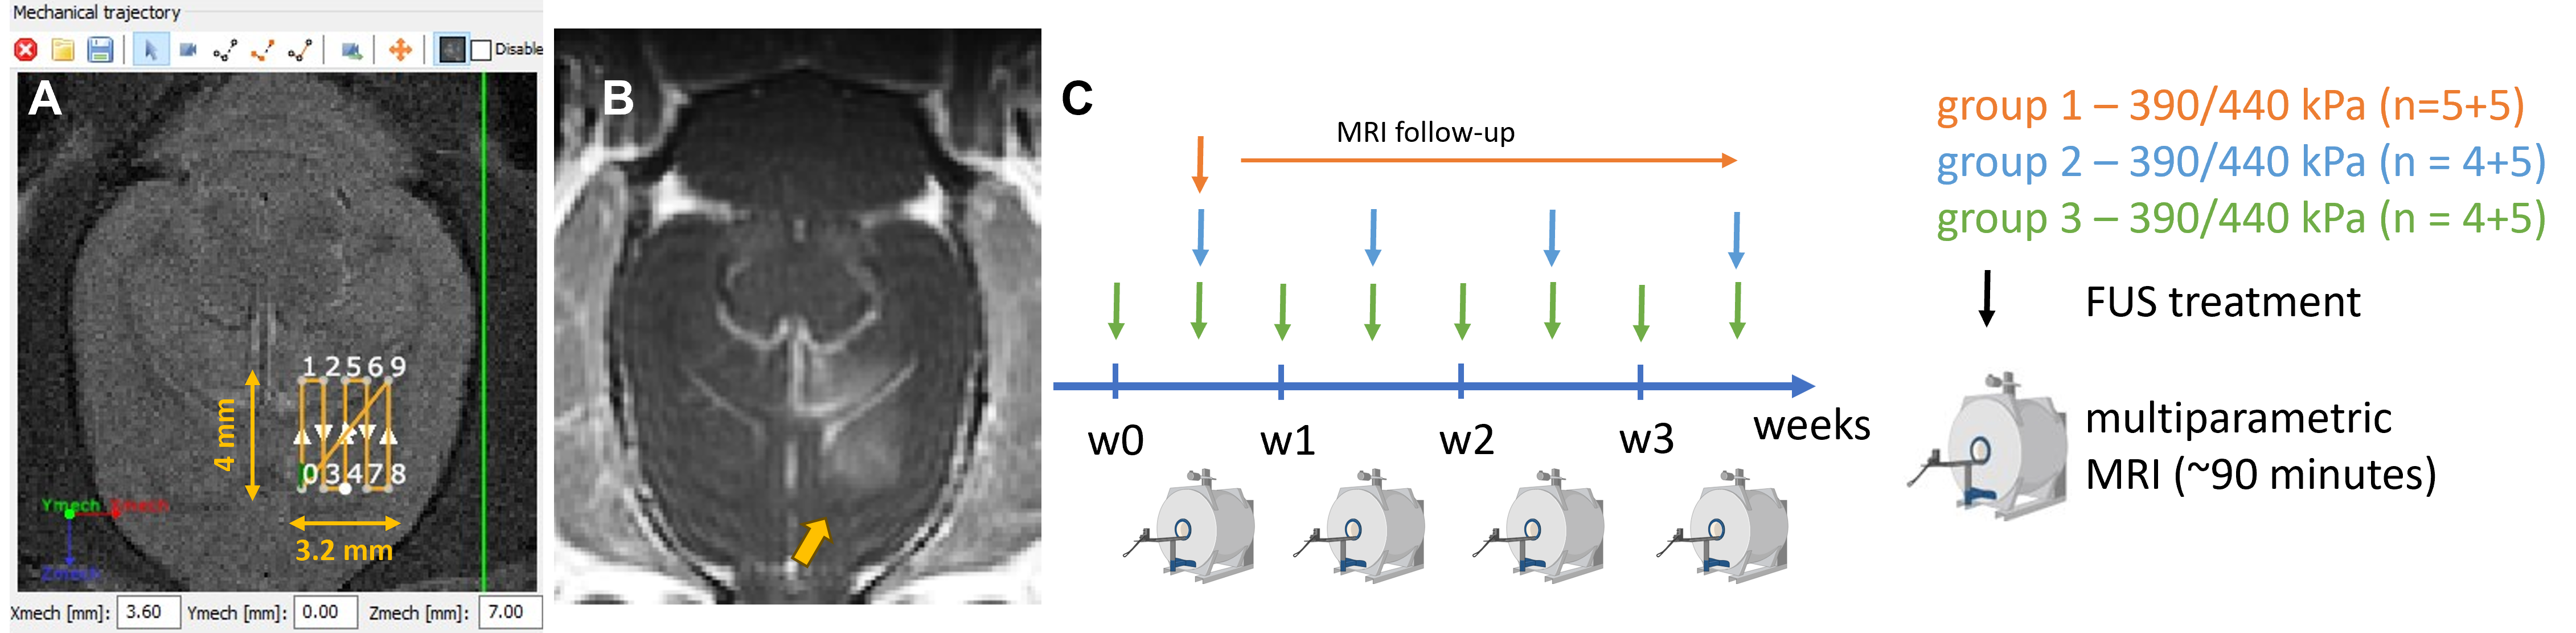
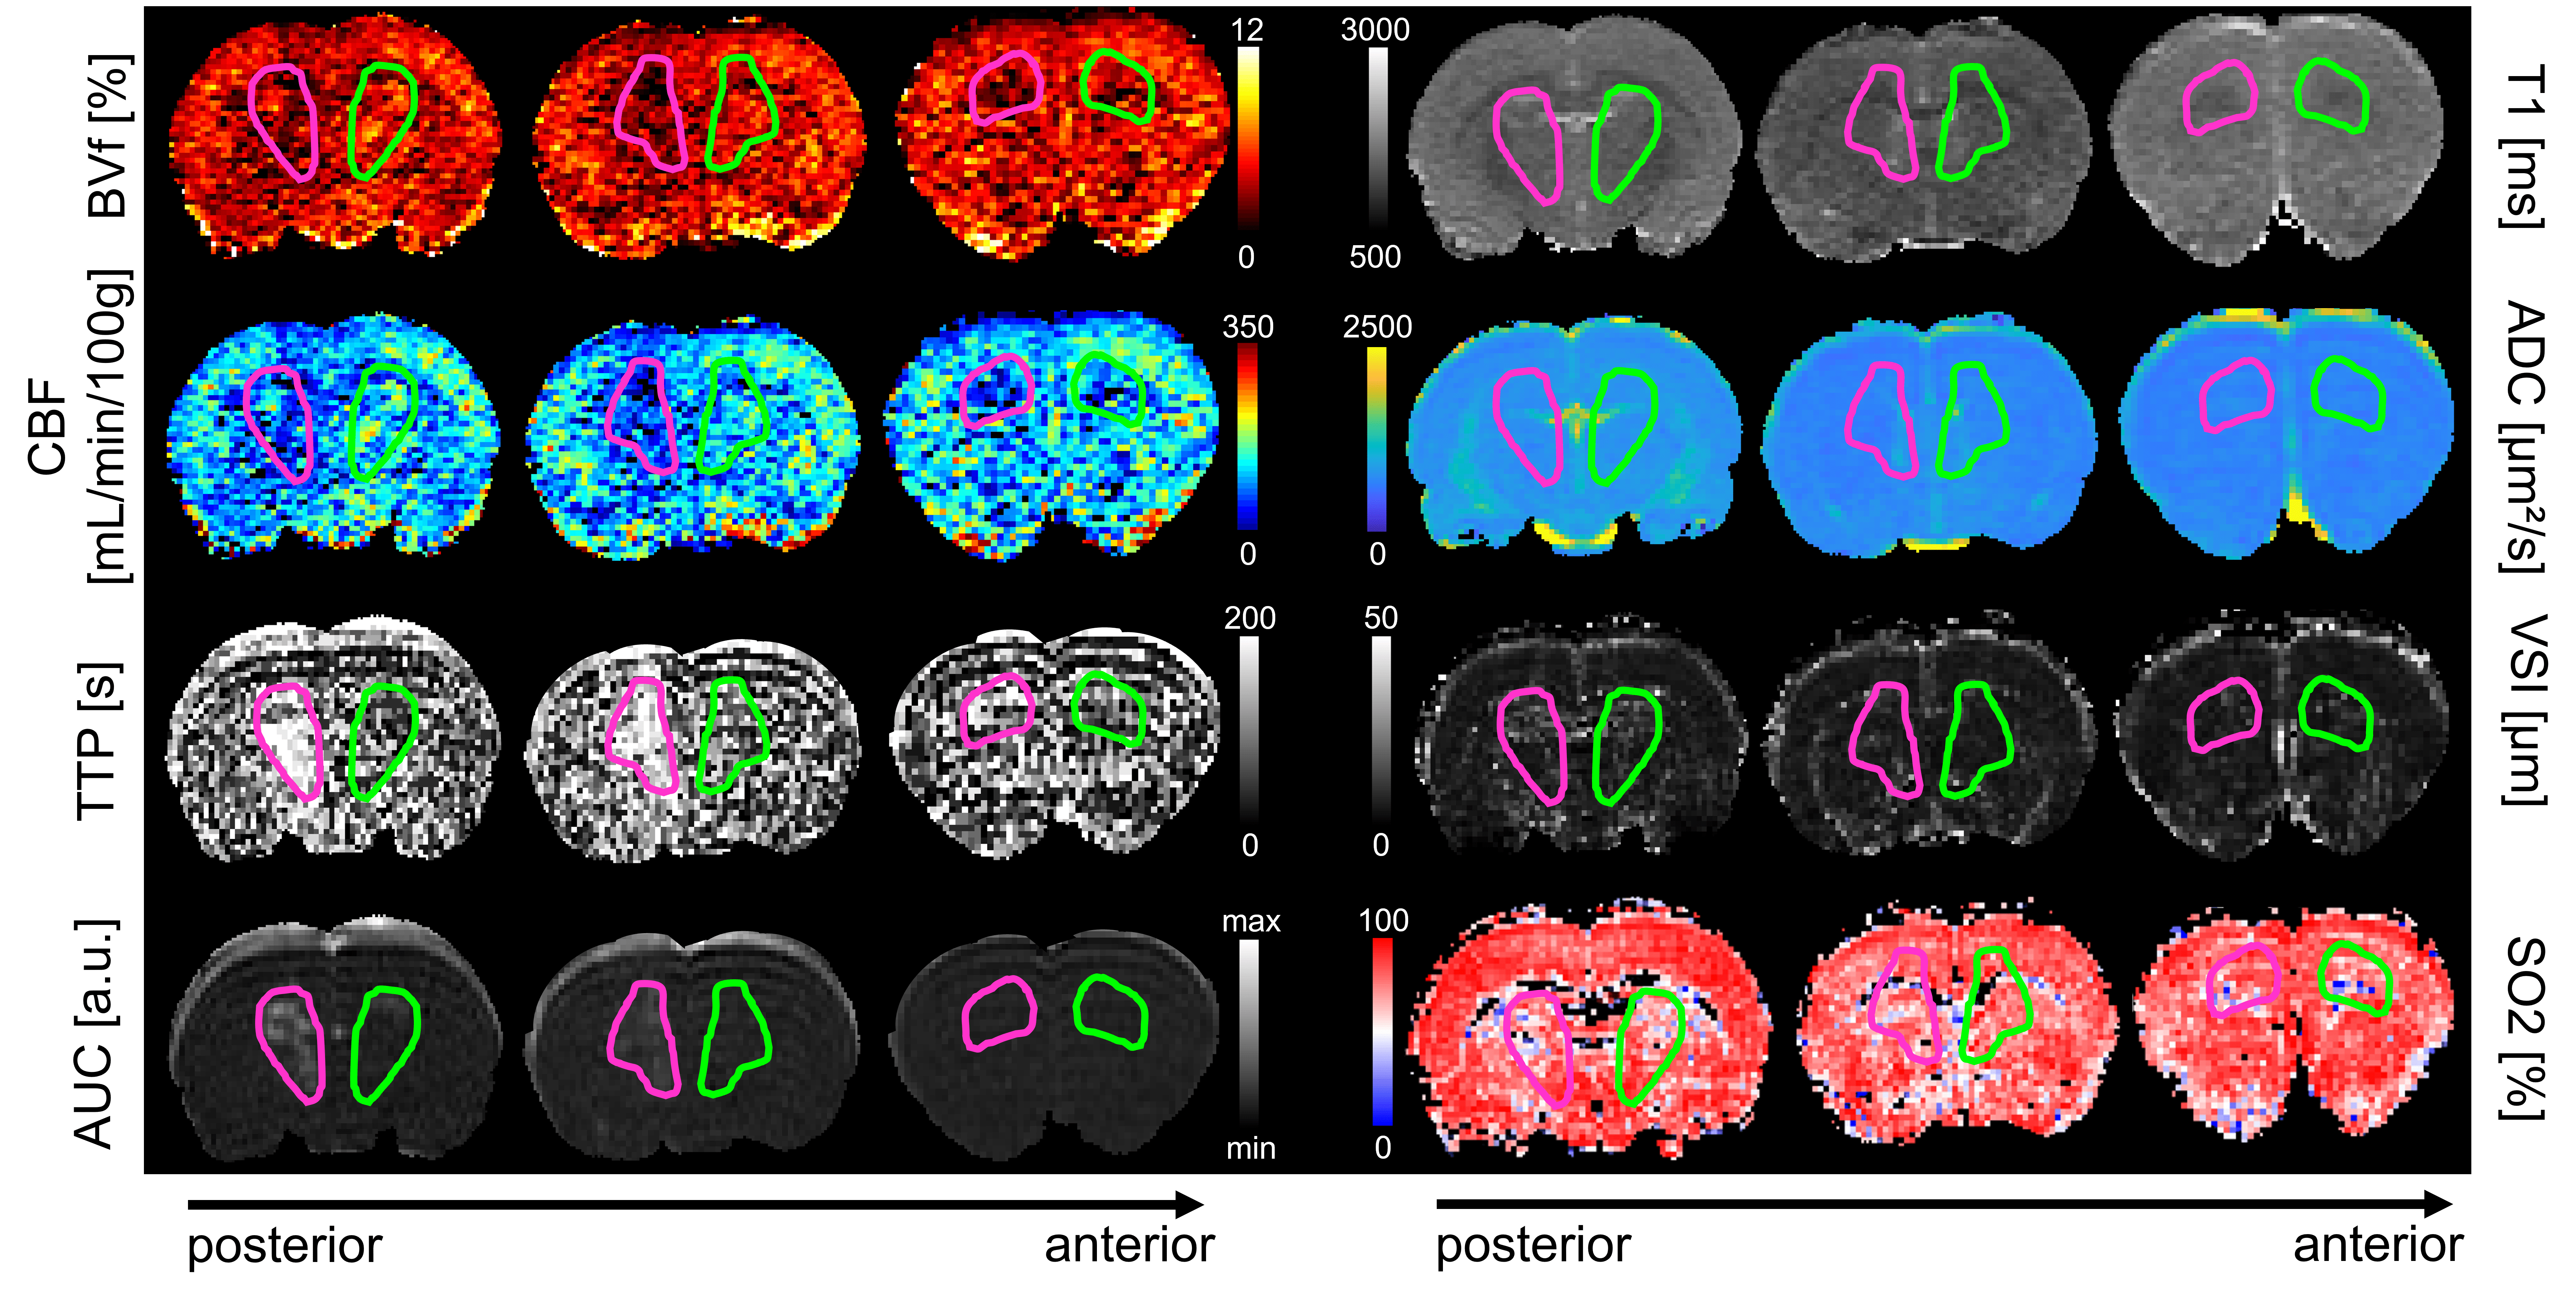
BBB was permeabilized in subcortical regions repeatedly with MR-guided FUS on Wistar rats during 4 weeks either once or twice a week. A control group received a single FUS exposure and was monitored during 4 weeks (Fig.1). We opened the BBB with homemade lipidic microbubbles (1.5E8 MB) followed by a raster scan of 4x3.2mm² with continuous 1.5MHz ultrasound pulses. The 7-concentric elements transducer was moving at a speed of 10mm/s1 during 40s. Two pressures were tested in order to deliver 390kPa and 440kPa peak negative pressure in situ2. A multi-parametric MRI protocol3 was acquired just after each FUS treatment to measure ADC, CBF, BVf, SO2 and DCE parameters (Fig.2). Pseudo Continuous Arterial Spin Labeling (pCASL) datasets4 were acquired to reconstruct CBF maps. Calculation of BVf and SO2 parameters required the injection of USPIO (Micromod, 200µmol iron/kg) in the vascular system before and after the acquisition of two MGEFIDSE (TR/TE=60/4000ms; FOV=30x30mm²; matrix=128x128mm²; 7, 1mm-thick, slices; tacq=6min24s). Finally, to measure vessel permeability, a bolus of Gd-DOTA (200µmol/kg) was injected one minute after the start of the DCE sequence (TR/TE=4/800ms; FOV=30x30mm²; matrix=128x128mm²; 19, 1mm-thick, slices, tacq=6min20s).Results
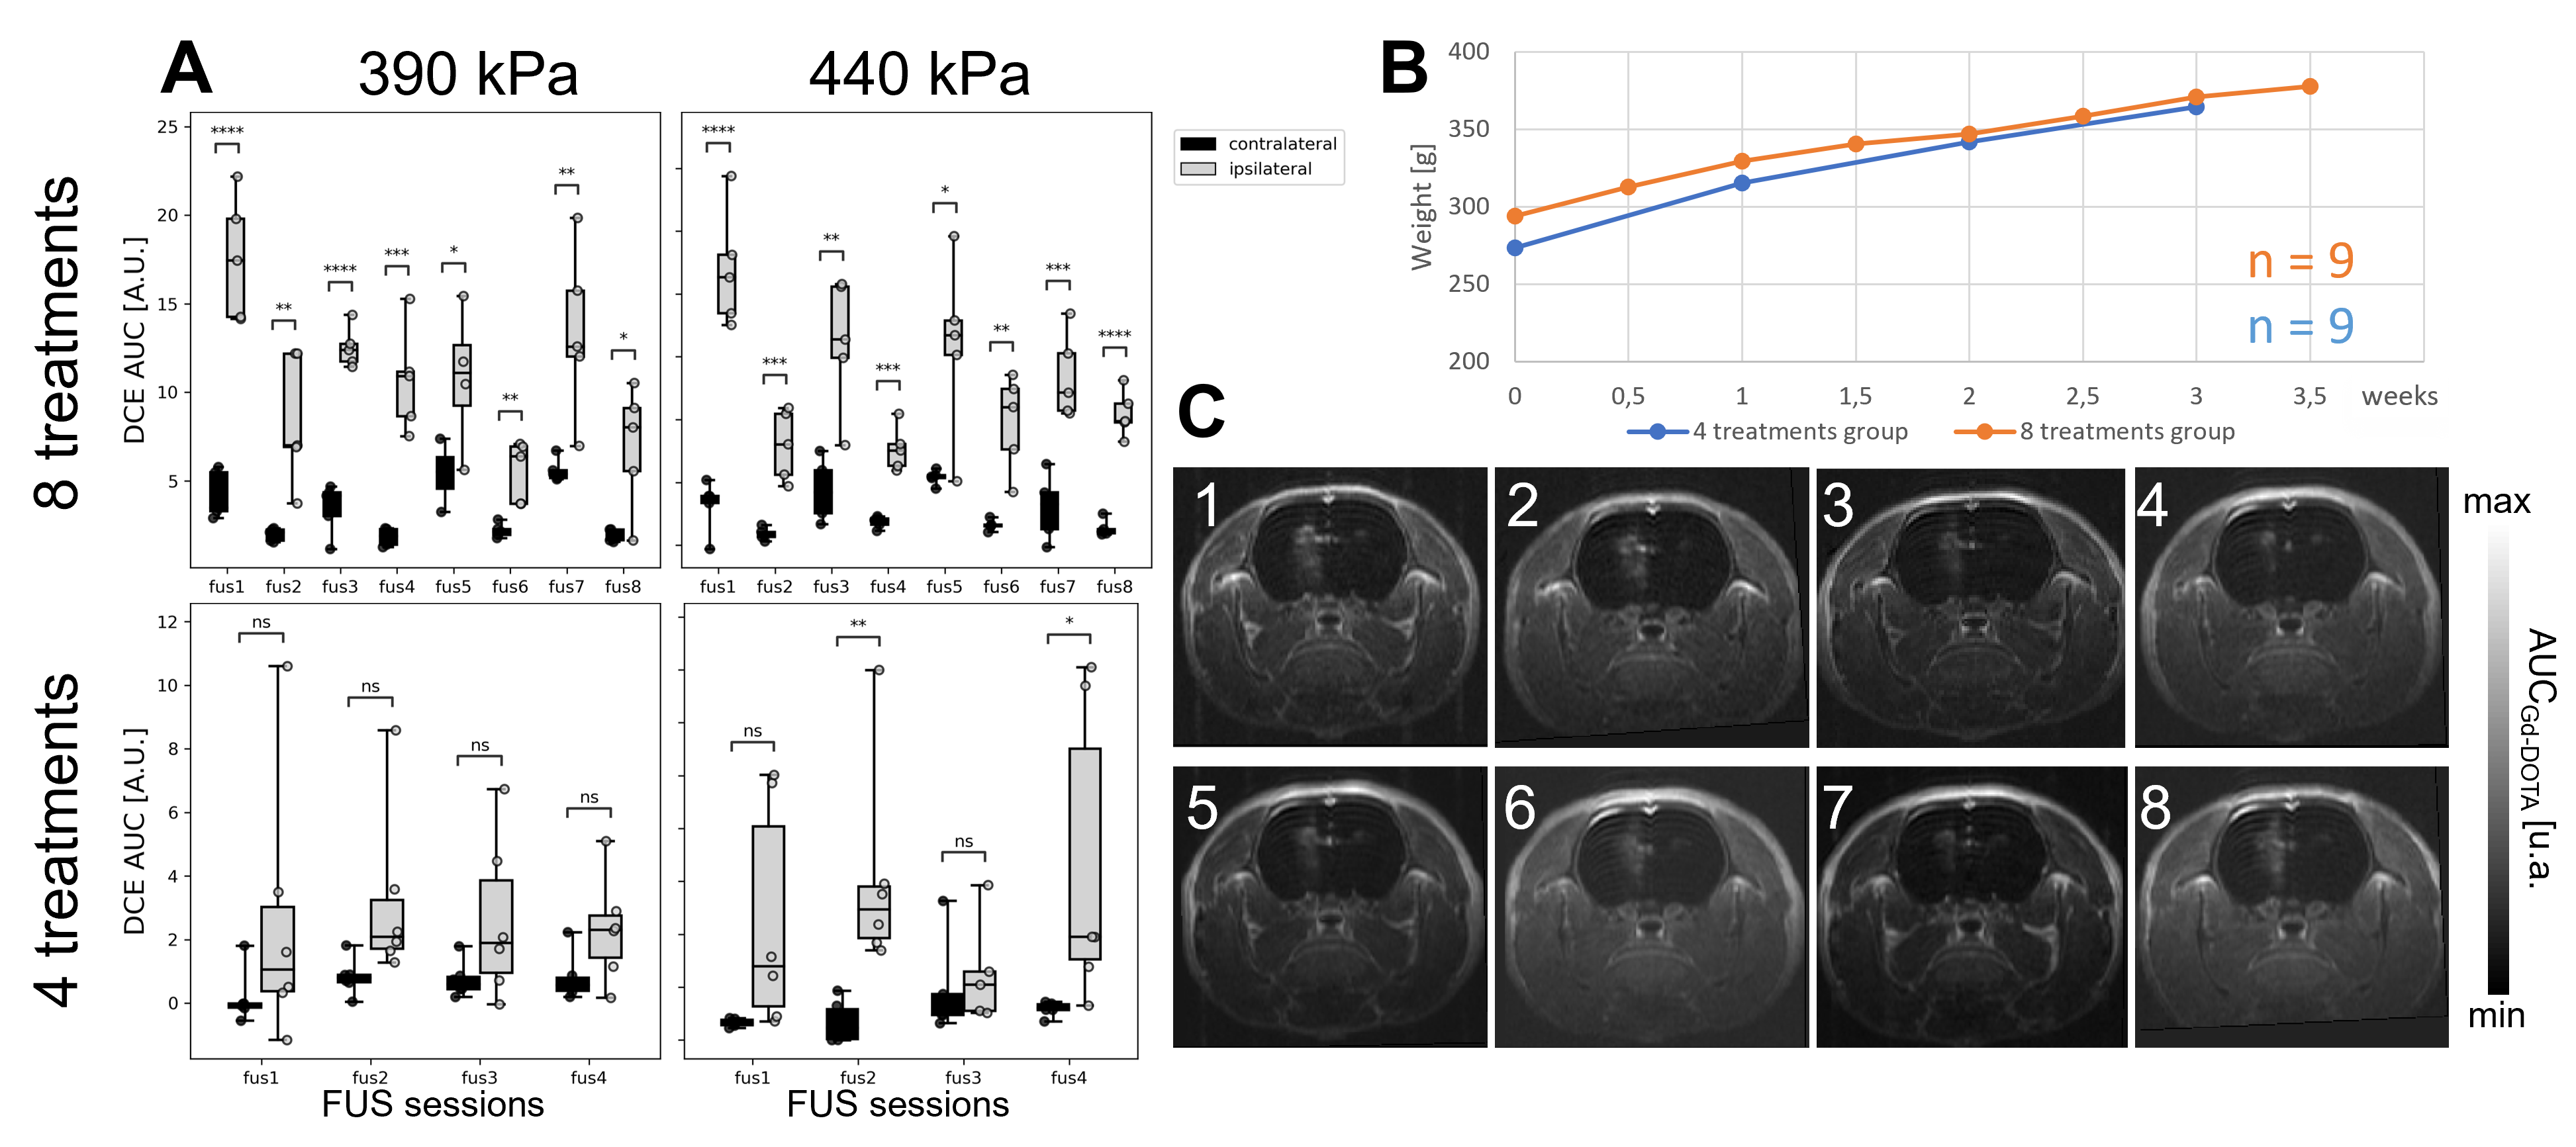
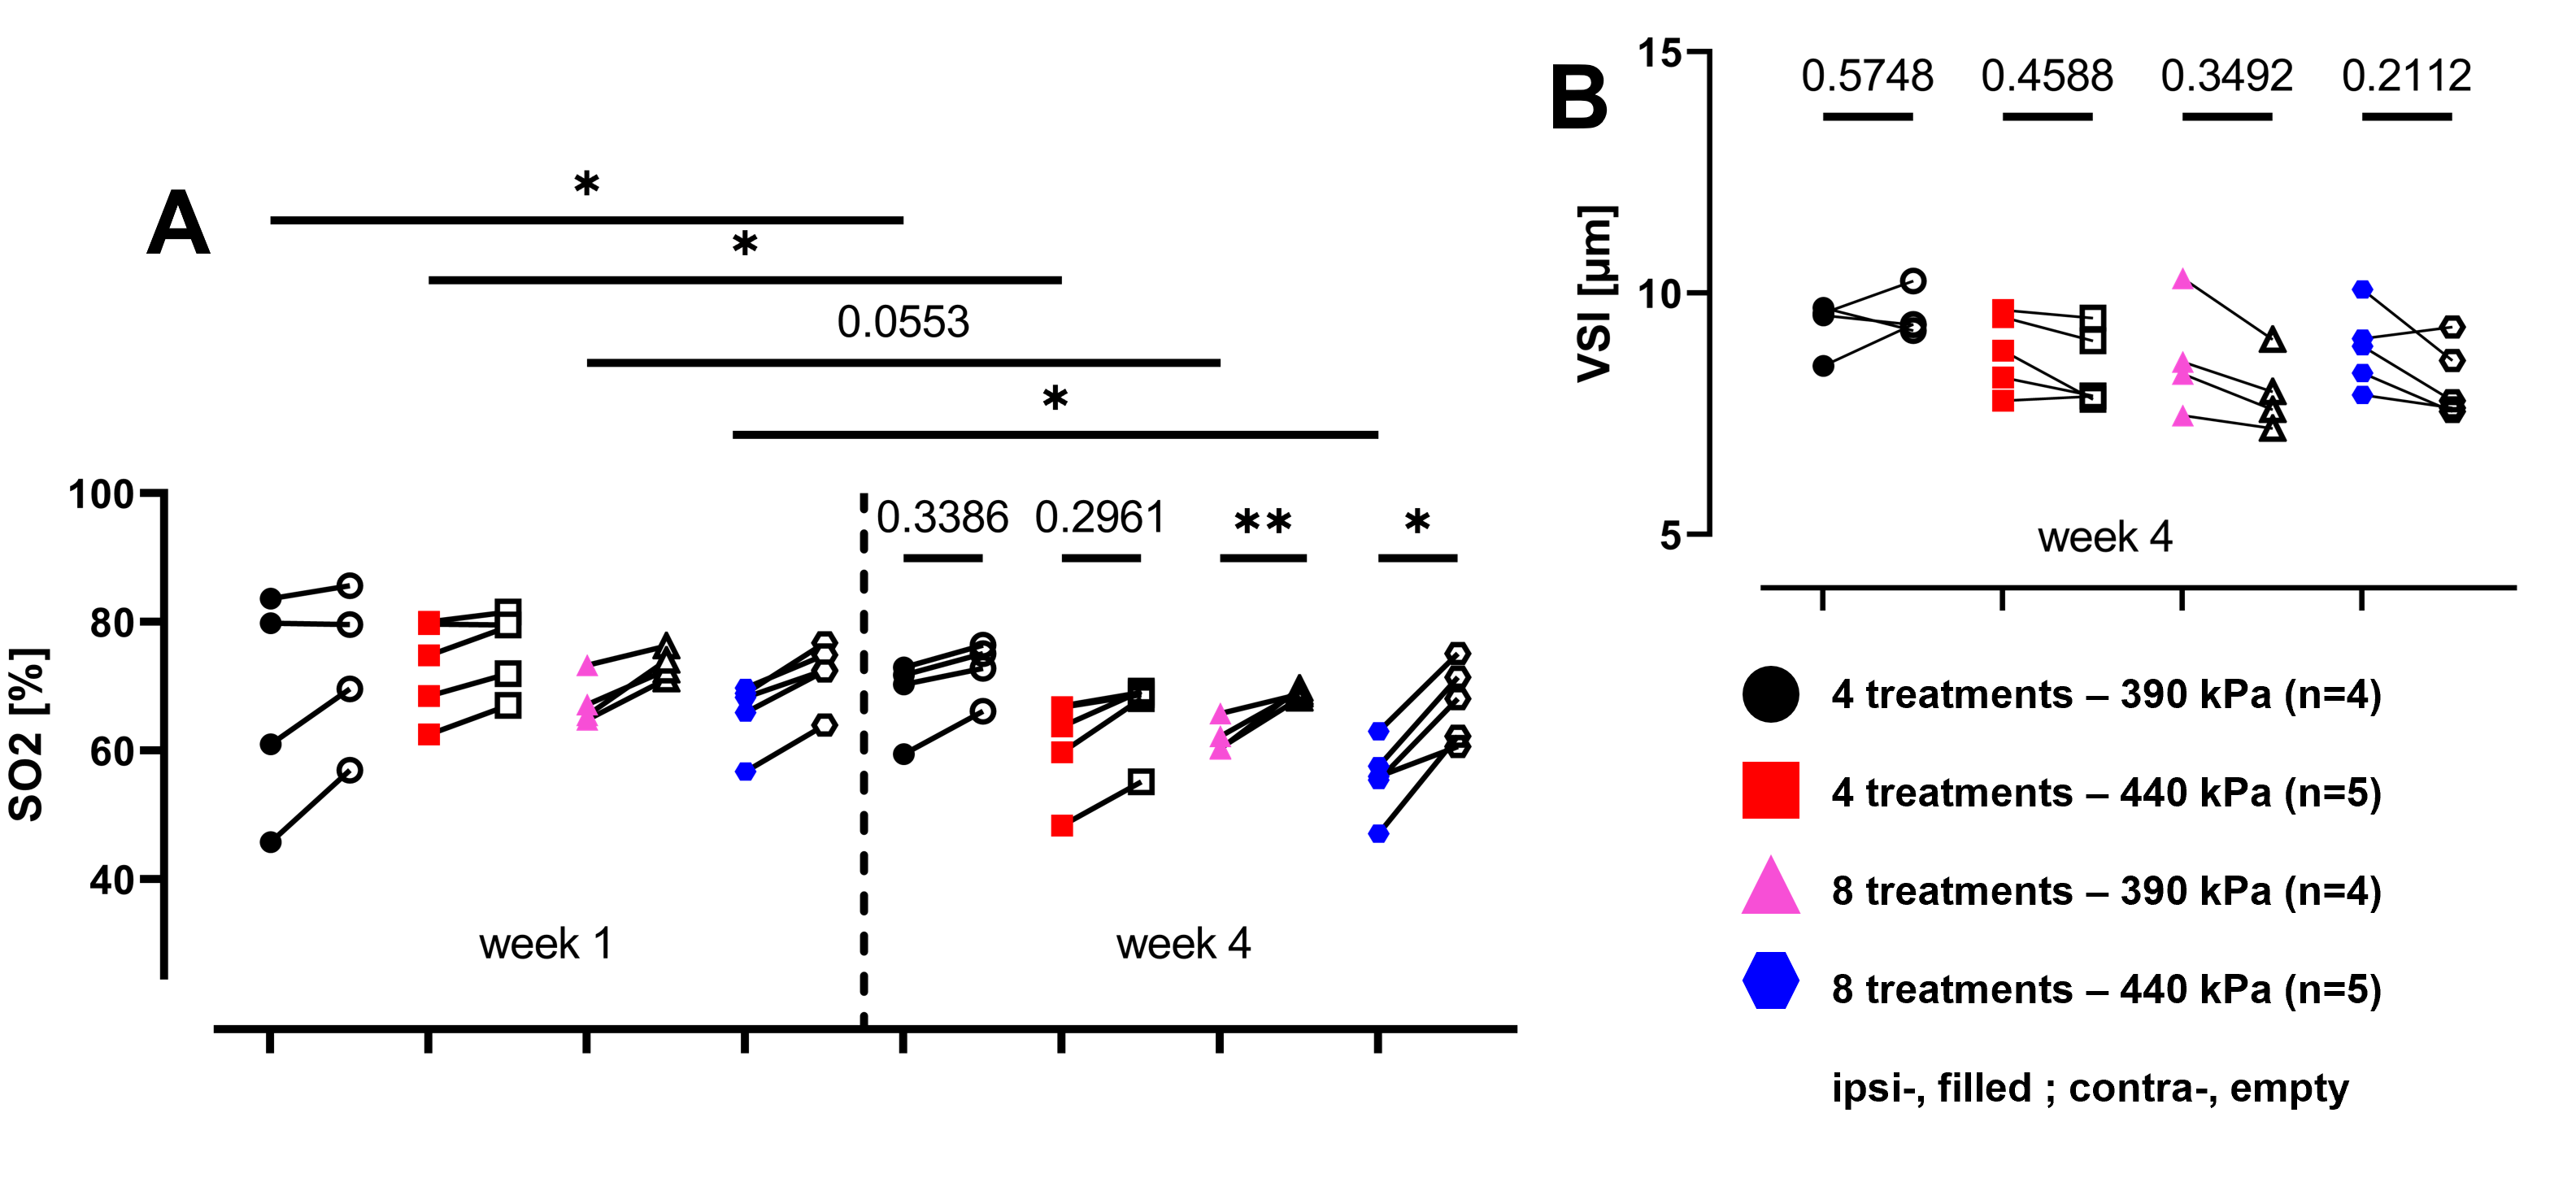
Rats followed normal weight gain and the BBB was permeabilized reliably with each FUS treatment (Fig.3.C) as shown by the significant increase in AUC-DCE (Fig.3.A) without any evident damage on T2-w images. No significant changes in ADC and T1 were measured between ipsi- and contralateral regions. One can observe that BVf is reduced after delivering the FUS treatment from 6% to 12% in the most intensive case and a significant difference is observed at week 4 between the group that received 8 treatments compared to the one that received 4 treatments at 440kPa (Fig.4.A). We can observe a gap in the BVf reduction between the group with 4 treatments compared to the group with 8 treatments suggesting a dependance between the number of sessions per week and the BVf reduction. CBF is increasingly reduced in the region treated as the FUS treatment intensifies up to 38% (Fig.4.B). Oxygenation measurements show significant differences between week 1 and week 4 in the treated region (Fig.5.A.) for 3 treatments out of 4. Plus SO2 is significantly reduced at week 4 in the treated area compared to contralateral for both groups that received 8 treatments compared to those who received only 4. No significant difference in the measure of VSI is observed while comparing ipsi- and contralateral regions, still, the difference tends to become more pronounced as treatment intensifies (Fig.5.B).Discussion
CBF values measured in the treated area are always above 50mL/min/100g and the perfusion drop is transient5. Therefore, we are not in a critical situation. Note that CBF measurements depend on the depth of anesthesia and end-tidal CO2. As we did not control these parameters, inter-individual and inter-session variability may have occurred. Similar to CBF, MR estimation of SO2 values in the ipsilateral region are always above the hypoxic threshold equal to 40%6, while the mean in the contralateral region is equal to 68.57%±5.22 [SD], a value comparable with values from literature7. Finally, Gd-DOTA injections were administered at the end of the protocol. Consequently, the BBB had already initiated its reconstruction process, potentially resulting in slightly lower values of DCE parameters.Conclusion
Long-term BBB is safe for both acoustic pressures and both strategies but is associated with effects that should not be underestimated such as the reduction in CBF and SO2 in the treated region as the FUS treatment becomes more intense. Regarding the translation of these therapeutic strategies to deliver anti-tumor drugs to glioblastoma models on rats, one should not exceed one session per week. As a hypoxic environment suits best to tumor development that could be caused by too closely spaced FUS treatment sessions. Particular attention should be paid to the translation towards clinics as these modifications in hemodynamics and oxygen saturation can become significant, depending on the FUS treatment strategy.Acknowledgements
The IRMaGe facility are gratefully acknowledged as well as FRC Neurodon for the fundings.References
1. M.-S. Felix et al., “Ultrasound-Mediated Blood-Brain Barrier Opening Improves Whole Brain Gene Delivery in Mice,” Pharmaceutics, vol. 13, no. 8, p. 1245, Aug. 2021, doi: 10.3390/pharmaceutics13081245.
2. M. Gerstenmayer, B. Fellah, R. Magnin, E. Selingue, and B. Larrat, “Acoustic Transmission Factor through the Rat Skull as a Function of Body Mass, Frequency and Position,” Ultrasound in Medicine & Biology, vol. 44, no. 11, pp. 2336–2344, Nov. 2018, doi: 10.1016/j.ultrasmedbio.2018.06.005.
3. L. S. B. Boisserand et al., “Multiparametric magnetic resonance imaging including oxygenation mapping of experimental ischaemic stroke,” J Cereb Blood Flow Metab, vol. 37, no. 6, pp. 2196–2207, Jun. 2017, doi: 10.1177/0271678X16662044.
4. L. Hirschler, C. S. Debacker, J. Voiron, S. Köhler, J. M. Warnking, and E. L. Barbier, “Interpulse phase corrections for unbalanced pseudo-continuous arterial spin labeling at high magnetic field: RF Phase Optimization for Unbalanced pCASL,” Magn. Reson. Med., vol. 79, no. 3, pp. 1314–1324, Mar. 2018, doi: 10.1002/mrm.26767.
5. S. Rigollet, A. Delalande, E. Dumont, C. Pichon, E. L. Barbier, and V. Stupar, “Cerebral perfusion monitoring after FUS mediated blood-brain barrier opening: a study to evaluate ultrasound bioeffect.” 22nd Annual International Symposium on Therapeutic Ultrasound (ISTU 2023), Lyon, France, Apr. 2023, hal-04215096.
6. B. Lemasson et al., “Evaluation of the Relationship between MR Estimates of Blood Oxygen Saturation and Hypoxia: Effect of an Antiangiogenic Treatment on a Gliosarcoma Model,” Radiology, vol. 265, no. 3, pp. 743–752, Dec. 2012, doi: 10.1148/radiol.12112621.
7. T. Christen et al., “Evaluation of a quantitative blood oxygenation level-dependent (qBOLD) approach to map local blood oxygen saturation,” NMR Biomed., p. n/a-n/a, 2010, doi: 10.1002/nbm.1603.
Figures