0160
Connectomics at 64 mT1CUBRIC, Cardiff University, Cardiff, United Kingdom, 2Imaging Processing Laboratory, Universidad de Valladolid, Valladolid, Spain, 3Hyperfine, Inc., Guildford, CT, United States
Synopsis
Keywords: Low-Field MRI, Brain Connectivity, Connectomics
Motivation: Neuroscience MRI research, including assessment of structural connectomics, has been largely limited to high-resource settings.
Goal(s): To democratise assessment of brain connectivity by demonstrating the first ever diffusion-weighted imaging (DWI)-based connectomics at 64 mT.
Approach: 15-direction DWI data were acquired at 64 mT. Whole-brain tractograms were recovered after deep learning based denoising and constrained spherical deconvolution. Whole-brain adjacency matrices and graph-theory parameters were extracted, and their test-retest agreement and variability assessed. For one subject, results were compared to high-field MRI.
Results: Global graph-theory parameters (e.g., small-worldness) showed high test-retest agreement. However, inter-hemispheric connectivity was overestimated at 64 mT compared to high-field results.
Impact: Our unique combinations of low-field (64 mT) diffusion-weighted imaging, denoising, spherical deconvolution and connectomics opens up new research opportunities, allowing the assessment of structural connectivity and network neuroscience studies of under-served populations where this has never previously been possible.
Introduction
To democratise MRI, low-field scanners are a game-changer, being significantly cheaper than high-field systems, requiring less resources and expertise to run and maintain.1 However, diffusion-weighted MRI (dMRI) quality is modest at low field.2,3Connectomics has arisen as a key technique to model the structural brain connections, but requires the ability to resolve complex fibre architectures. Nevertheless, to date, only Diffusion Tensor Imaging have been reported at low field, using a 6-gradient direction encoding scheme to recover specific tracts.4
The objective here is to advance this field, by enhancing dMRI quality, recovering complex architecture, and extracting whole-brain structural connectivity matrices.
Methods
DataThree male healthy participants (ages=24, 28, and 31 years old) were each scanned twice on a 64 mT Hyperfine Swoop system (Guildford, CT, USA).
Diffusion-weighted images (DWIs) were acquired using a modified version of the product diffusion-weighted fast spin echo sequence along 15 gradient directions (b=900 s/mm2) plus one b=0 volume; TR=1000ms, TE=77ms, matrix size=60$$$\times$$$72, voxel size=3$$$\times$$$3$$$\times$$$3mm, 66 axial slices. Undersampling factor=1.2 and 0.7 for the b=0 and DWIs, respectively. Acquisition time=74 minutes. The sampling vectors were optimised as described elsewhere.5
T1- and T2-weighted images were also obtained with approximately 1.6$$$\times$$$1.6mm in-plane resolution, slice thickness=5mm. Acquisition time=12.5 minutes.
MRI processing
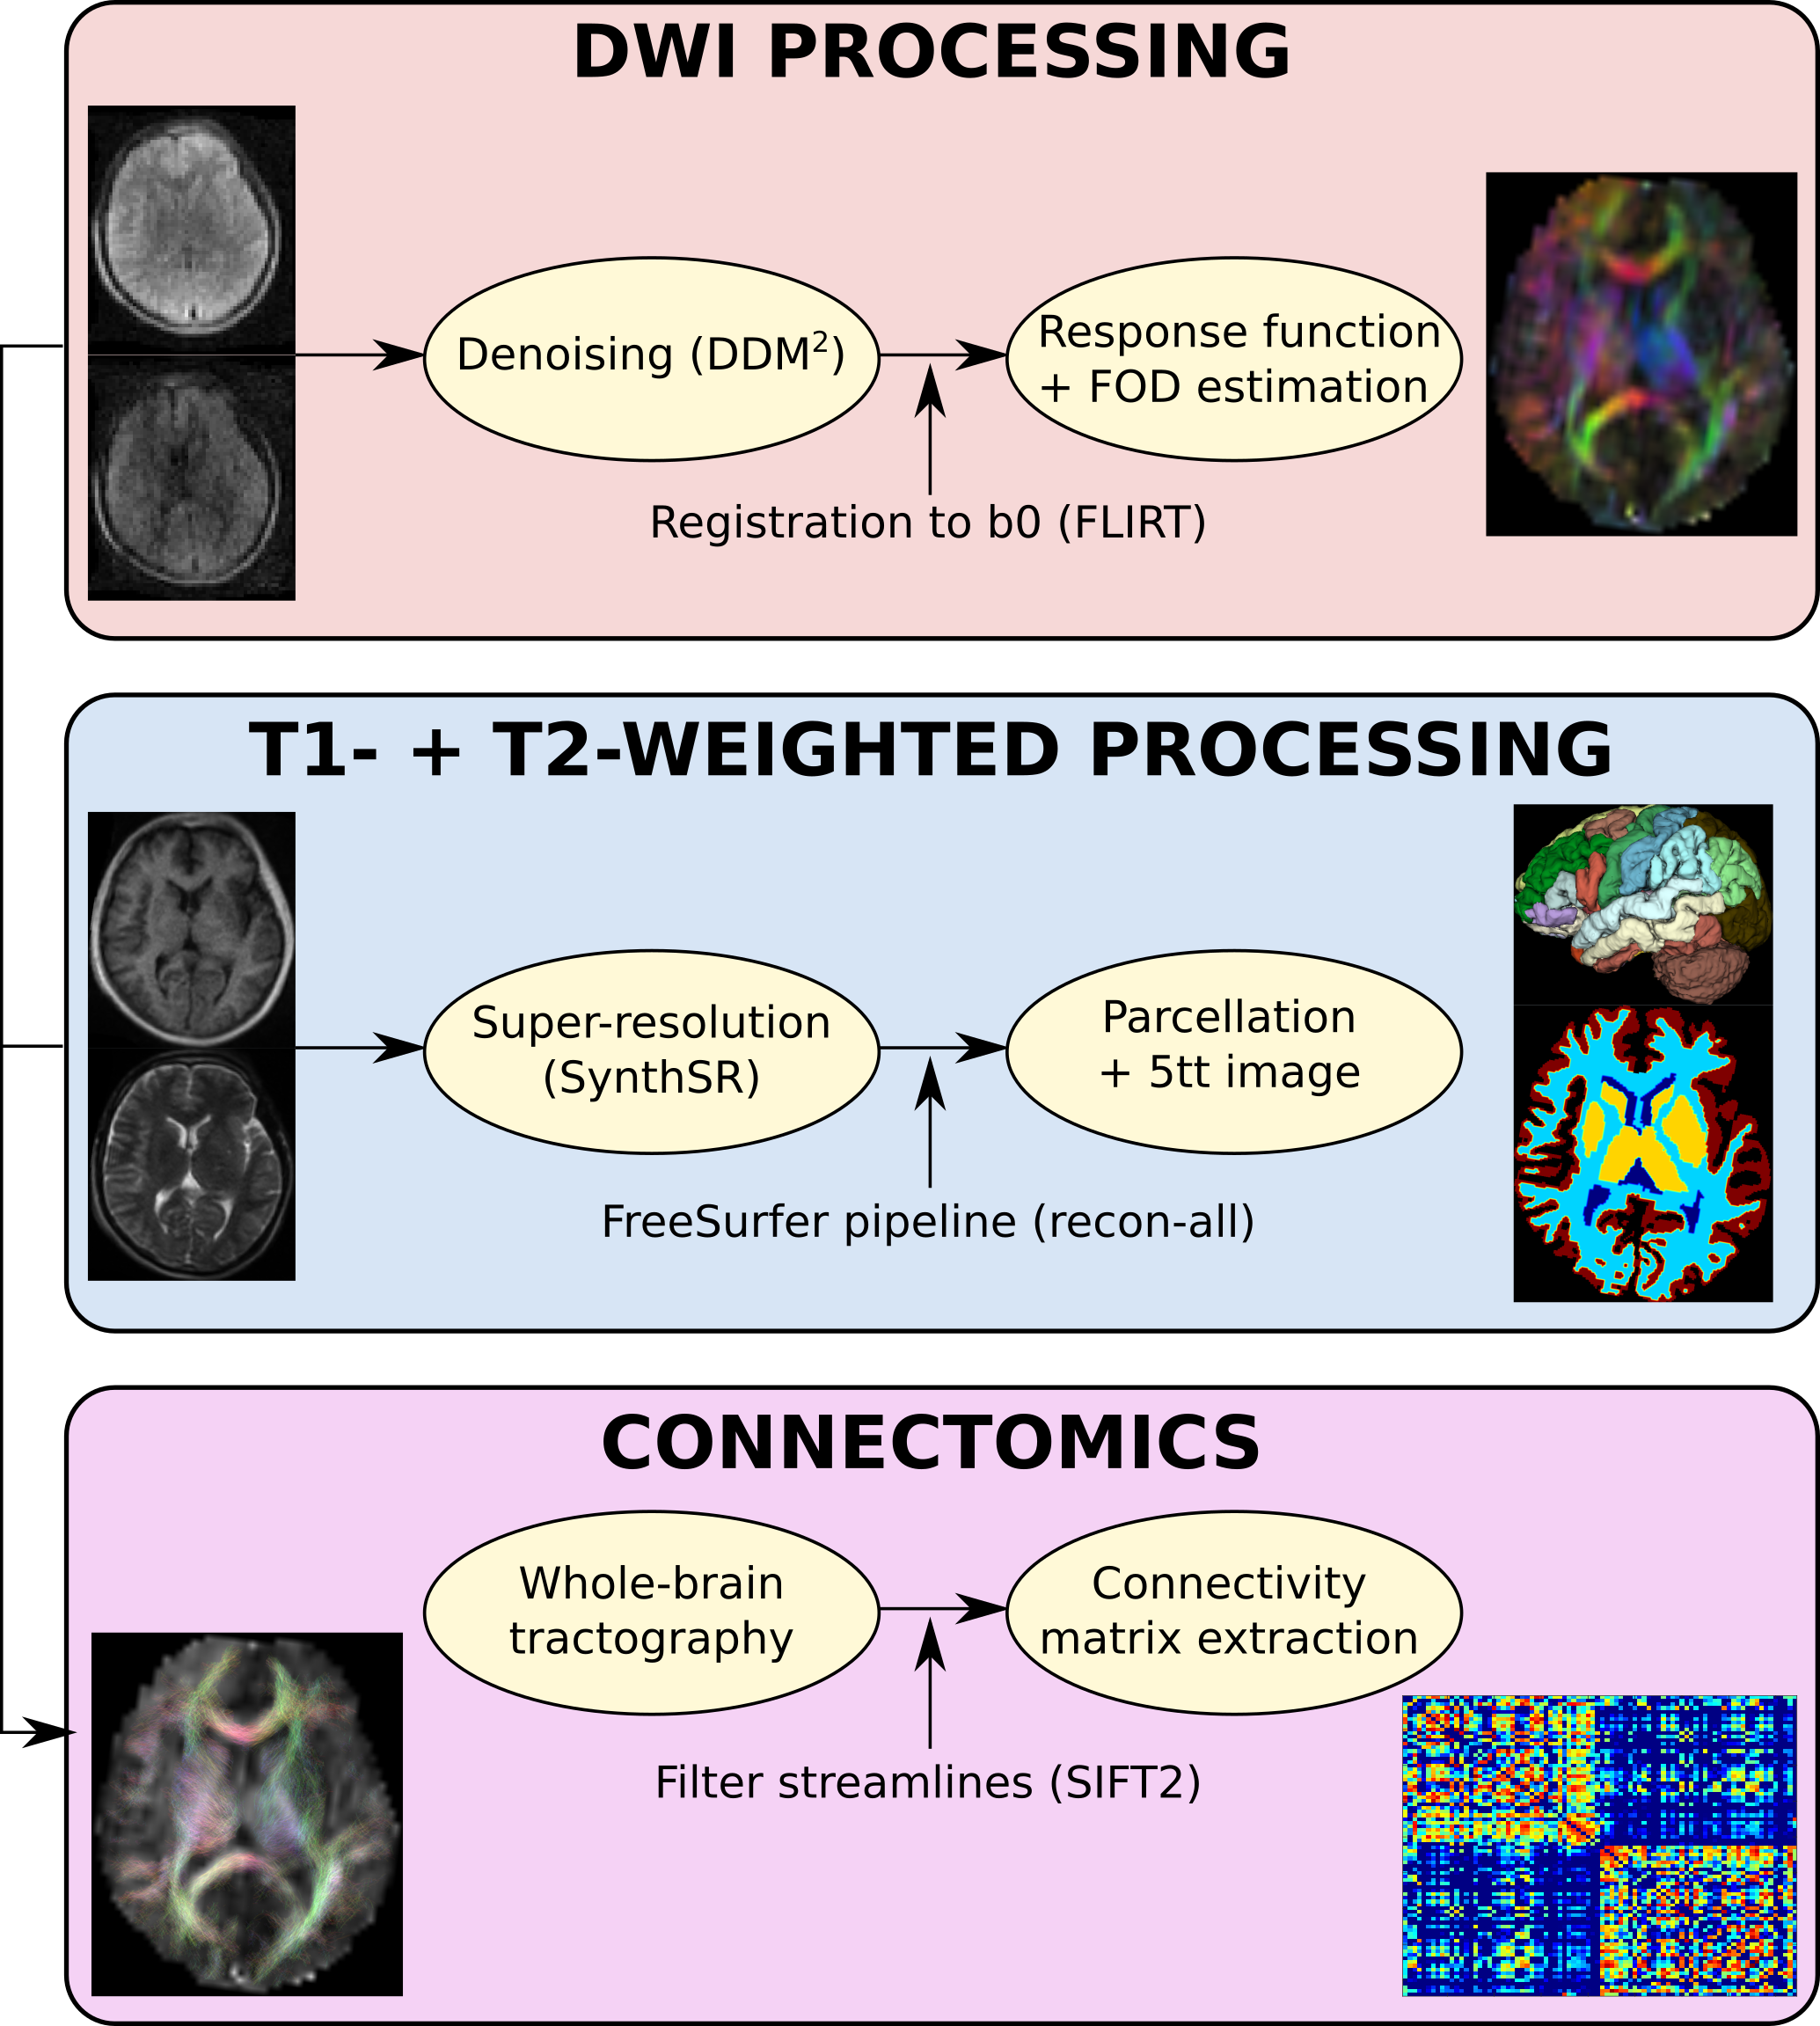
Super-resolved T1-weighted volumes (1$$$\times$$$1$$$\times$$$1mm) were obtained from the T1- and T2-weighted data using SynthSR (FreeSurfer, v7.3.2).6 Next, the FreeSurfer automatic pipeline was applied to segment grey matter regions according to the Desikan-Killiany atlas.7 Five-tissue-type (5TT) images were extracted using “5ttgen”.8 The 5TT images and subject-specific atlas were linearly registered to the b=0 volume using FLIRT (FSL’s linear image registration tool),9 initialised with the registration from the T1-weighted volume.
DDM2 was used to denoise the dMRI data.10 Then, the DWIs were linearly registered to the b=0 volume, with b-vector rotation. The response function and fibre orientation distribution were estimated with the Tournier algorithm and constrained spherical deconvolution, respectively.11,12
Probabilistic anatomically-constrained tractography was performed using iFOD2, and filtered using SIFT2, reconstructing 2,000,000 streamlines.13,14 Streamline-count was used as the edge-weight for structural connectivity matrices obtained with “tck2connectome”.15 Figure 1 summarises the pipeline.
Analysis of the structural connectivity
Test-retest agreement was assessed with the intraclass correlation coefficient (ICC), employing a mixed-effects model. Inter- and intra-subject variability were evaluated with the coefficient of variation. As global connectivity graph-theory parameters, the clustering coefficient, characteristic path length, small-world index, and global efficiency were extracted with the Brain Connectivity Toolbox.16
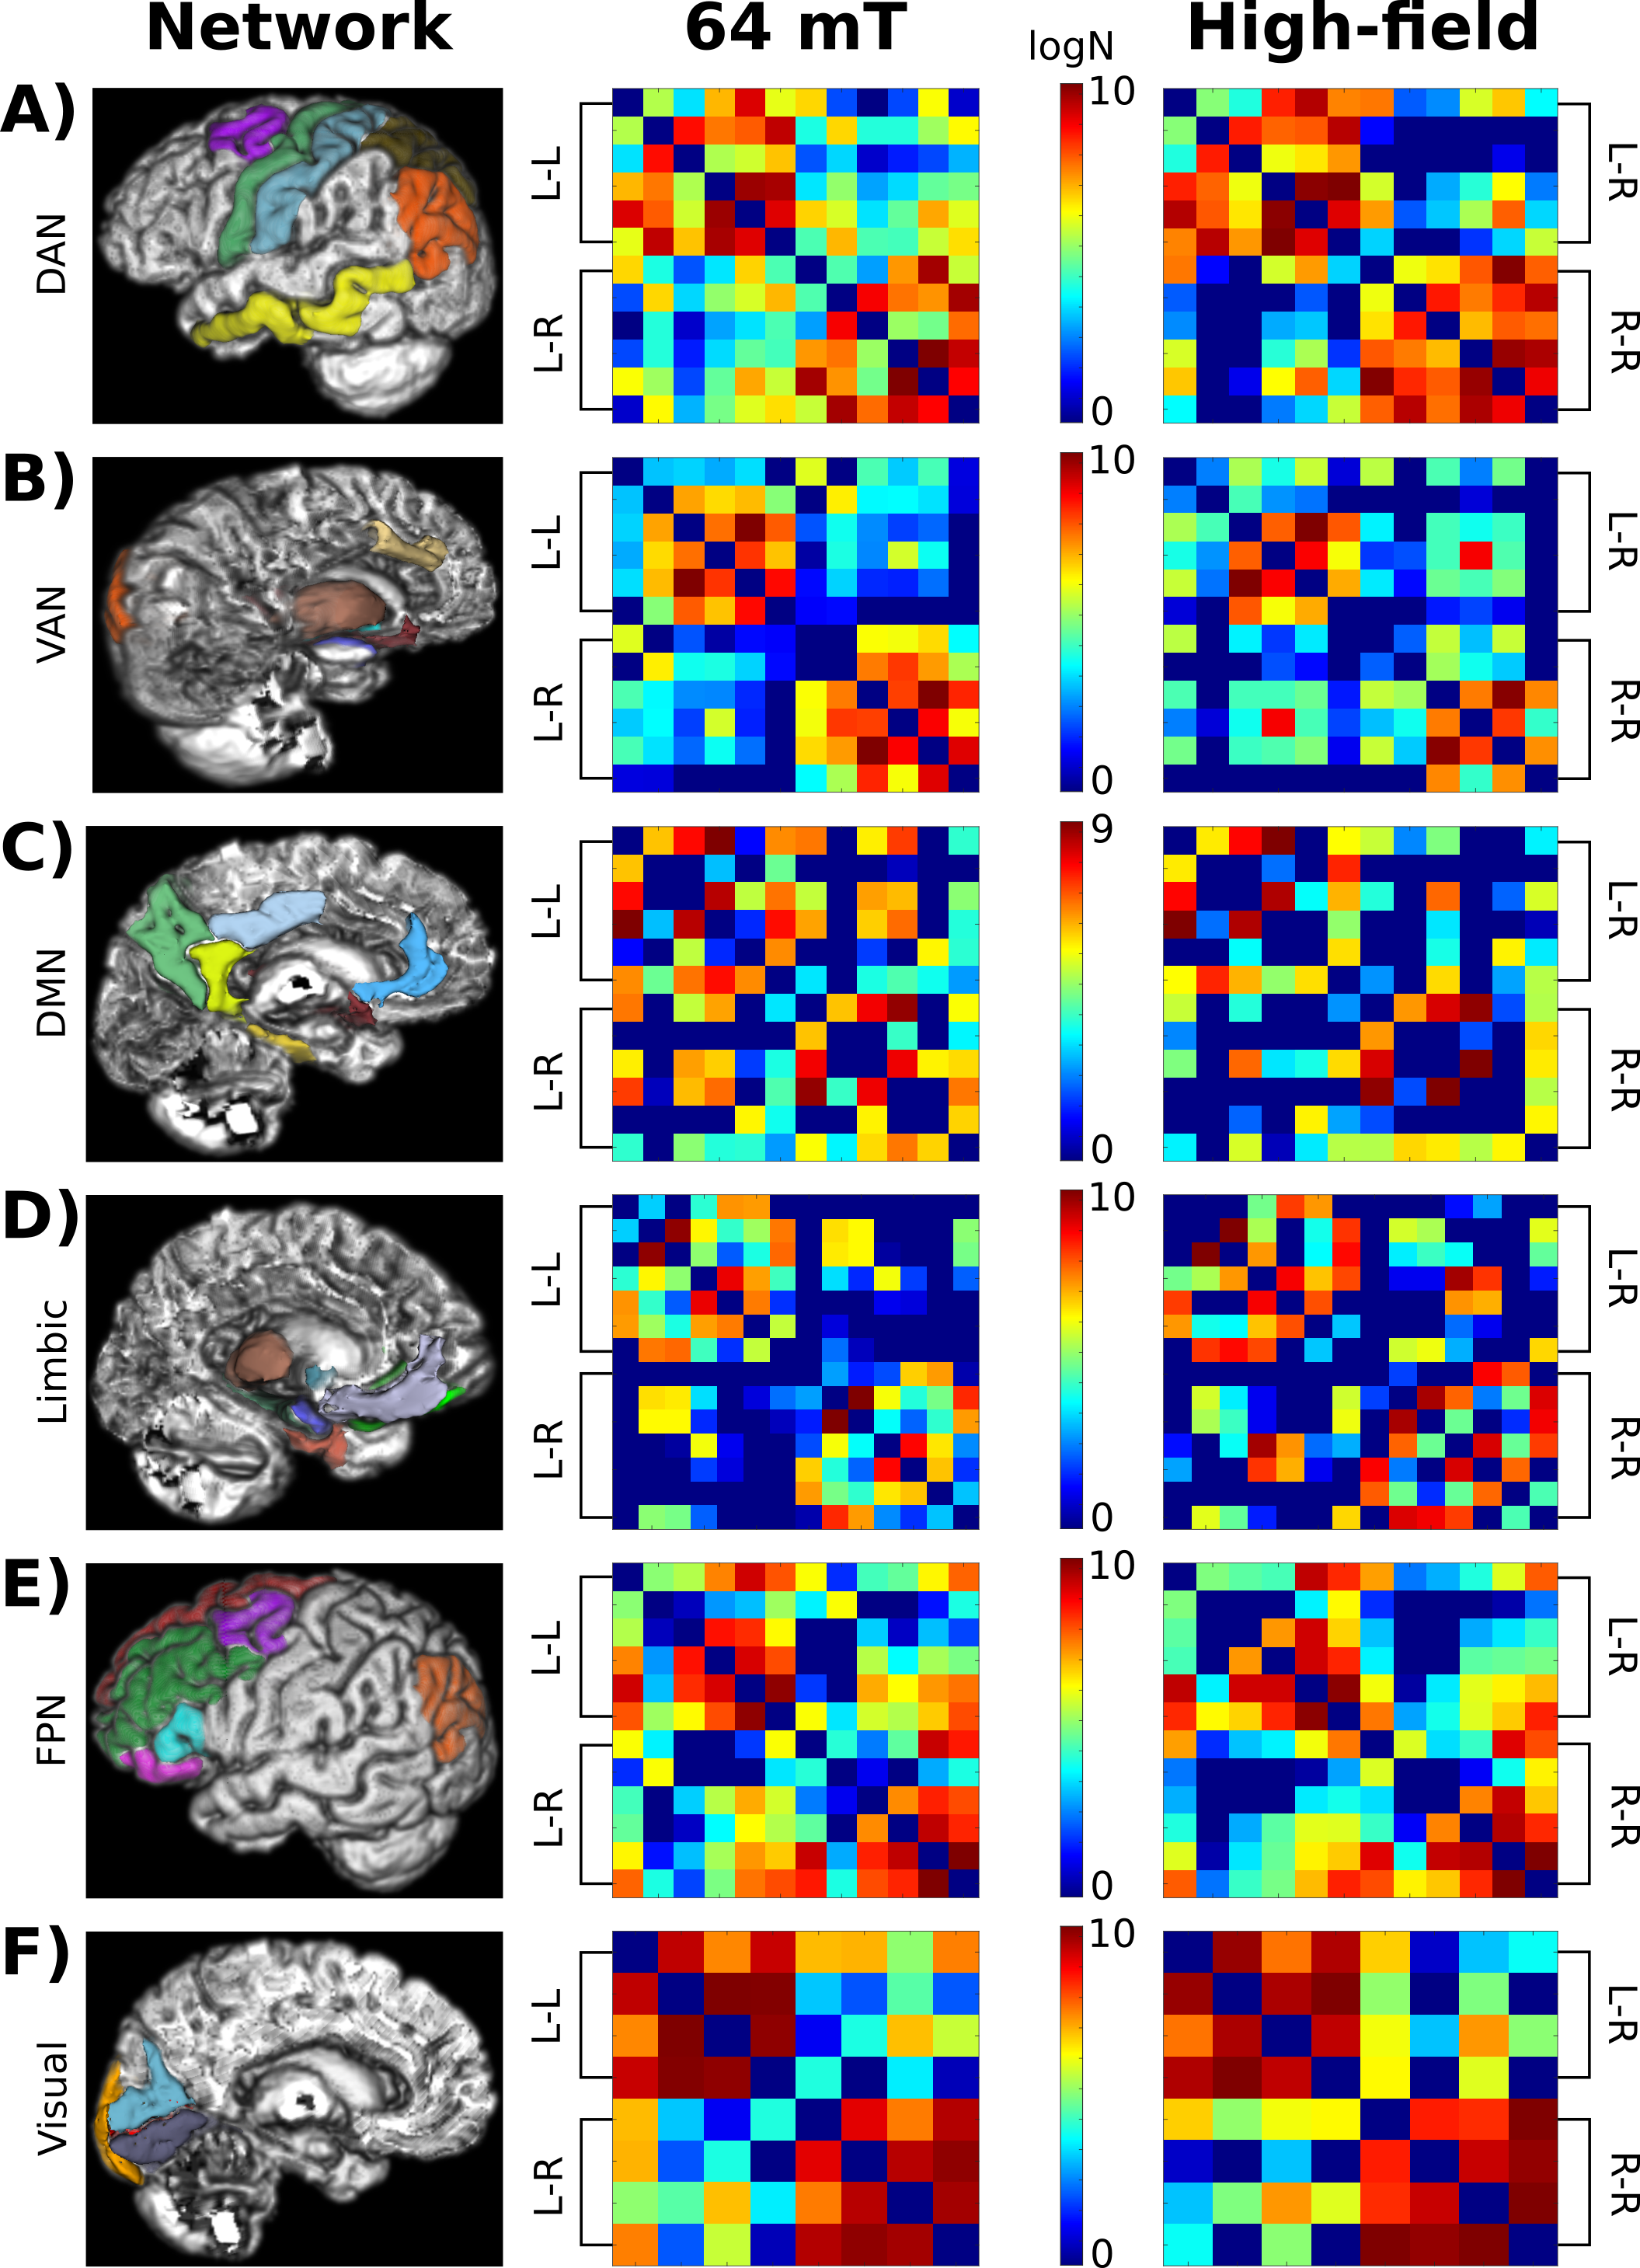
The connectivity matrix and graph-theory parameters were compared with values extracted from high-field single-shell data from one participant (details elsewhere17). Additionally, the matrices based on Yeo’s functional 7-network parcellation were qualitatively compared.18
Results
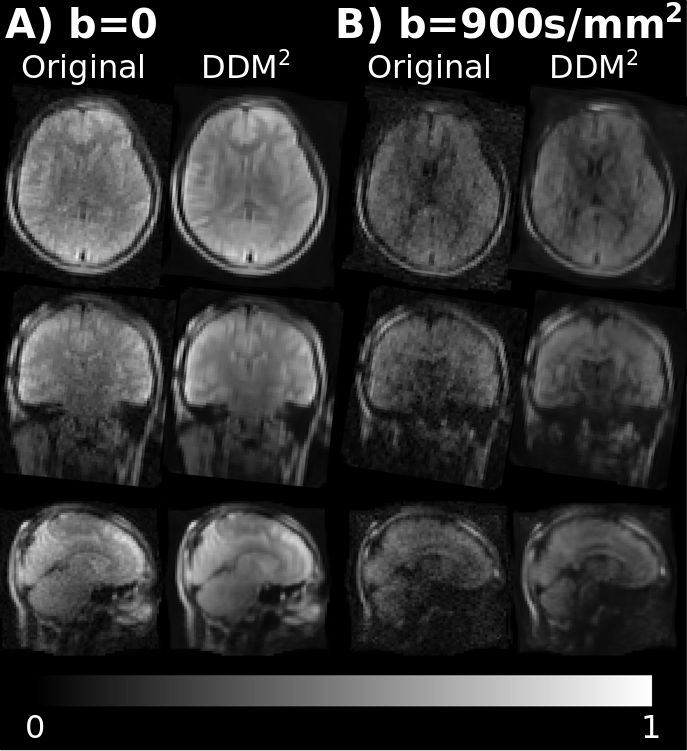
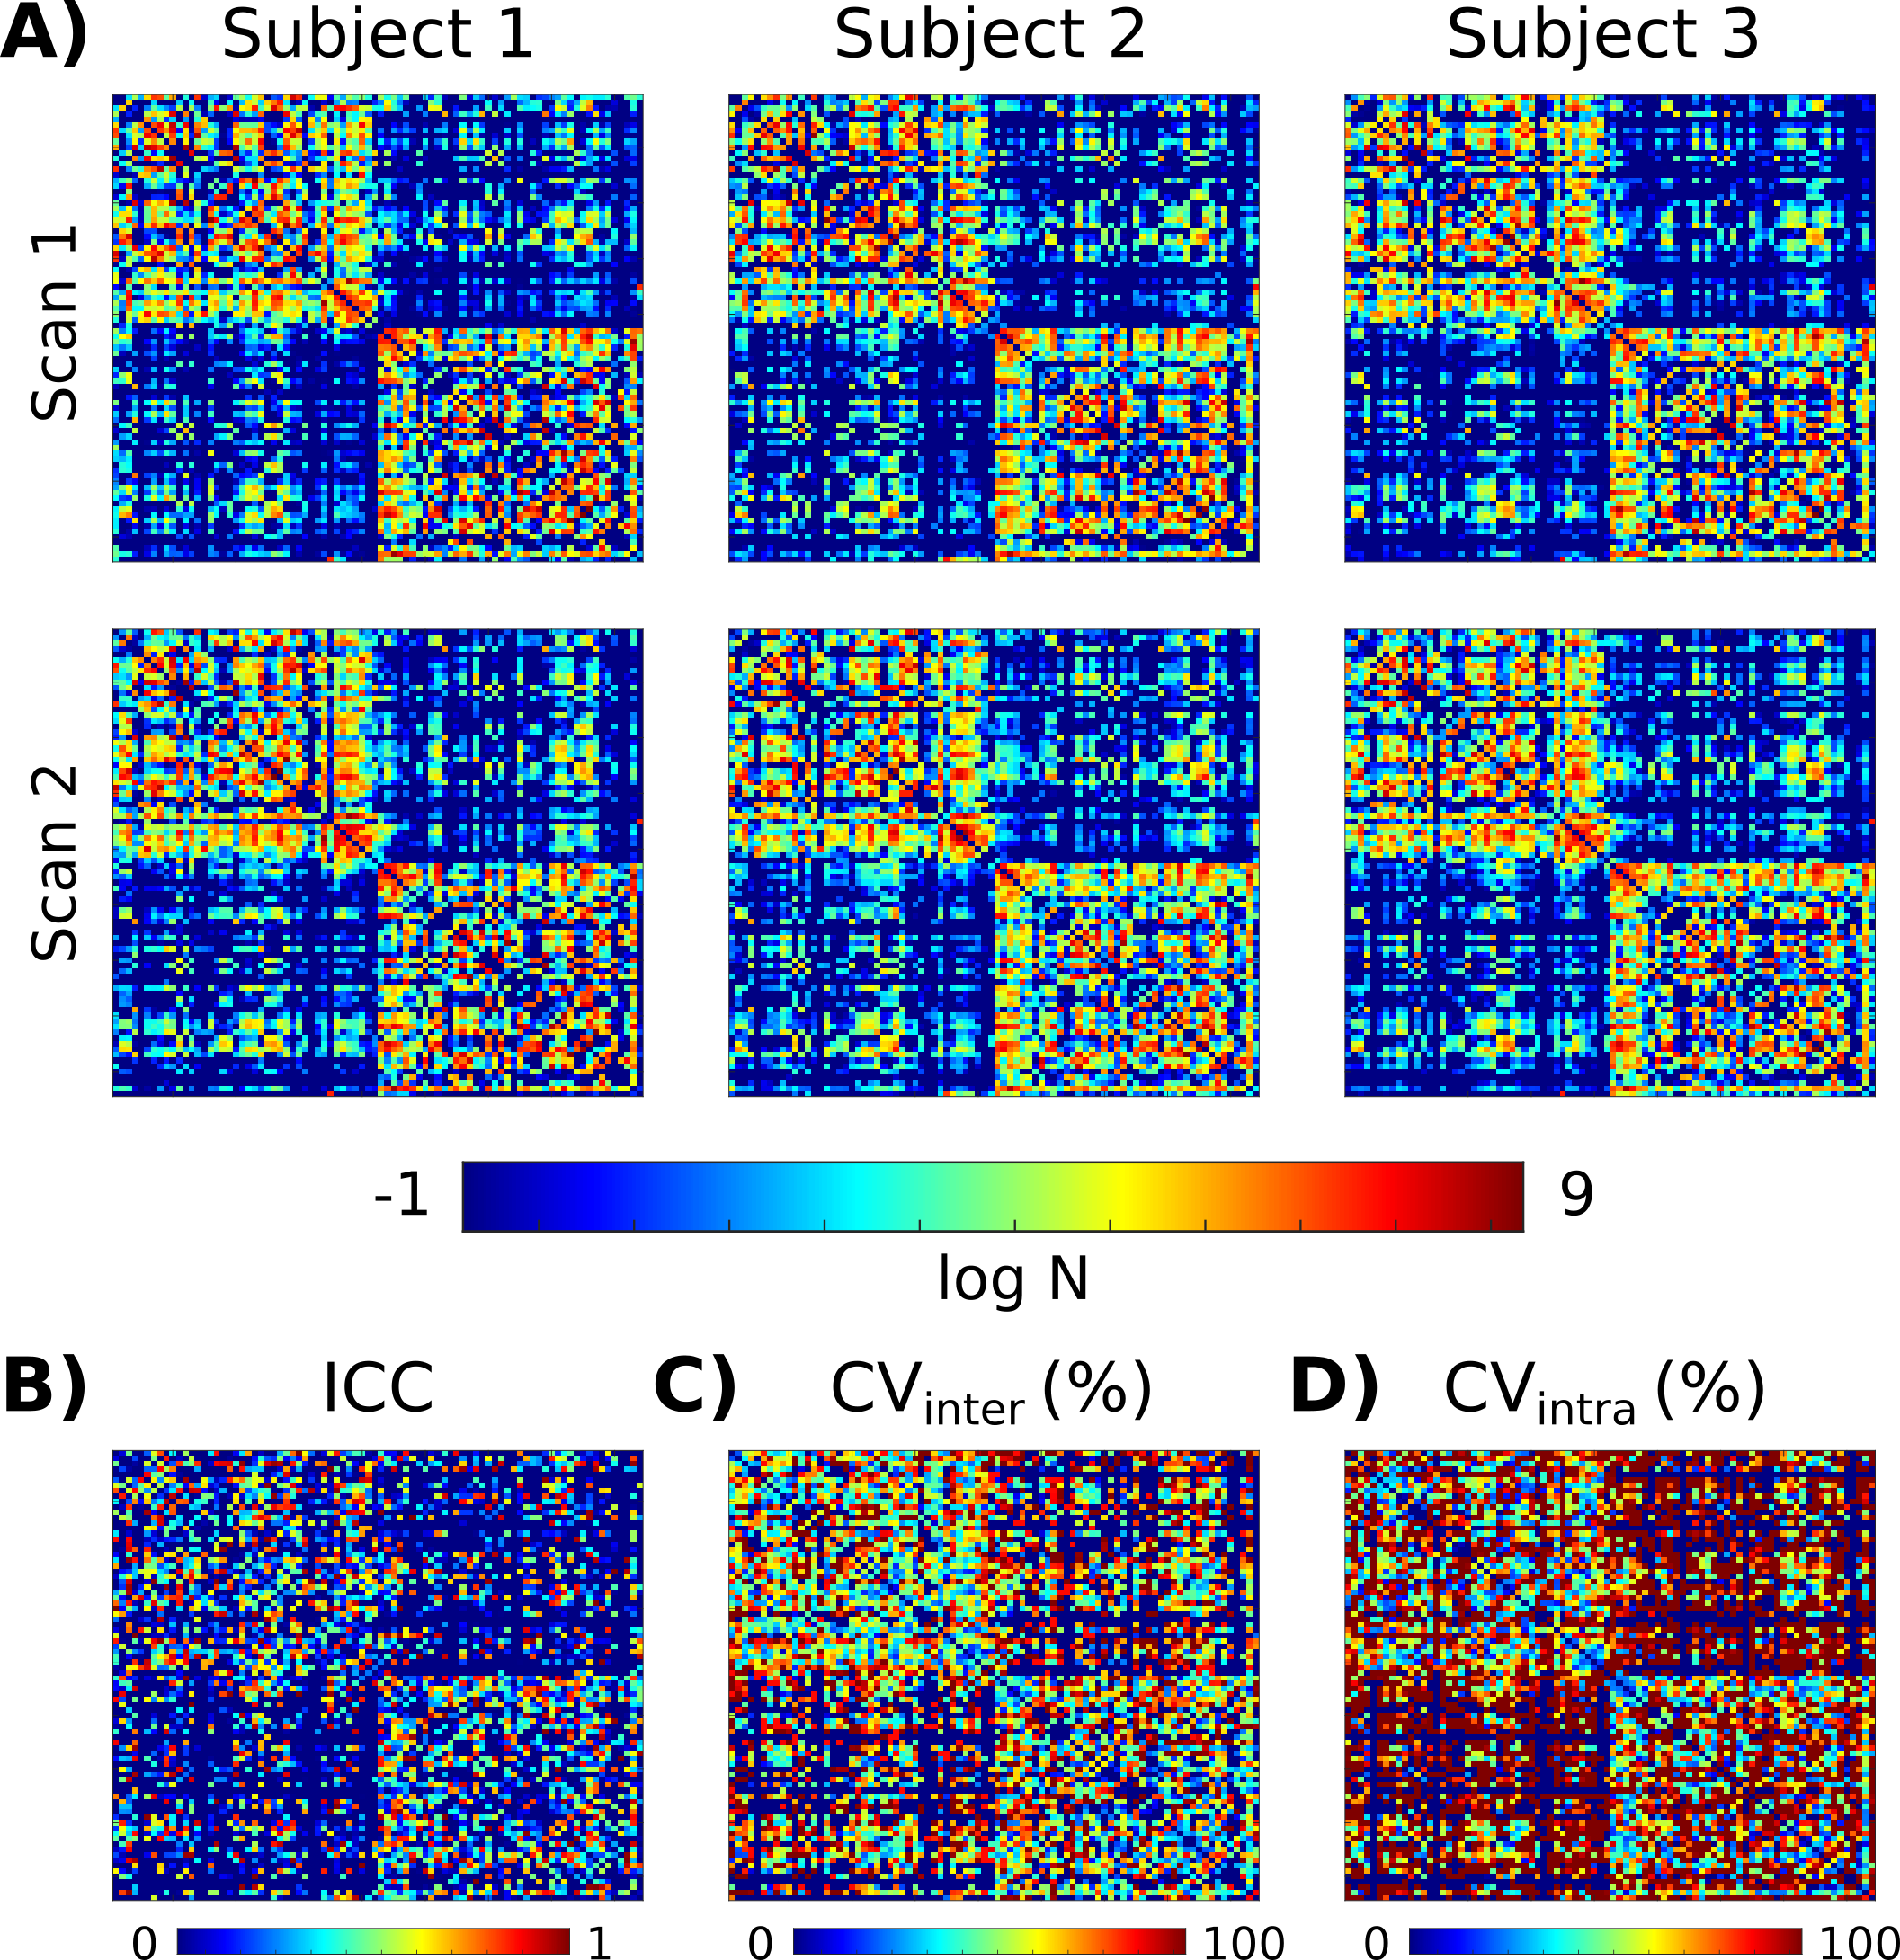
Figure 2 compares the original and denoised DWI, showing significant signal-to-noise ratio (SNR) improvement and excellent preservation of anatomical details.Figure 3A shows the connectivity matrices obtained at 64 mT. The test-retest agreement for most individual connections was moderate-to-low, and the intra-subject variability was generally higher than the intersubject variability, especially for inter-hemispheric connections (Figure 3B-D). This, despite the denoising, is likely attributable to the low SNR of the data.
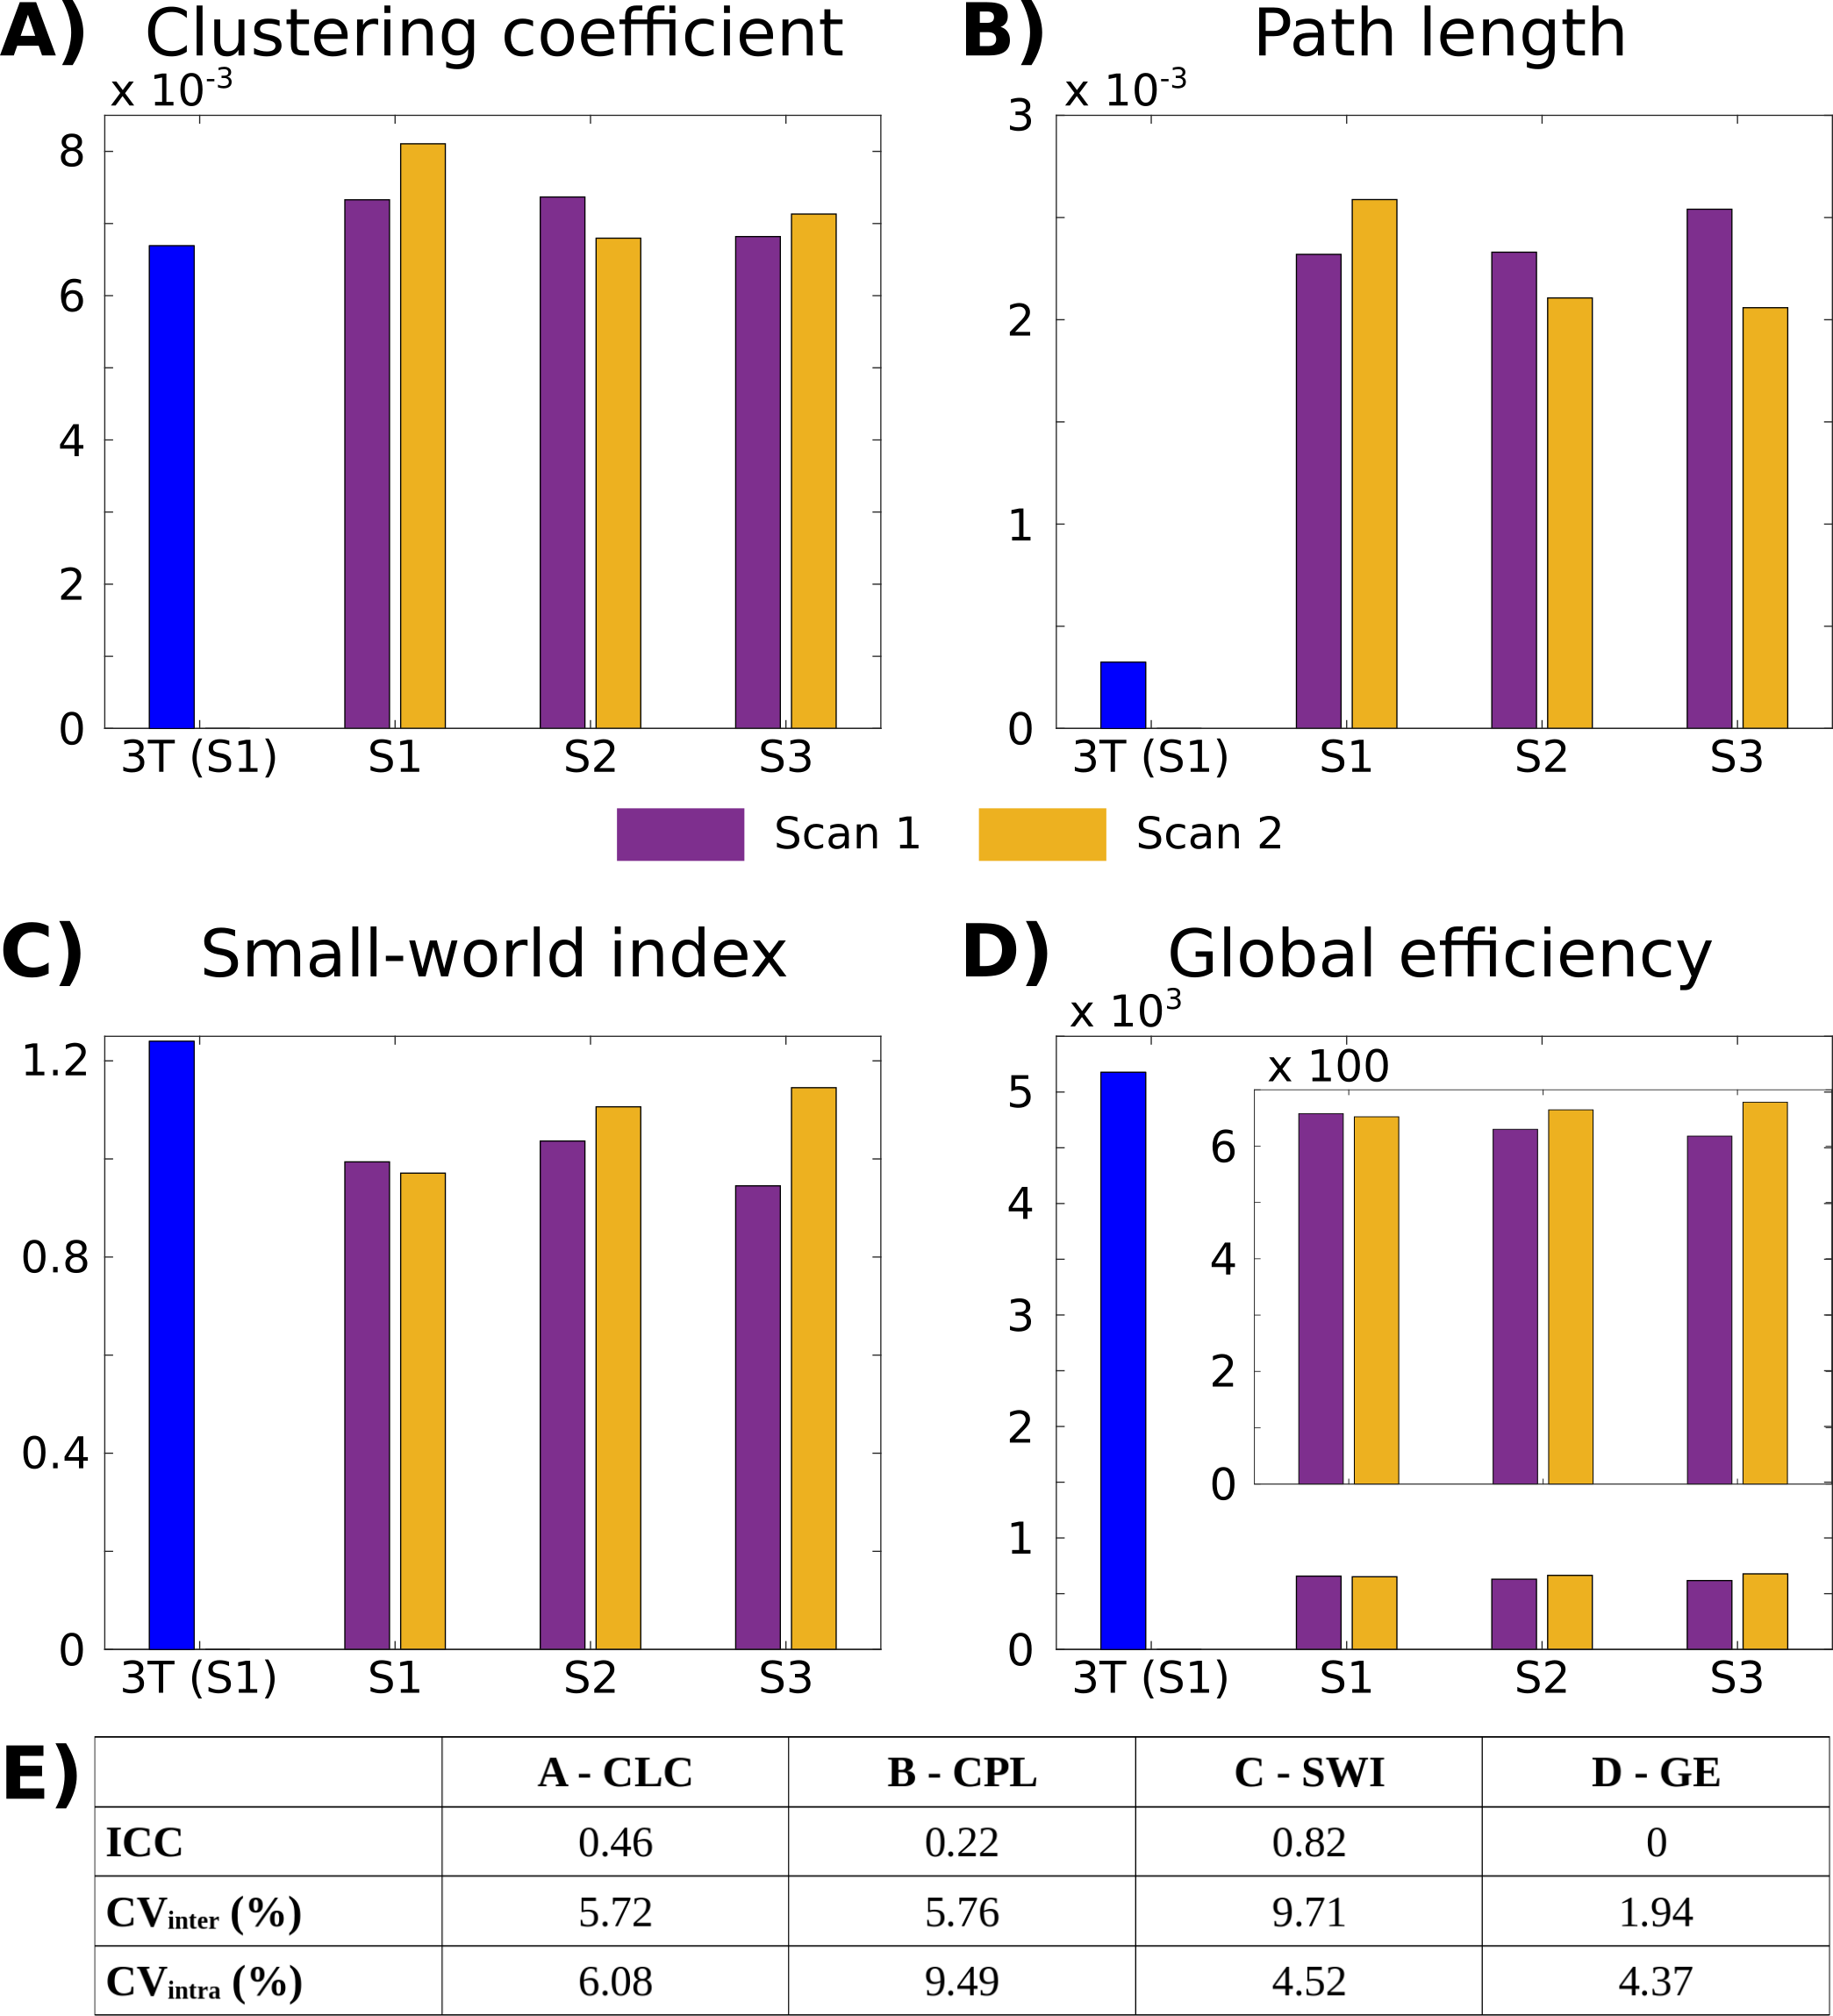
However, the inter- and intrasubject variability of all global graph-theory parameters was acceptable (<10%, Figure 4E). Low-field measures of efficiency and small-worldness were lower than at high-field, related to a higher characteristic path length (Figure 4A-D).
Figure 5 shows the comparison of Yeo’s 7-network functional parcellation-based matrices. The intra-hemispheric connections with the highest number of streamlines at high-field were similarly replicated at low-field. The inter- and intra-hemispheric connections with a medium-low number of streamlines had higher variability, but most relationships between connections were preserved.
Discussion
We developed a processing pipeline to improve low-field DWI quality obtained at 64 mT, preserving anatomical details, and obtain structural connectivity matrices. At low field, the connections with the highest number of streamlines mostly reproduced those at higher field. However, the inter-hemispheric connections were overestimated and presented a higher variability, although the global graph-theory parameters showed acceptable inter- and intra-subject variability.Discrepancy between high- and low-field MRI matrices may be related to the acquisition, e.g., low spatial resolution, few gradient directions, or high participant motion due to the prolonged scan times, and technical aspects such as inaccuracy of the delineation of the boundaries between diverse tissues or grey matter regions, or shortcomings in image registration. Image segmentation and registration procedures tailored to low-field MRI data may help improve the characterisation of whole-brain connections.
Conclusion
We demonstrate a 15-direction DWI dataset with improved quality (through the deep learning denoising) and, with spherical harmonic deconvolution, characterise the main structural connections between grey matter regions, quantifying their topology for the first time at 64 mT.Acknowledgements
This work was made possible by generous support from the Bill and Melinda Gates Foundation through the award of the UNITY project, and through the Wellcome LEAP 1kD programme. ÁP-G was funded by the European Union (NextGenerationEU).References
1. Anazodo UC, Ng JJ, Ehiogu B, et al. A framework for advancing sustainable magnetic resonance imaging access in Africa. NMR Biomed 2023; 36: e4846.
2. Arnold TC, Freeman CW, Litt B, et al. Low-field MRI: Clinical promise and challenges. Journal of Magnetic Resonance Imaging 2023; 57: 25–44.
3. Prabhat AM, Crawford AL, Mazurek MH, et al. Methodology for Low-Field, Portable Magnetic Resonance Neuroimaging at the Bedside. Front Neurol 2021; 12: 760321.
4. Plumley A, Padormo F, Cercignani M, et al. Tensors and Tracts at 64 mT. In: Proceedings of the 2023 ISMRM & ISMRT Annual Meeting & Exhibition. Toronto, ON, Canada, 2023, p. 5080.
5. Alexander DC. A general framework for experiment design in diffusion MRI and its application in measuring direct tissue-microstructure features. Magn Reson Med 2008; 60: 439–448.
6. Iglesias JE, Billot B, Balbastre Y, et al. SynthSR: A public AI tool to turn heterogeneous clinical brain scans into high-resolution T1-weighted images for 3D morphometry. Sci Adv 2023; 9: eadd3607.
7. Desikan RS, Ségonne F, Fischl B, et al. An automated labeling system for subdividing the human cerebral cortex on MRI scans into gyral based regions of interest. Neuroimage 2006; 31: 968–980.
8. Smith RE, Tournier J-D, Calamante F, et al. Anatomically-constrained tractography: Improved diffusion MRI streamlines tractography through effective use of anatomical information. Neuroimage 2012; 62: 1924–1938.
9. Jenkinson M, Bannister P, Brady M, et al. Improved Optimization for the Robust and Accurate Linear Registration and Motion Correction of Brain Images. Neuroimage 2002; 17: 825–841.
10. Xiang T, Yurt M, Syed AB, et al. DDM2: Self-Supervised Diffusion MRI Denoising with Generative Diffusion Models. In: The Eleventh International Conference on Learning Representations. 2023.
11. Tournier J-D, Calamante F, Gadian DG, et al. Direct estimation of the fiber orientation density function from diffusion-weighted MRI data using spherical deconvolution. Neuroimage 2004; 23: 1176–1185.
12. Tournier J-D, Calamante F, Connelly A. Robust determination of the fibre orientation distribution in diffusion MRI: Non-negativity constrained super-resolved spherical deconvolution. Neuroimage 2007; 35: 1459–1472.
13. Tournier J-D, Calamante F, Connelly A. Improved probabilistic streamlines tractography by 2nd order integration over fibre orientation distributions. In: Proceedings of the 2010 ISMRM-ESMRMB Annual Meeting & Exhibition. Stockholm, Sweden, 2010, p. 1670.
14. Smith RE, Tournier J-D, Calamante F, et al. Enabling dense quantitative assessment of brain white matter connectivity using streamlines tractography. Neuroimage 2015; 119: 338–351.
15. Smith RE, Tournier J-D, Calamante F, et al. The effects of SIFT on the reproducibility and biological accuracy of the structural connectome. Neuroimage 2015; 104: 253–265.
16. Rubinov M, Sporns O. Complex network measures of brain connectivity: uses and interpretations. Neuroimage 2010; 52: 1059–69.
17. Planchuelo-Gómez Á, García-Azorín D, Guerrero ÁL, et al. Structural connectivity alterations in chronic and episodic migraine: A diffusion magnetic resonance imaging connectomics study. Cephalalgia 2020; 40: 367–383.
18. Thomas Yeo BT, Krienen FM, Sepulcre J, et al. The organization of the human cerebral cortex estimated by intrinsic functional connectivity. J Neurophysiol 2011; 106: 1125–1165.
Figures