0156
Low Field MRI as a Potential Equalizer: Addressing Healthcare Disparities Through Socioeconomic Status and MRI Access in the United States1Rochester Institute of Technology, Rochester, NY, United States, 2University of Sussex, Brighton, United Kingdom
Synopsis
Keywords: Low-Field MRI, Health Care Economics, MRI value
Motivation: While the USA boasts one of the highest numbers of MRIs per million inhabitants, the impact of social determinants of health on accessibility remains uncertain. This issue becomes particularly relevant as Low Field MRI could level the playing field and mitigate existing inequities.
Goal(s): Primary goal was to investigate the relationship between MRI availability and poverty rate in the US.
Approach: We tested the correlation between poverty rate and both the quantity and geographical distribution of MRIs.
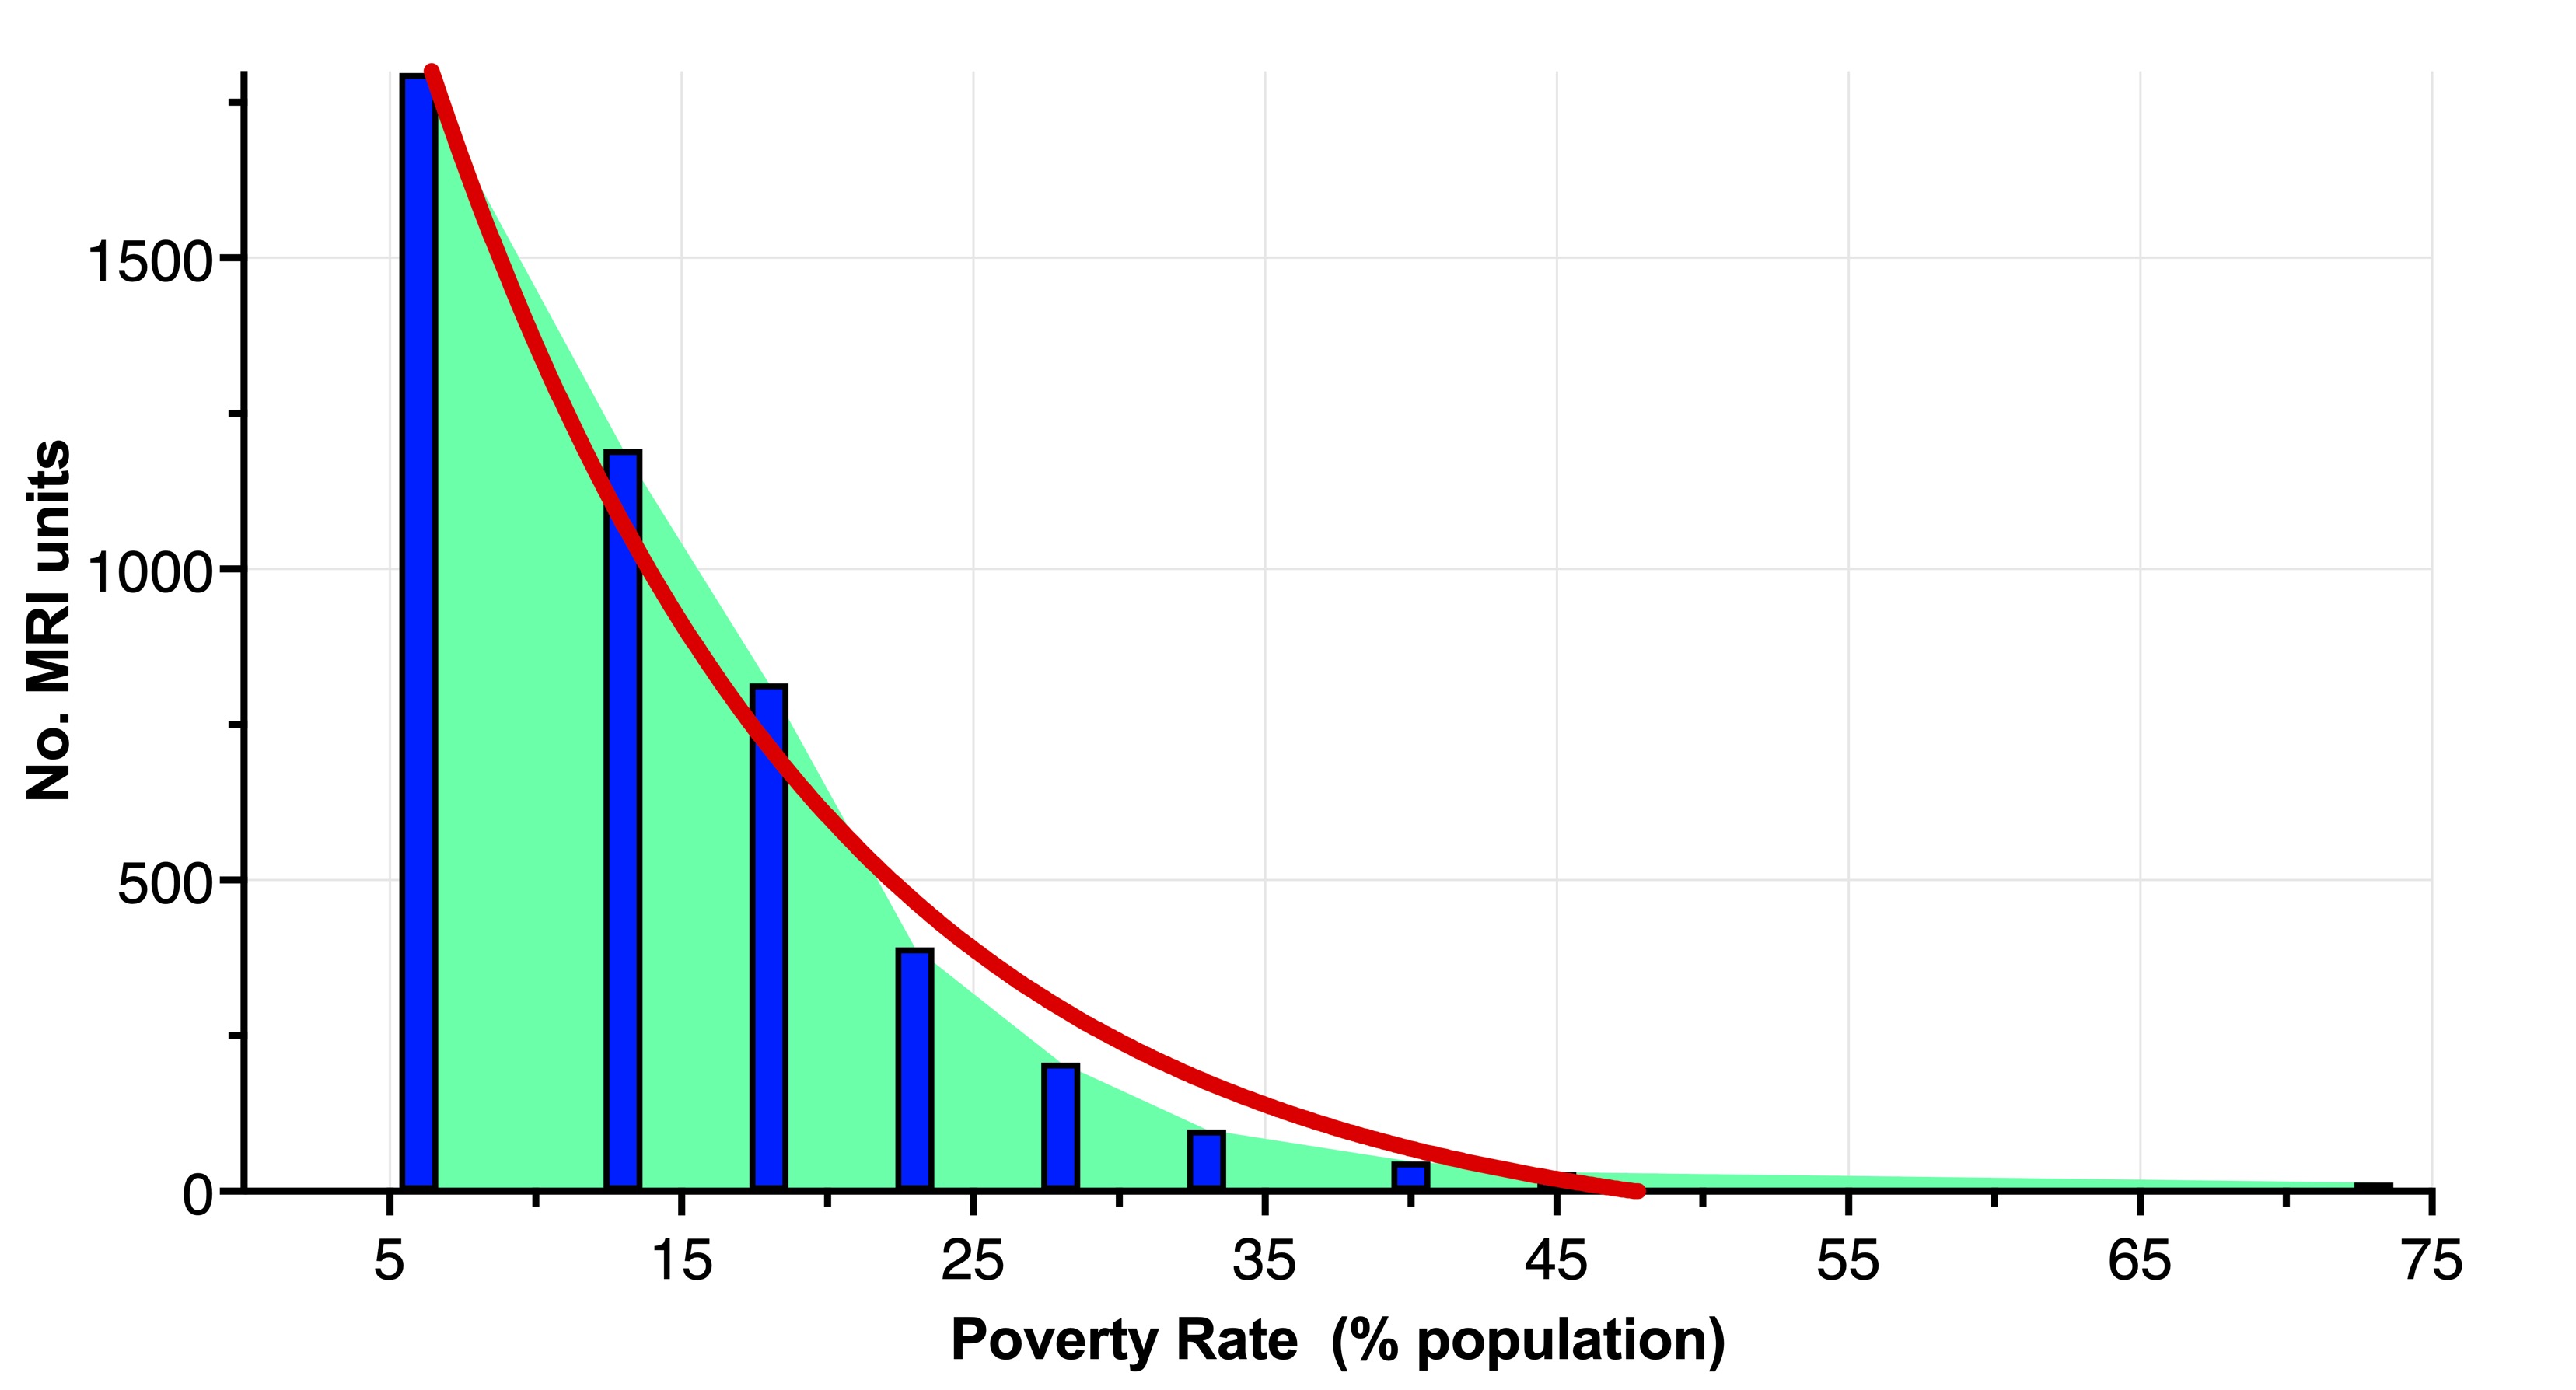
Results: The number of MRI units exhibited an exponential decline (R2=0.9823) with the poverty rate, with geographical location and other pertinent socioeconomic factors playing a role.
Impact: LF MRI has attributes that make it particularly suitable for implementation in low-middle income countries (LMICs). Nevertheless, features like affordability and portability can also potentially be pivotal in addressing healthcare disparities within the US.
Introduction
MRI technology has transformed the global healthcare landscape, emerging as an essential technology for diagnosing and evaluating a wide spectrum of diseases. Paradoxically, while MRI stands out as one of the safest and most versatile clinical imaging technologies available, the prohibitive costs and intricate maintenance requirements have rendered it virtually unattainable for a significant portion of the global population1. This accessibility gap is particularly pronounced in low and middle-income countries (LMICs)1,2. Recent breakthrough innovations in Low Field (LF) MRI have paved the way for promising solutions to address the disparities in MRI access on a global scale. LF MRI stands out for its cost-effectiveness, portability, low-maintenance requirements, and ability to function without the need for cryogens, special siting, or additional power infrastructure2. These qualities position LF MRI as an ideal candidate for meeting the clinical needs of LMICs, where healthcare resources are limited. However, while over 90% of MRI systems are concentrated in high-income countries3, it is likely that cost remains a barrier to MRI access especially for those lacking insurance or facing other challenges such as distance from imaging facilities, high insurance deductibles, or inadequate insurance coverage. For example, average patient cost for an MRI in the United States (US) stands at about $1,325, with specific scans, like breast imaging, commanding prices as high as $10,3004. Moreover, a conventional MRI unit commonly found in hospitals (1.5T or 3.0T) carries a price tag exceeding $1 million, which further underscores the urgency of addressing the accessibility issues surrounding MRI. Whether LF MRI can help alleviate healthcare disparities in countries like the US, where MRI systems are abundant —there are 38 MRI units per million inhabitants, ranking the US second only to Japan with 57 units4— remains uncertain. To this end, we investigated the relationship between MRI availability (in terms of quantity and geographical location) and socioeconomic status within the US. Our overarching goal is to pinpoint the challenges related to MRI accessibility in the US, thereby laying the groundwork for the potential use of LF MRI to tackle these issues.Methods
US MRI distribution data were obtained using the 2023 database from the IMV Medical Information Division of Science and Medicine Group5. The database is organized based on the following categories:- MRI facility (address, accreditation number, Medicare provider number, population size in 2020, projected population size in 2025, and spending potential index).
- Number of MRI units, including field strength, manufacturer, model, bore type, the year the unit was installed, and service provider.
- Number of MRI units per Zip Code.
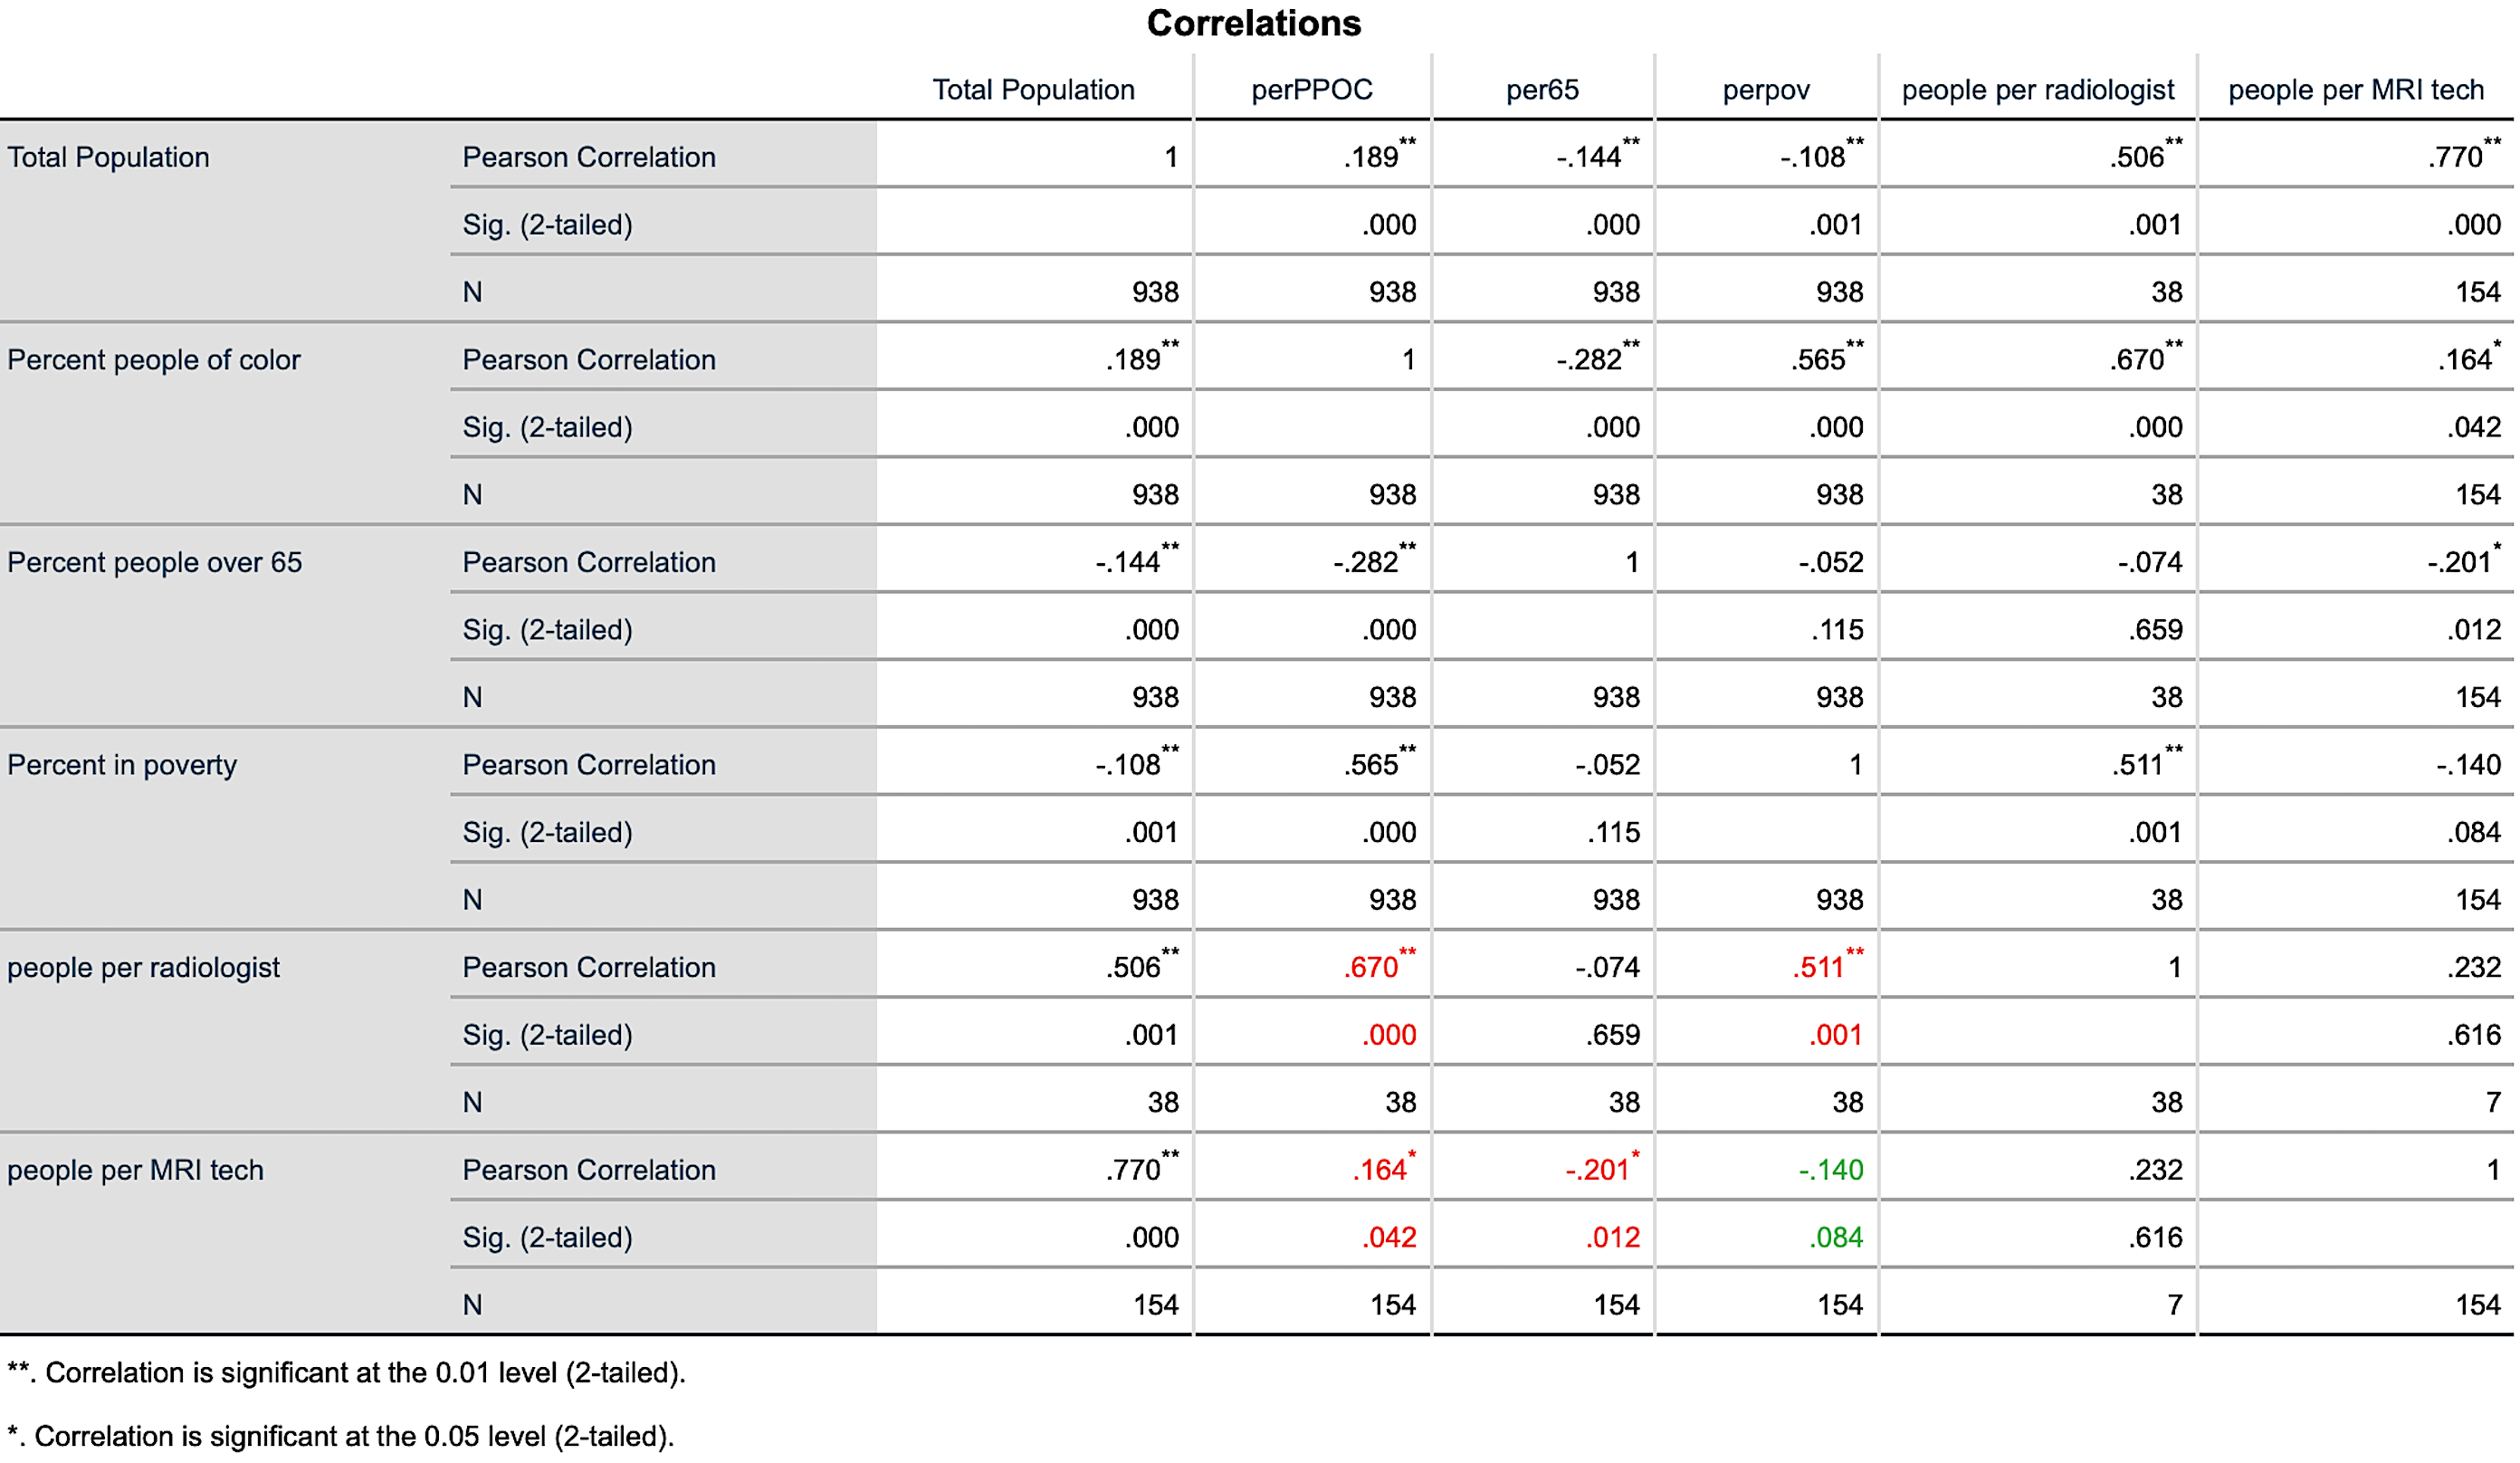
Data Analyses: A nonlinear least squared curve-fitting was performed to test the relationship between the number of MRI scanners and poverty rate expressed as percent of population living in poverty. Furthermore, pearson correlation coefficients were computed to assess the relationship between the number of MRI specialists (radiologists and MRI technologists) and various demographic factors of poverty.
Results
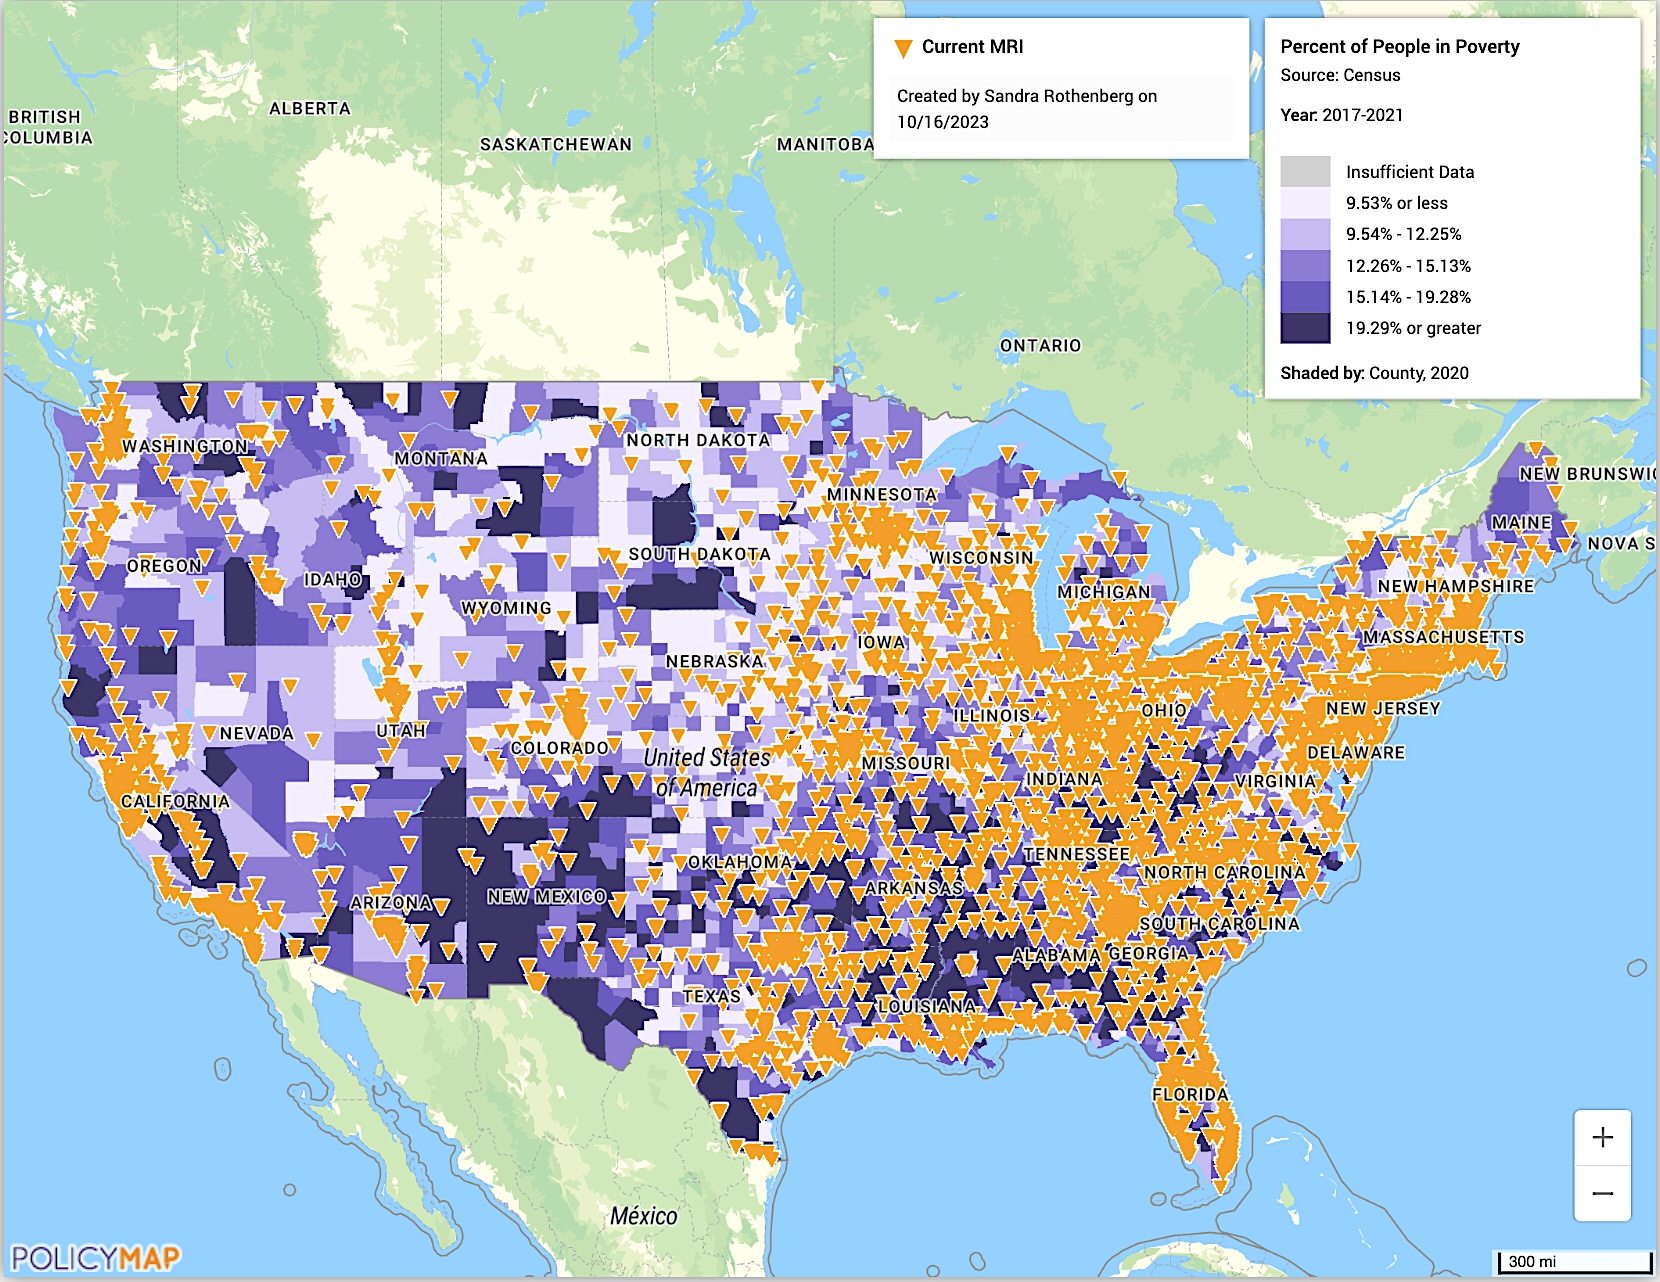
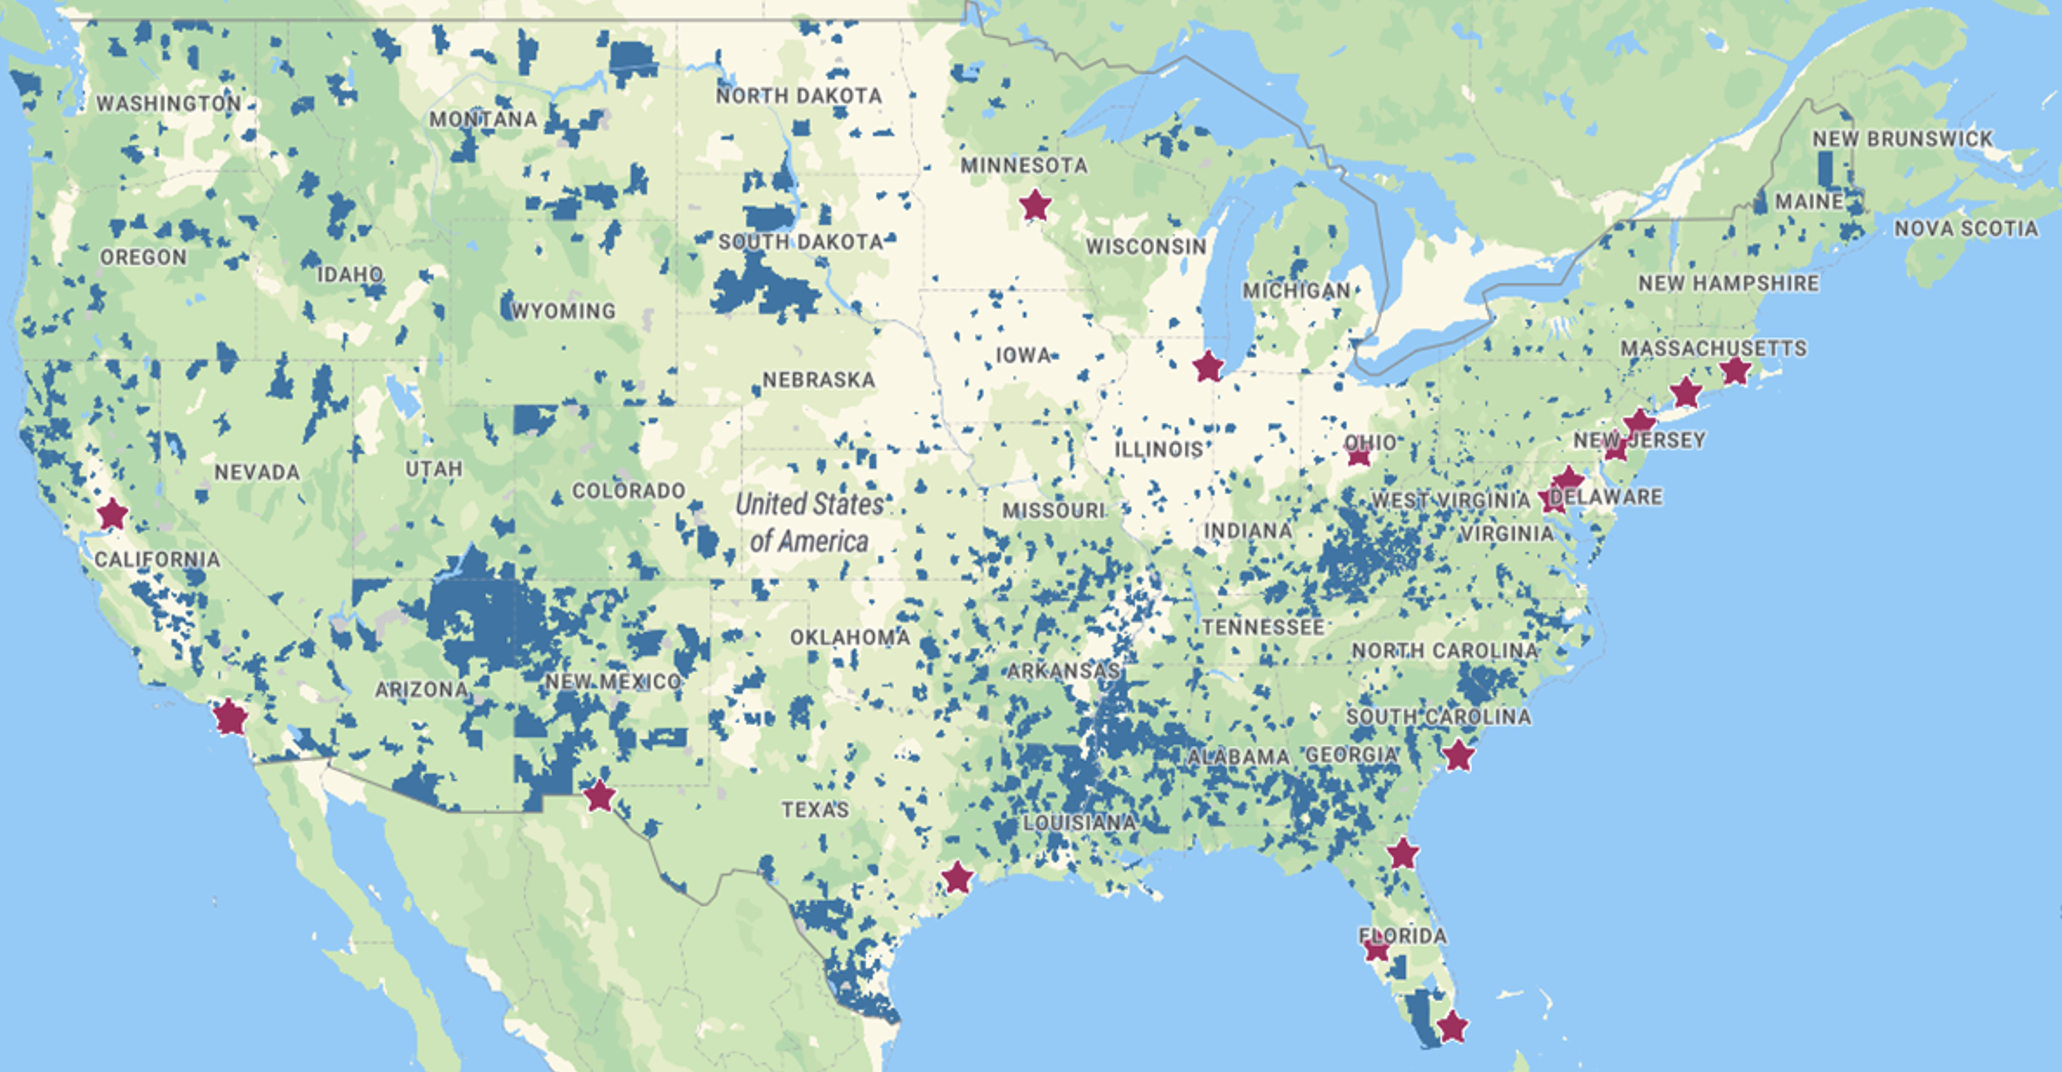
There was a significant correlation between the number of MRIs and poverty, with an exponential decay (Figure-1) providing the best fit (R2 = 0.9823). Figure-2, showing the geographical distribution of MRIs across the US superimposed with poverty rates, suggests that impoverished regions beyond major metropolitan areas have distance as an additional barrier to MRI access. This includes access to LF scanners, Figure-3. There was a significant inverse correlation between number of people per radiologist and both the percent of people living in poverty and percent of people of color, see detains in Table-1.Conclusions, Limitations, and Future work
The findings indicate a correlation between poverty and MRI accessibility in the US, with geography also playing an essential role. Given the cost-effectiveness and portability of LF MRI, there is a clear imperative for the adoption of LF MRI as point-of-care systems in the US. It is essential to emphasize, however, that these results are based on a somewhat simplified model, which is partly due to difficulties in obtaining comprehensive healthcare databases necessary for constructing a more accurate model. Further research is warranted to develop a statistical model that better captures the multifaceted dimensions of poverty metrics and healthcare disparities.Acknowledgements
No acknowledgement found.References
1U. Anazodo, et al., NMR in Biomedicine, Vol 36(3), 2022; 2A. G. Webb & J. Obungoloch, Nature 2023; Y Liu, et al., Nat Comm. 2021; 4OECD, Magnetic resonance imaging (MRI) units (indicator). doi: 10.1787/1a72e7d1-en, 2023; 5IMV Medical Information Division, Arlington, VA, USA; 6www.policymap.com
Figures