0150
Fast mapping of simultaneous M0, T1, T2, T2*, B1, and ΔB0 using SSFP-based Multiple Overlapping-Echo Detachment Imaging1Xiamen University, Xiamen, China, 2Department of Radiology, Zhongshan Hospital (Xiamen) Fudan University, Xiamen, China, 3Clinical & Technical Support, Philips Healthcare, China
Synopsis
Keywords: Pulse Sequence Design, Quantitative Imaging
Motivation: Long acquisition times have hindered many quantitative magnetic resonance imaging methods.
Goal(s): In order to reduce the collection time, we propose a rapid and quantitative method for multi-parameter quantification.
Approach: Multiple overlapping echo detachment (MOLED) imaging can enable multiparametric quantitative mapping for a single slice in just hundreds of milliseconds. To achieve simultaneous quantitative imaging of M0, T1, T2, T2*, B1, and ΔB0, we proposed the SSFP-MOLED method.
Results: The results of both phantom and vivo experiments on a 3T whole-body scanner demonstrate that our method can accurately quantify multiple parameters, indicating promising clinical applications.
Impact: We present a novel and efficient mapping method for multiparametric MRI (M0, T1, T2, T2*, B1, and ΔB0). This method not only enhances the efficiency of data collection for clinicians but also improves the diagnostic reliability of multi-center hospitals.
Introduction
Multi-parametric quantitative magnetic resonance imaging (mqMRI) is a powerful tool for precision medicine and quantitative analysis of clinical diseases. It facilitates the integration and analysis of imaging data from multiple centers. Currently, the main challenge facing quantitative imaging in clinical applications is the long acquisition time. The multiple overlapping echo detachment (MOLED) imaging method fills multiple different echo signals in the same K-space, making mqMRI available in more in 100 milliseconds1,2. However, MOLED is based on echo planar imaging (EPI) acquisition, thus it may be sensitive to serious field inhomogeneity and remnant fat signal. In this study, we combined MOLED with Steady-State Free Precession (SSFP) for the first time to overcome the above challenges. Our experimental results demonstrate that the proposed method can achieve accurate and rapid quantification of M0, T1, T2, T2*, B1, and ΔB0 simultaneously.Methods
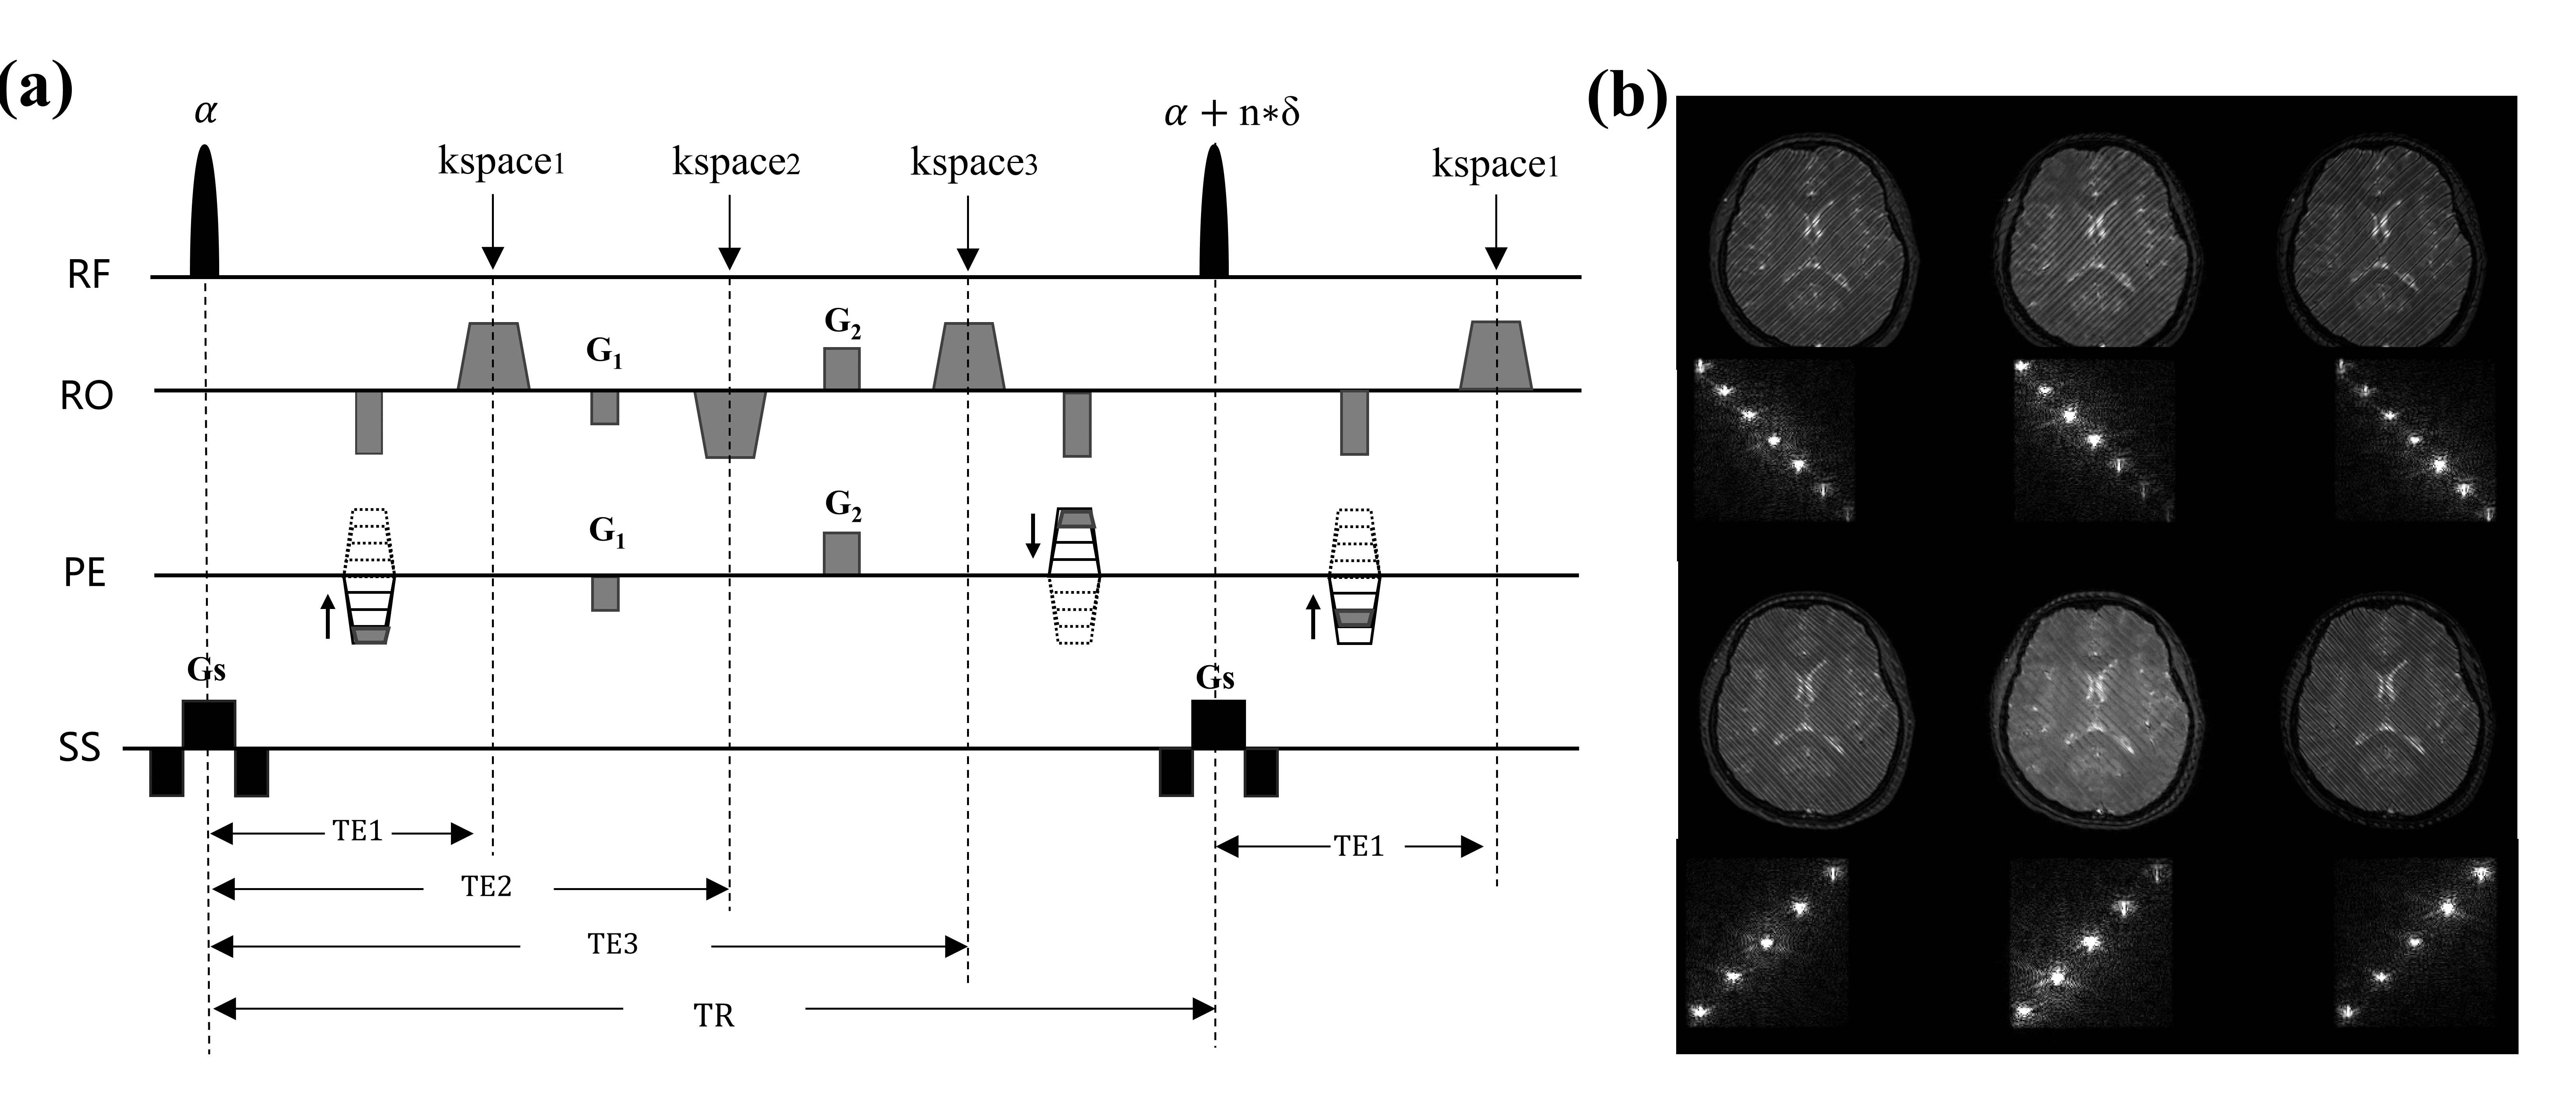
Pulse Sequence: The SSFP-MOLED sequence is illustrated in Figure 1(a). Echo-shifting gradients (G1 and G2) are applied to shift the echoes from the center of k-space along the phase-encoding and frequency-encoding directions. The angle of the excitation pulse is incremented by a constant step size (δ) for each repetition. Figure 1(b) shows the SSFP-MOLED image and k-space, where the number of echoes and the echo interval in k-space are determined by the shift gradients G1 and G2. Different echoes contain distinct modulation information. In this study, we collected data twice with different shift gradients and initial excitation pulse angles to obtain more information while keeping other parameters the same.Phantom Experiments: Data acquisition was performed using a 3.0T whole-body MRI system (Ingenia CX, Philips Healthcare) that was equipped with a 32-channel head coil. The parameters of SSFP-MOLED were set as follows: TR = 12ms, TE1 = 3ms, Echo Spacing = 3ms, matrix size = 128×128, BW = 2077.7 Hz/pixel, slice thickness = 3mm, FOV = 220mm × 220mm, and δ=0.01. For acquisition1, the flip angle was set to α = 18°, and G1=-0.2×GACQ, where GACQ represents the sampling gradient. For acquisition2: α = 20°, G1=0.15×GACQ. The acquisition time of two acquisitions was 3.19 seconds per slice.
Reference T1 maps were derived from IR-TSE images (TR = 5s, TE = 17ms, TI = 50, 100, 200, 400, 800, 1600, and 3200ms), and it took 19 min for T1 mapping. Reference T2 maps were derived from SE images (TR = 4 s, TEs = 20, 40, 60, 100, and 150ms), and it took 34 min for T2 mapping. Reference T2* maps were obtained from a multi-echo GRE sequence with a flip angle of 30°, TE=5, 15, 25, 35, 45, 55, 65, and 75ms, TR=4.5 s, and it took 4 min 48s for T2* mapping.
In vivo Experiments: The protocols for SSFP-MOLED sequence parameters in vivo experiments were the same as those for in the phantom scans.
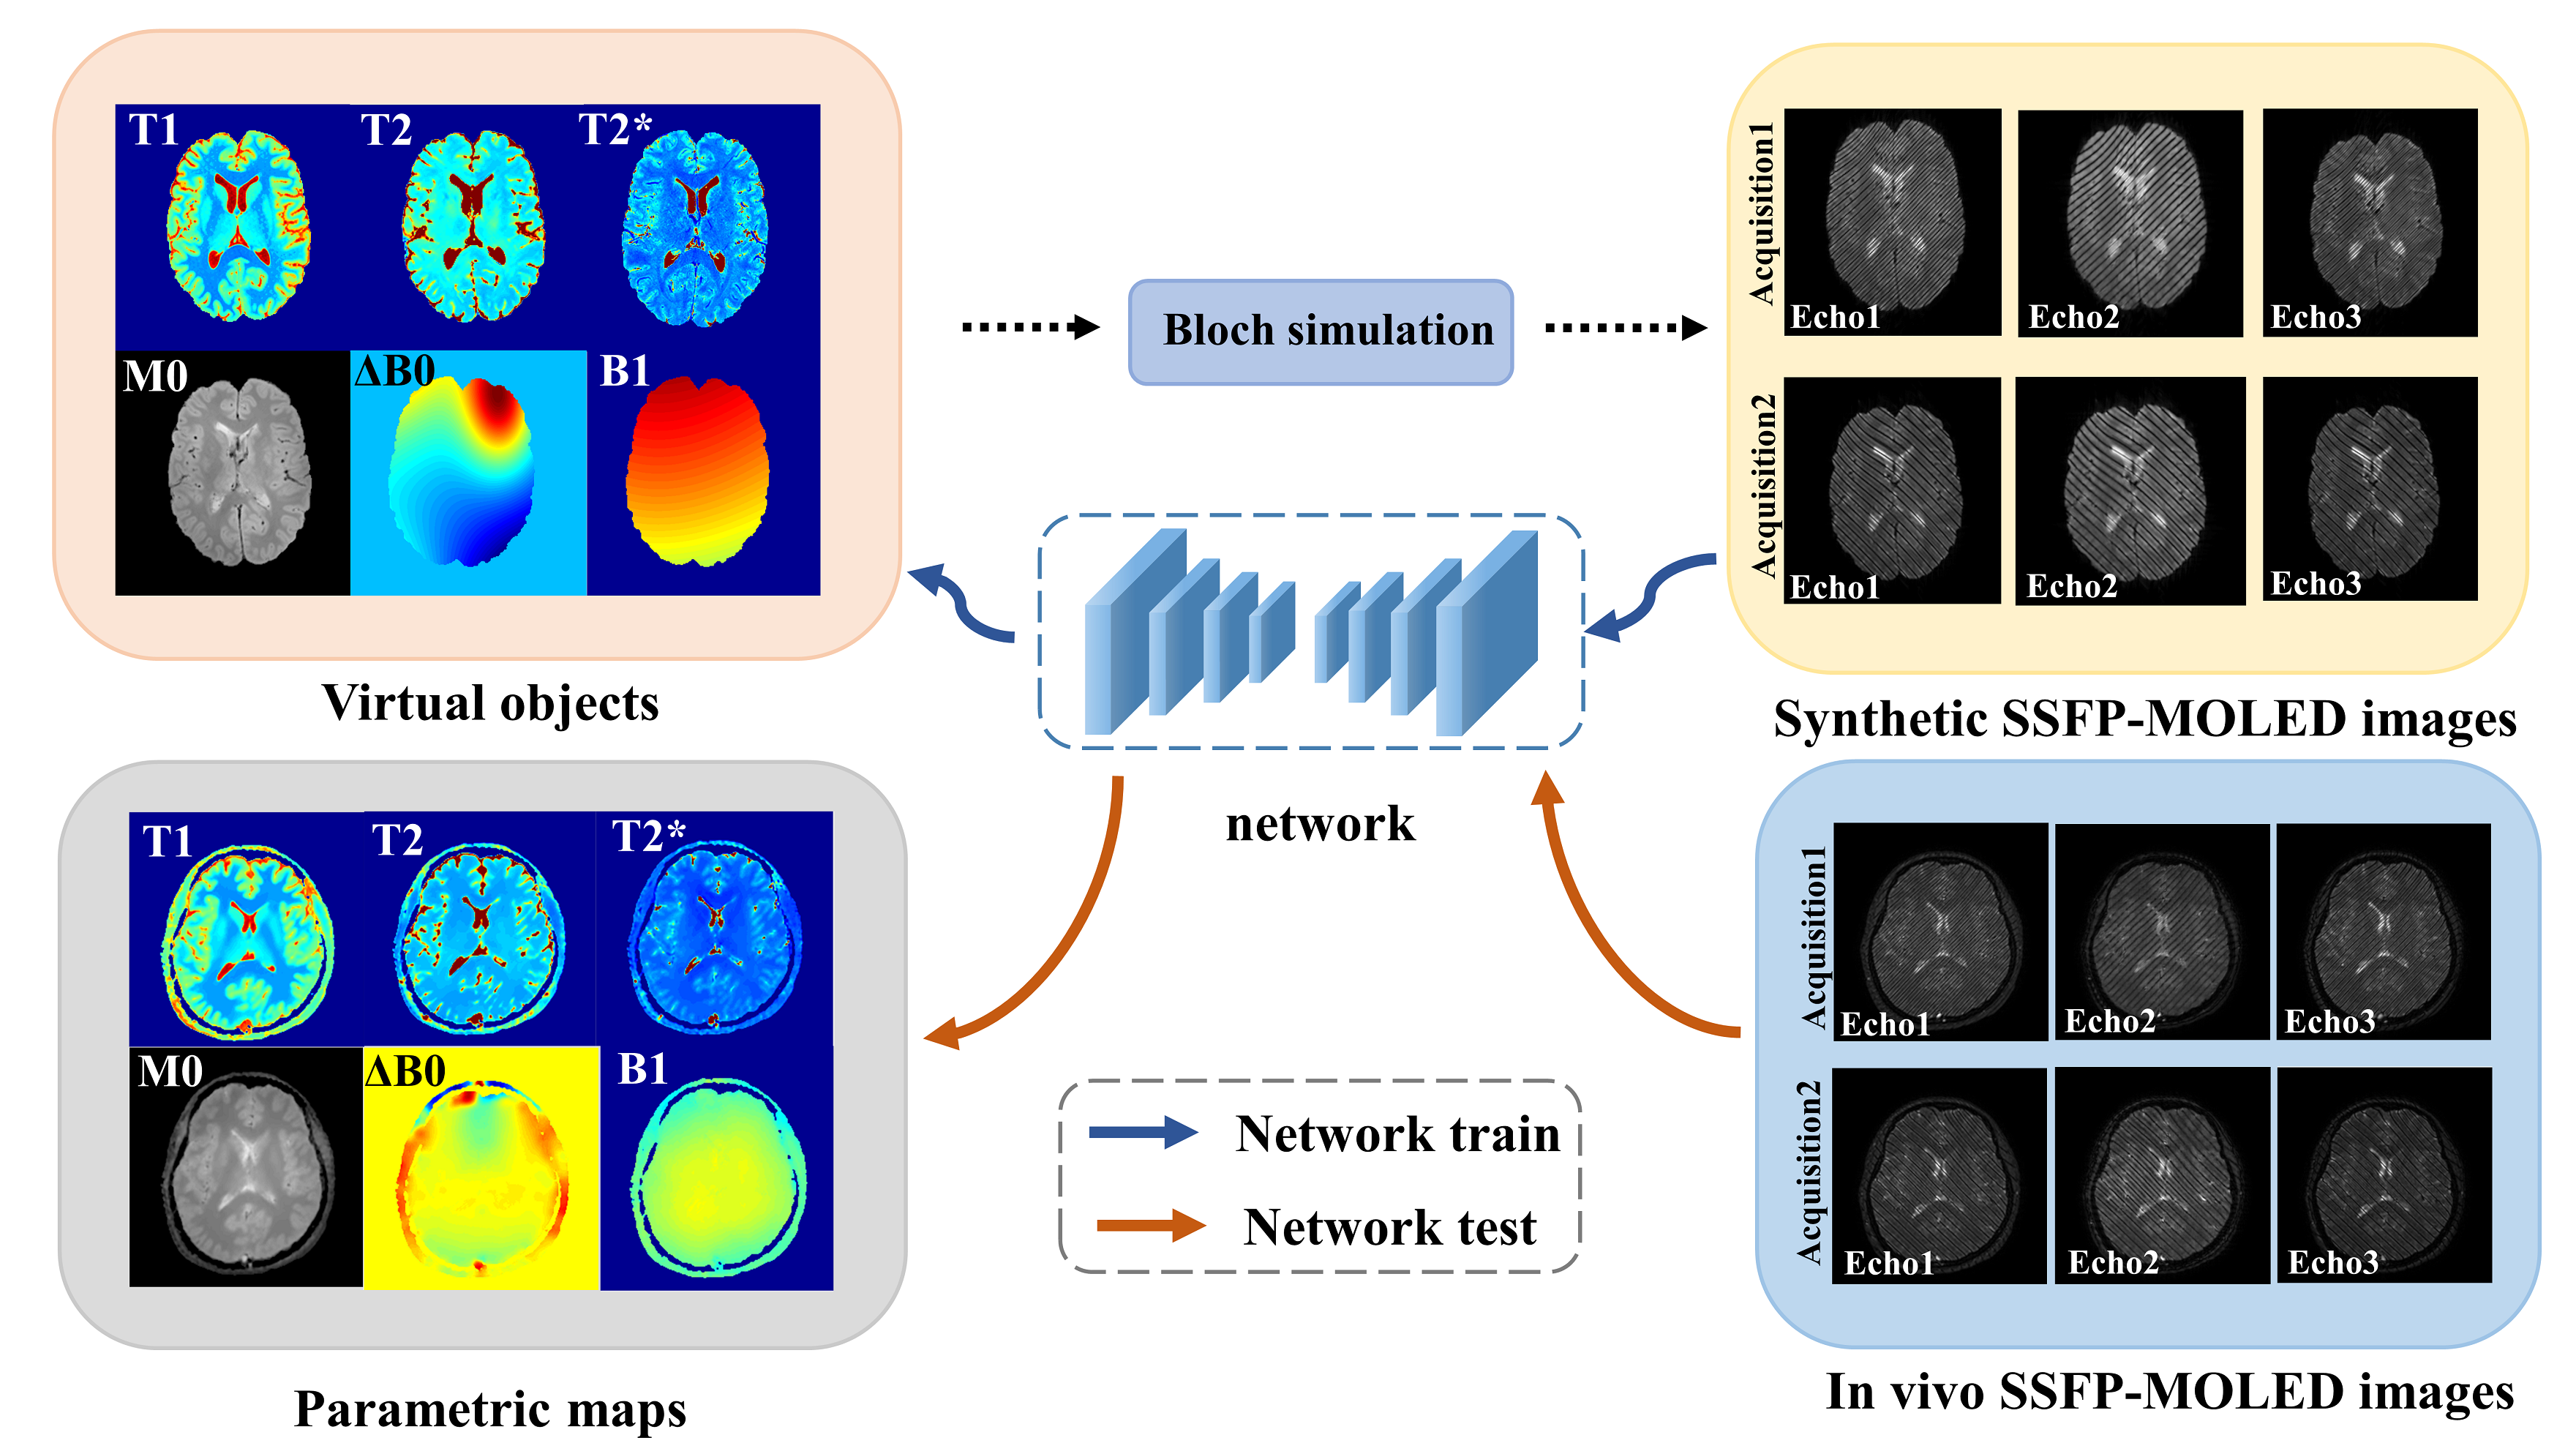
Network and training data generation: Figure 2 presents a flowchart outlining the multi-parametric quantification process using the SSFP-MOLED method. The training set consists of paired samples obtained from synthetic data, and the SSFP-MOLED sequence synthetic data is generated by MRiLab3. Further details about the synthetic sample can be found in the literature4–6. The U-Net7 is employed to reconstruct the quantitative parameters, including M0, T1, T2, T2*, B1, and ΔB0. Specifically, the real and imaginary parts of the data collected twice with different parameters are utilized as the input of the network, which consists of 12 channels. The output of the network is the estimated quantitative parameters, which are represented by 6 channels.
Results
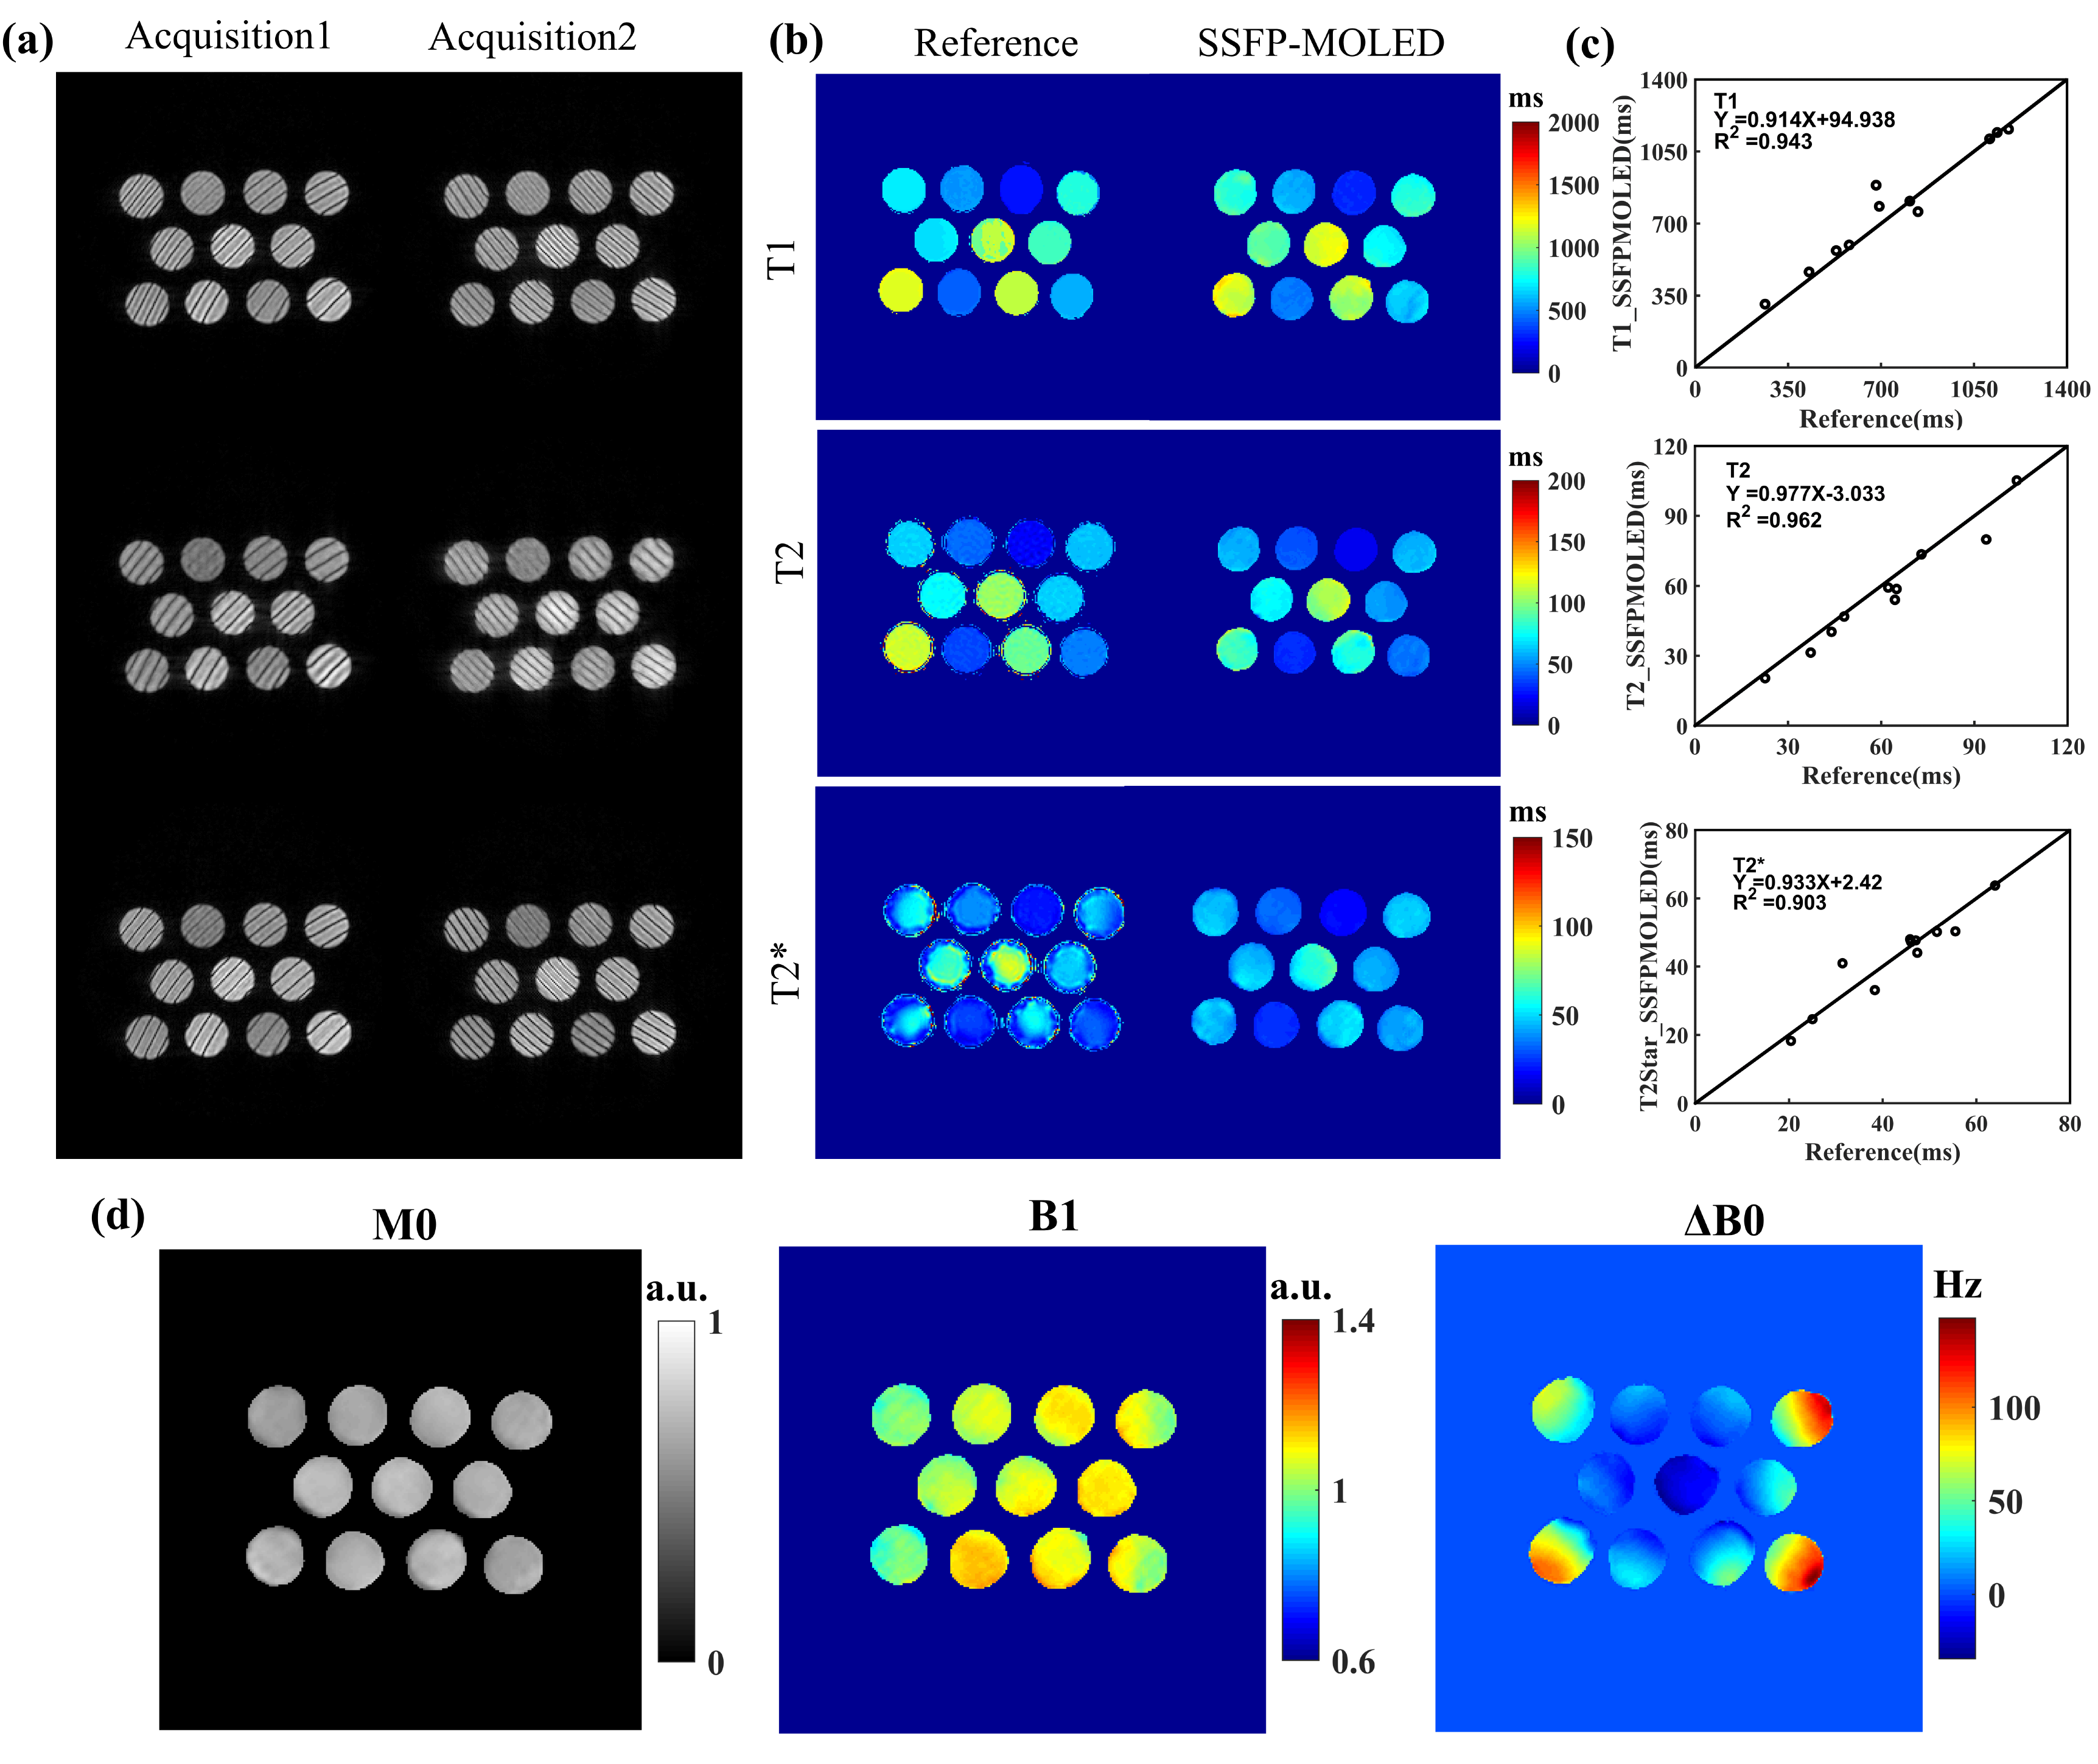
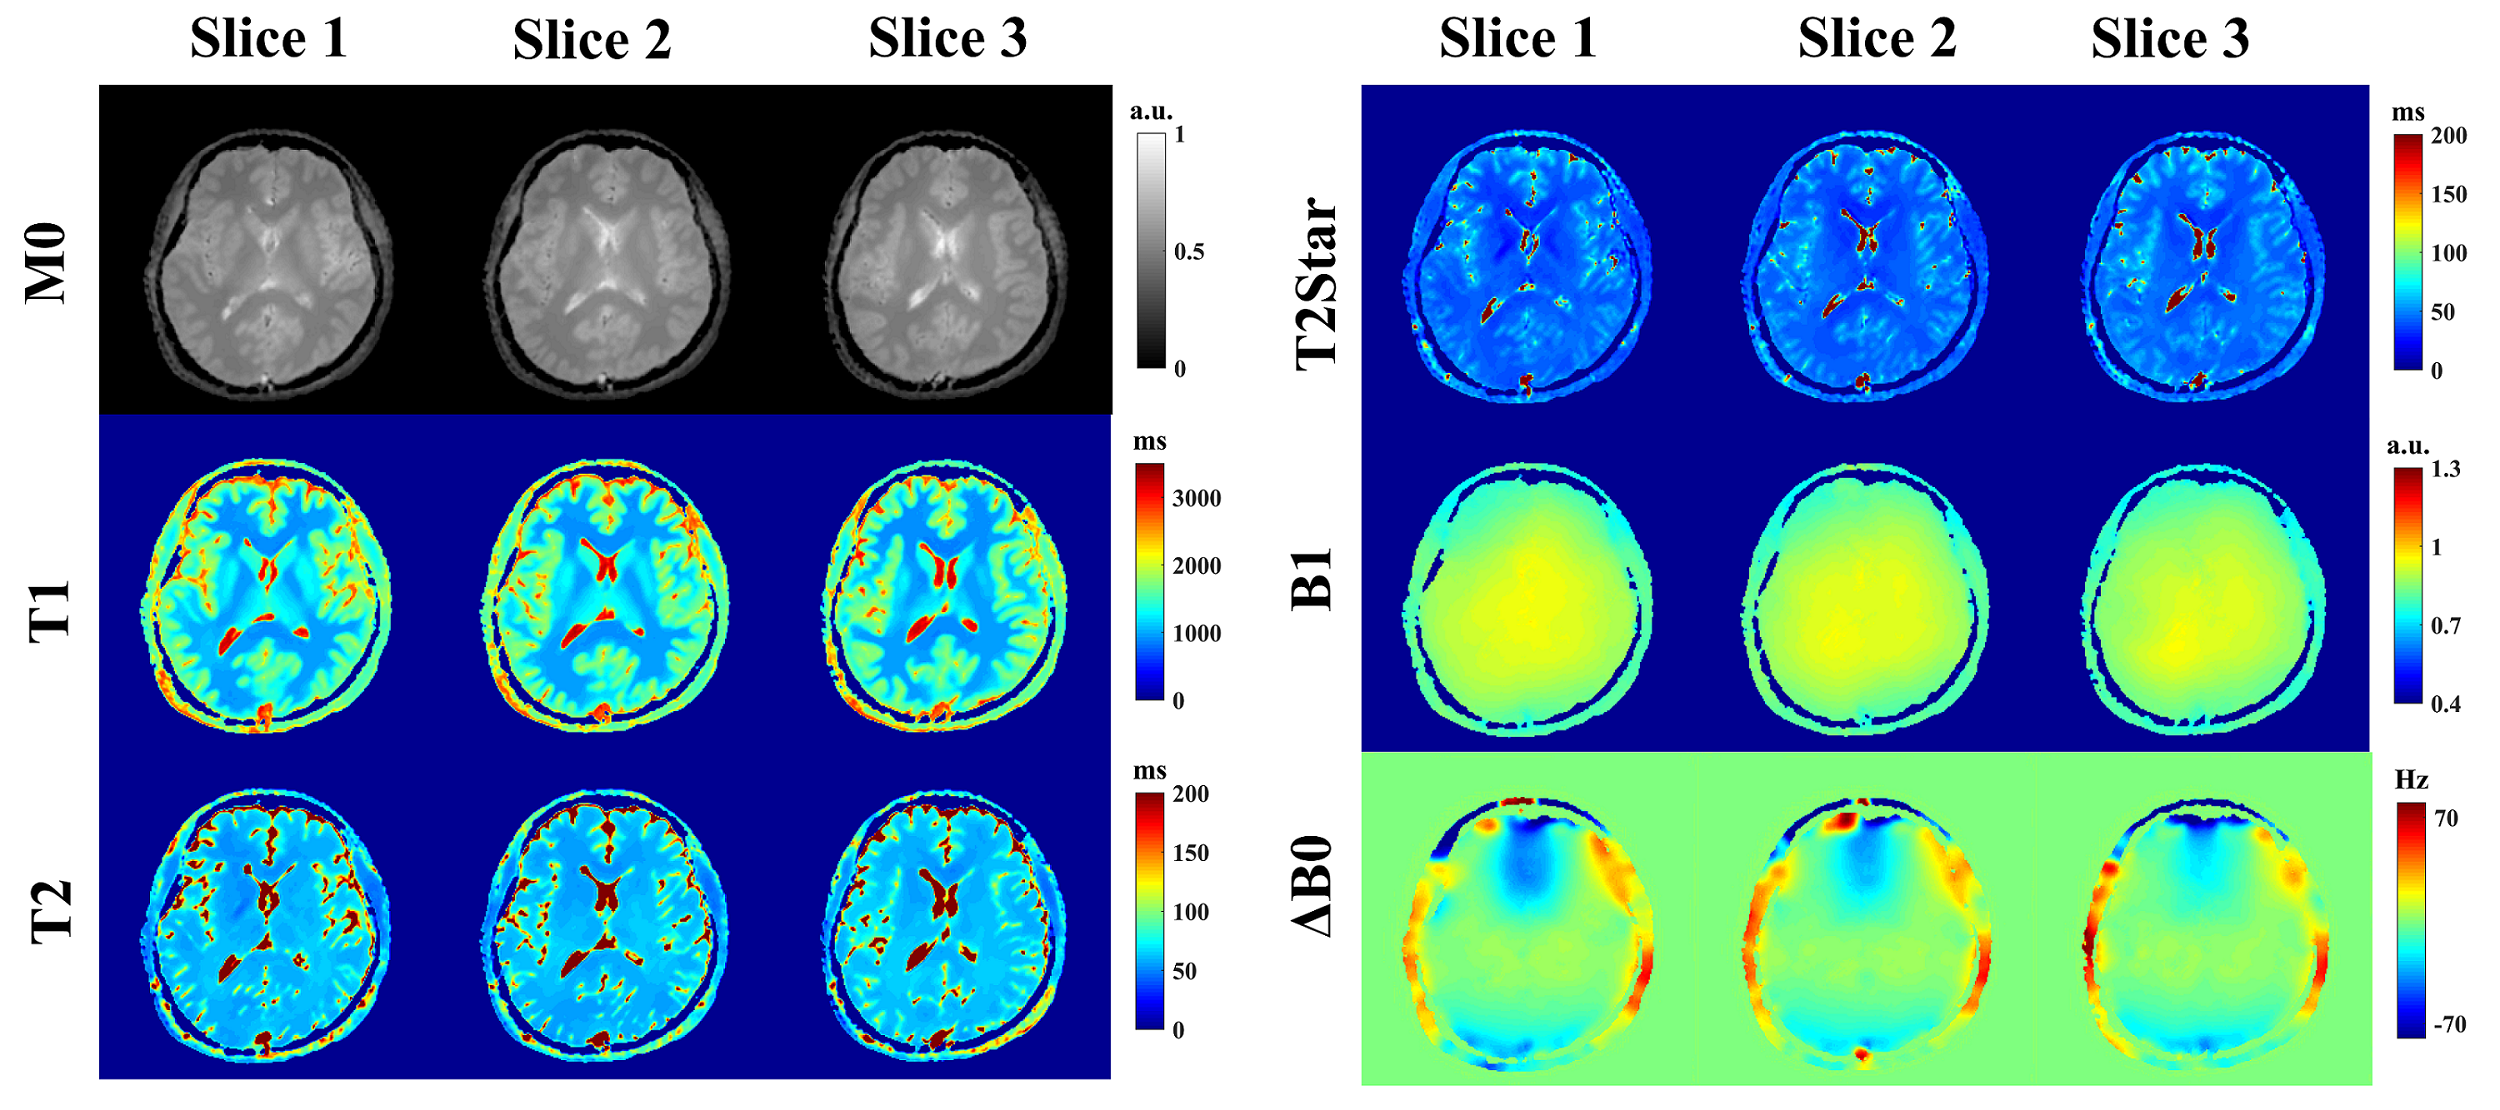
The results of the phantom experiment are presented in Figure 3. The mean value was calculated from the circular region of interest (ROI). The slope and y-intercepts of the linear regression between the reference values of T1, T2, T2* and the SSFP-MOLED values were 0.914 and 94.938 (R² = 0.943), 0.977and -3.033 (R² = 0.962), 0.933 and 2.42 (R² = 0.903), respectively. The results of the in vivo experiment are presented in Figure 4. As demonstrated by the phantom experiment, the quantitative outcomes of our proposed method are reliable. Referring to the results of some previous quantitative studies 5,8, the quantification of M0, T1, T2, T2*, B1, and ΔB0 using the proposed method can be considered reasonable.Discussion and Conclusion
In this study, we proposed and validated a novel mqMRI method that enables simultaneous quantification of multiple parameters, including M0, T1, T2, T2*, B1, and ΔB0. The acquisition time for 21 slices is 68 seconds without the use of any acceleration techniques. Additionally, our approach can be further accelerated in the future.Acknowledgements
This work was supported by the National Natural Science Foundation of China under grant numbers 82071913References
1. Cai CB, Zeng YQ, Zhuang YC, et al. Single-Shot T2 Mapping Through OverLapping-Echo Detachment (OLED) Planar Imaging. IEEE Transactions on Biomedical Engineering. 2017;64(10):2450-2461.
2. Cai CB, Wang C, Zeng Y, et al. Single-shot T2 mapping using overlapping-echo detachment planar imaging and a deep convolutional neural network. Magnetic Resonance in Medicine. 2018;80(5):2202-2214.
3. Liu F, Velikina JV, Block WF, Kijowski R, Samsonov AA. Fast Realistic MRI Simulations Based on Generalized Multi-Pool Exchange Tissue Model. IEEE Transactions on Medical Imaging. 2017;36(2):527-537.
4. Yang QQ, Lin YH, Wang JC, et al. MOdel-Based SyntheTic Data-Driven Learning (MOST-DL): Application in Single-Shot T2 Mapping With Severe Head Motion Using Overlapping-Echo Acquisition. IEEE Transactions on Medical Imaging. 2022;41(11):3167-3181.
5. Ma LC, Wu J, Yang QQ, et al. Single-shot multi-parametric mapping based on multiple overlapping-echo detachment (MOLED) imaging. NeuroImage. 2022; 263:119645.
6. Yang QQ, Wang Z, Guo K, Cai CB, Qu XB. Physics-Driven Synthetic Data Learning for Biomedical Magnetic Resonance: The imaging physics-based data synthesis paradigm for artificial intelligence. IEEE Signal Processing Magazine, Signal Processing Magazine, IEEE, IEEE Signal Process Mag. 2023;40(2):129-140.
7. Ronneberger O, Fischer P, Brox T. U-Net: Convolutional Networks for Biomedical Image Segmentation. In: Navab N, Hornegger J, Wells WM, Frangi AF, eds. Medical Image Computing and Computer-Assisted Intervention – MICCAI 2015. Vol 9351. Lecture Notes in Computer Science. Springer International Publishing; 2015:234-241.
8. Wang FYX, Dong ZJ, Reese TG, Rosen B, Wald LL, Setsompop K. 3D Echo Planar Time-resolved Imaging (3D-EPTI) for ultrafast multi-parametric quantitative MRI. NeuroImage. 2022; 250:118963.
Figures