0147
In Vivo Monitoring of Renal Tubule Volume Fraction During Acute Tubular Pressure Increase Using Dynamic T2 Mapping1Berlin Ultrahigh Field Facility (B.U.F.F.), Max Delbrueck Center for Molecular Medicine in the Helmholtz Association, Berlin, Germany, 2Charité – Universitätsmedizin, Berlin, Germany, 3Hasso Plattner Institute for Digital Engineering, University of Potsdam, Germany, Potsdam, Germany, 4Experimental and Clinical Research Center, a joint cooperation between the Charité Medical Faculty and the Max Delbrück Center for Molecular Medicine, Berlin, Germany
Synopsis
Keywords: Quantitative Imaging, Kidney, tubule volume fraction, MRI, T2 mapping, multi-exponential analysis
Motivation: The increasing incidence of kidney diseases is a global concern and current biomarkers are inadequate. Changes in renal tubule volume fraction (TVF) may serve as a rapid biomarker for kidney disease and provide a better understanding of renal (patho-)physiology.
Goal(s): This study aims to measure TVF in in vivo rat kidney during acute tubular pressure increase.
Approach: This study uses the amplitude of the long T2-component as a surrogate for TVF in rats, by applying multiexponential analysis of the T2-driven signal decay.
Results: The results demonstrate that our approach is promising for research into quantitative assessment of renal TVF in in vivo applications.
Impact: This is the first report on in vivo assessment of relative changes in the renal TVF, which provides a potential rapid, noninvasive marker for kidney disease. This approach will be invaluable for gaining a better mechanistic understanding of renal (patho-)physiology.
Introduction
The increasing incidence of kidney diseases is a global concern. Current diagnostic tools and therapies for renal disease are inadequate. Changes in the renal tubule volume fraction (TVF) may serve as a marker for kidney disease and provide a better understanding of renal (patho-)physiology1. T2 mapping, an established MRI technique, can quantify changes in tissue water fraction noninvasively2. This study is the first report on in vivo assessment of relative changes in the renal tubular volume fraction as a (patho)physiological metric and uses T2 mapping in conjunction with bi-exponential analysis of the T2 decay to determine relative changes TVF during acute renal pelvis/tubular pressure increase, which is a clinically relevant intervention.Methods:
Tubular fluid, which originates from ultrafiltration in the glomeruli, has a substantially longer T2 compared to the renal parenchyma. Therefore, the tubular contribution to the signal should be separable from the parenchyma signal by nonlinear least squares regression. The numerical solution for multi-exponential decomposition was done using MATLAB functions. The algorithm was evaluated using synthetic data simulations and measurements in phantoms. Since in vivo experiments are always limited by the constraints of acquisition time, spatial resolution and SNR, we evaluated the multi-exponential decomposition approach in simulations using a broad range of conditions of T2 mapping. A phantom was designed to mimic relative changes of TVF in the rat kidney (Fig.1). Water was doped with MnCl2 and CuSO4 to achieve T1 and T2 times similar to the tubular fluid and the renal parenchyma. This was followed by a proof-of-principle demonstration using in vivo data obtained during a transient increase of renal pelvis and tubular pressure in rats (Fig.2). MRI data were acquired on a 9.4 Tesla small animal MR system (Bruker Biospec 94/20, Bruker Biospin, Ettlingen, Germany) using a linear radiofrequency (RF) volume resonator and a 4-channel surface RF coil array tailored for rats (Bruker Biospin). For T2 mapping a multi-echo spin-echo technique (TR=500ms, number of echoes=13, first TE=6.4ms, interecho time ΔTE=6.4ms, number of averages=1, tacquisition=58s) was employed. For T2 mapping a mid-coronal oblique slice was acquired (in-plane spatial resolution=(226×445) µm2, FOV=(38.2×50.3) mm2, matrix size=169×113, slice thickness=1.4mm).Results:
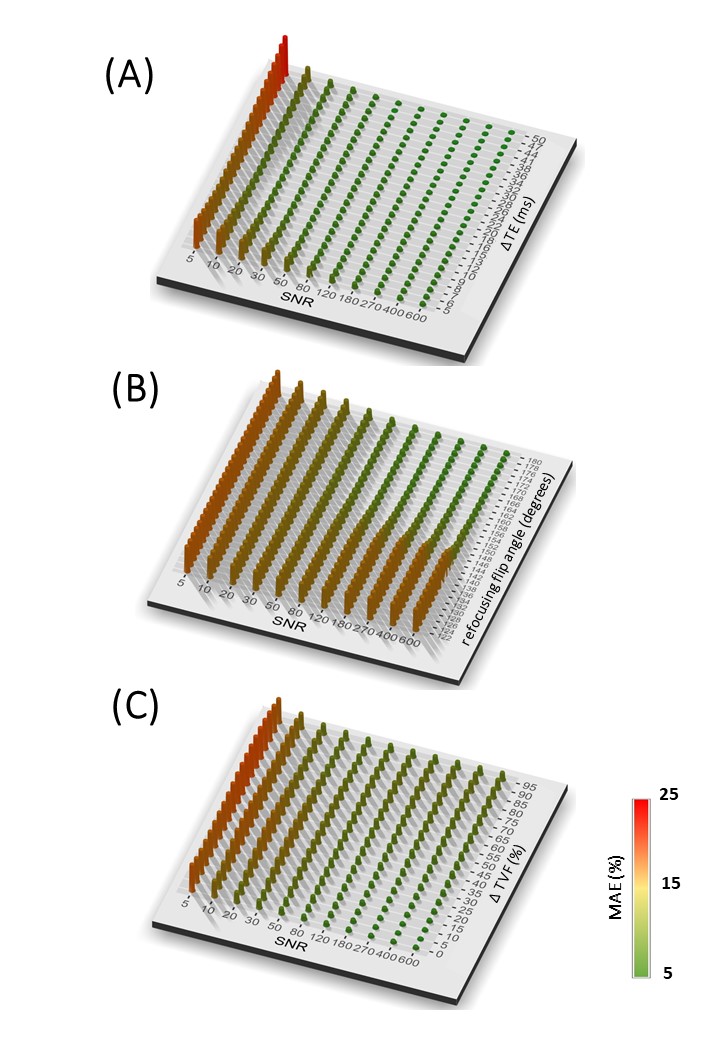
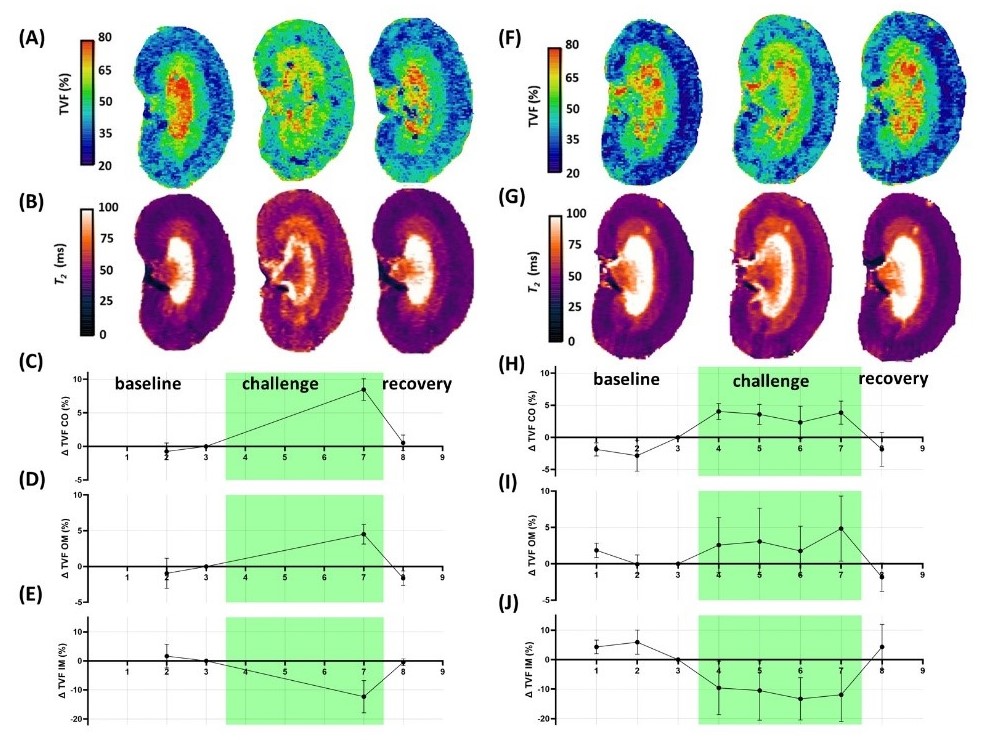
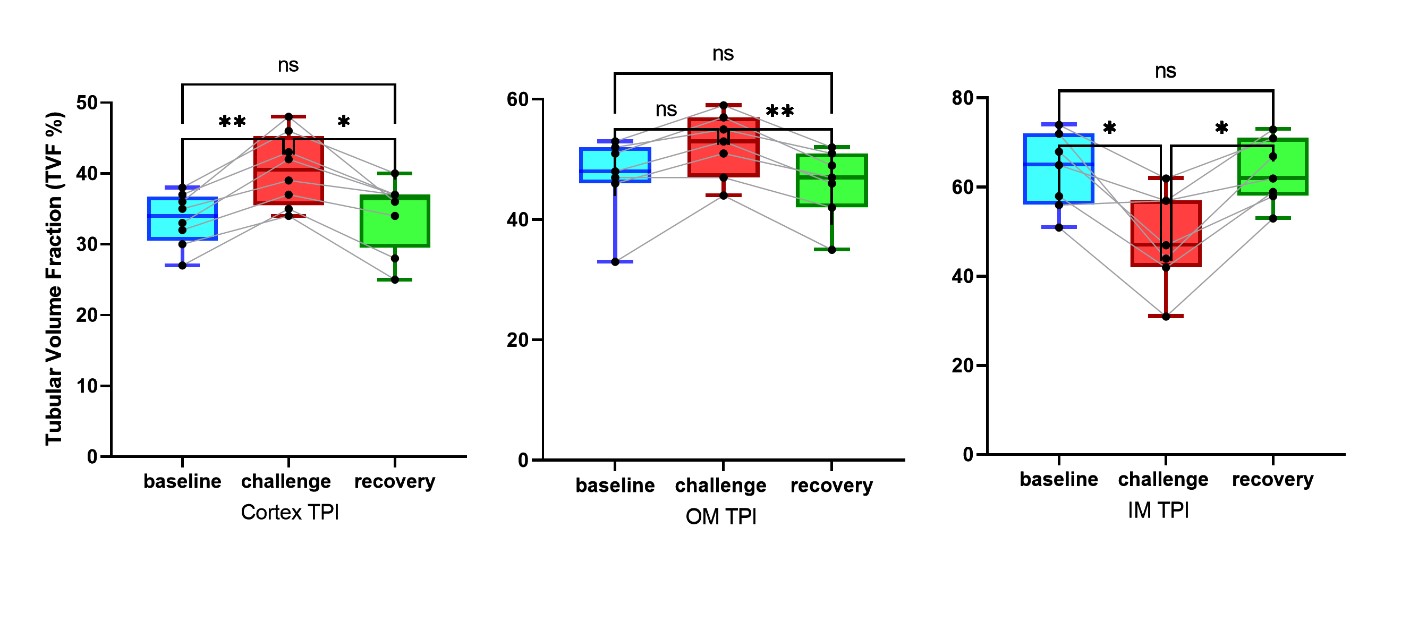
Fig.3 demonstrates the impact of SNR and A.echo-spacing, B.flip-angle C.TVF on the TVF estimation. Using a high accuracy imaging protocol (TR=4s, number of echoes=13, first TE=15ms, ΔTE=15ms, number of averages=3, tacquisition=47min), our approach achieved a high accuracy on the phantom. Since in vivo experiments are limited by acquisition time constraints we developed an accelerated protocol tailored for in vivo T2 mapping of the rat kidney (TR=500ms, number of echoes=13, first TE=6.4ms, inter-echo time ΔTE=6.4ms, number of averages=1, arefocusing pulse=180°, tacquisition=58s), which resulted in an accuracy of MAE<3%. Fig.1C shows a T2 map obtained for the phantom. The histogram (Fig. 1D) shows the T2 distribution for the selected ROI. Changes in the ratio of the volume fraction of the two compartments were achieved by changing the ROI size. Fig.1E shows TVF measured for the high accuracy protocol and for the accelerated protocol customized for the in vivo study. Fig.4 shows representative quantitative TVF maps obtained for baseline, transient pelvis and tubular pressure increase, and recovery. Transiently increasing pressure in the renal pelvis and tubules induced significant changes in TVF in renal compartments: ΔTVFcortex=5.2%, ΔTVFouter medulla =2.6%, and ΔTVFinner medulla =-14.2% (Fig.5).Discussion:
This is the first report on in vivo estimation of the physiological metric renal tubular volume fraction. We demonstrate the feasibility of dynamic parametric mapping of the MRI relaxation time T2 for TVF cartography and for monitoring physiological changes in the TVF. For the first time, we represent parametric maps of TVF obtained under normal conditions and upon increased pelvis and tubular pressure, which is a clinically relevant intervention. Future in vivo validation of our MRI approach to TVF assessment with intravital microscopy, i.e. for quantitative comparison of changes in the vascular and renal tubular compartments with those observed by and T2, is warranted. In this work, our MRI-based monitoring was focused on retrospective assessment of changes in TVF during an acute pathophysiological scenario. Future steps will include prospective and real-time application of T2 decomposition and TVF measurement, integrating our decomposition analysis directly into the image reconstruction and post-processing pipeline of the MR scanner.Conclusion:
Our investigations have the potential to help uncover the mechanisms leading to acute kidney injury and progression to chronic kidney disease. Monitoring of relative changes in renal TVF in vivo using dynamic parametric MRI provides a potential rapid, noninvasive marker for kidney disease. This approach will be invaluable for gaining a better mechanistic understanding of renal (patho-)physiology.Acknowledgements
This project received funding from the Helmholtz International Research School (HIRS) for Imaging and Data Science from the NAno to the MESo (iNAMES).References
[1] Toward Assessment of Renal Tubule Volume Fraction in Rat Kidney Using Decomposition of Parametric T2. Tasbihi E., Gladytz T., Starke L., Millward J., Seeliger E., and Niendorf T. ISMRM 2023
[2] Continuous diffusion spectrum computation for diffusion-weighted magnetic resonance imaging of the kidney tubule system. Quantitative Imaging in Medicine and Surgery. Periquito, J. S., Gladytz, T., Millward, J. M., Delgado, P. R., Cantow, K., Grosenick, D., ... & Niendorf, T. 3098, s.l. : Quantitative Imaging in Medicine and Surgery, 2021, Vol. 11
Figures
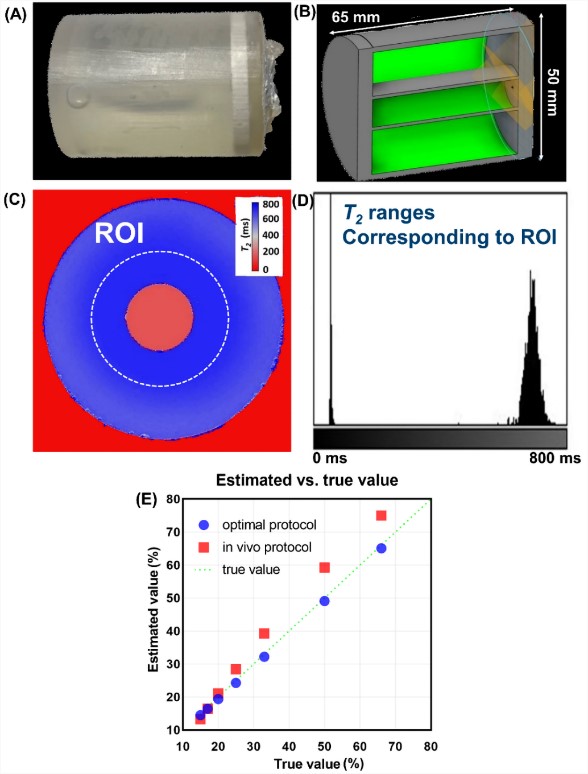
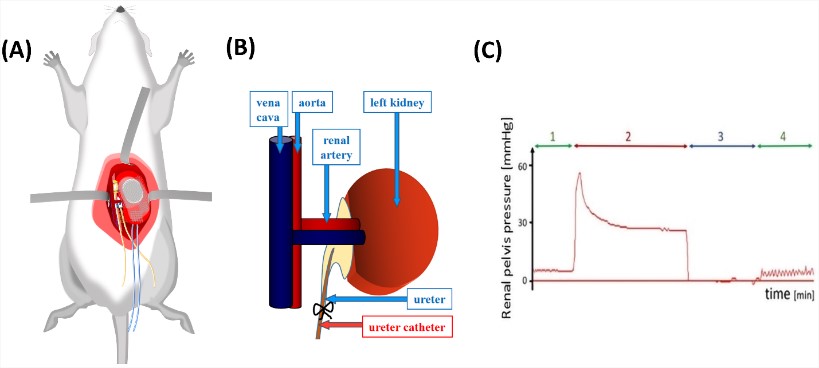
Fig.2. Illustration of the methods utilized for remotely controlled brief increases in renal pelvis and tubular pressures A. Schematic view shows the relevant positions and fixation of probes B. Catheter placed in the left ureter and connected via a catheter to a container filled with isotonic saline. Elevating the container above the level of the rats' kidneys increased pelvis/tubular pressures C. Pressure trace obtained for the renal pelvis of a rat recorded during (1) baseline (2) pressure increase (3) disconnection of the catheter - zero pressure (4) another control measurement.