0145
Simultaneous 3D CEST imaging of phosphocreatine and glycogen in skeletal muscle at 5T1Shenzhen Institute of Advanced Technology, ShenZhen, China, 2University of Chinese Academy of Sciences, BeiJing, China, 3Department of Electronic Science, Xiamen University, Xiamen, China
Synopsis
Keywords: Quantitative Imaging, CEST & MT
Motivation: The metabolic heterogeneities in human are high, it is crucial to improve the slice-encoding coverage in phosphocreatine and glycogen mapping.
Goal(s): To develop a 3D-CEST sequence for simultaneous mapping of phosphocreatine and glycogen within the acceptable time.
Approach: The optimal sequence using stack-of-star readouts was applied. The patch-based low-rank reconstruction was introduced to accelerate the scan. The concentrations were quantified with ex-vivo and in-vivo experiments.
Results: The coverage in slice-encoding dimension was improved to 140 mm. The scan time was reduced from 41.8 to 11.2 minutes. The concentrations of PCr and glycogen were 36.8 ± 14.4 mM and 80.4 ± 12.5 mM, respectively.
Impact: This study demonstrates the feasibility of a 3D-CEST imaging method that simultaneously quantifies phosphocreatine and glycogen in skeletal muscle at 5T. It can be accomplished within 11.2 minutes using patch-based low-rank reconstruction. It shows great potential in evaluateing metabolic heterogeneities.
Introduction
Phosphocreatine (PCr) and glycogen are essential fuels that supply ATP in skeletal muscles during exercise1. Traditional techniques, 31P and 13C magnetic resonance spectroscopy (MRS) have been applied for measuring PCr and glycogen in vivo, respectively2,3. These methods suffer from limitations of spatial resolution and SNR. Recent researches indicate that CEST can offer high-resolution mapping of PCr4-6 and can also quantify glycogen7. Considering the high metabolic heterogeneities in human, it is desirable to study the metabolites with an improved through-plane coverage. In this study, we developed a 3D-CEST sequence to simultaneously map PCr and glycogen in calf muscles of healthy subjects. It employed a saturation module combined with the stack-of-star golden-angle radial acquisition. The patch-based low-rank reconstruction was applied to further accelerate the scan9.Materials and Methods
Sample preparation: Different concentrations of phantoms were made using rabbit liver glycogen and PCr samples (Sigma Aldrich). The samples were dissolved in phosphate buffered saline solution (PBS), with pH of 7.3, and kept at 37°C during scanning.Human subjects: 3 healthy subjects were recruited and informed written consent was obtained. All experiments were carried out on a 5T MR scanner (uMR Jupiter, United Imaging Healthcare, China) using a 24-channel knee coil.
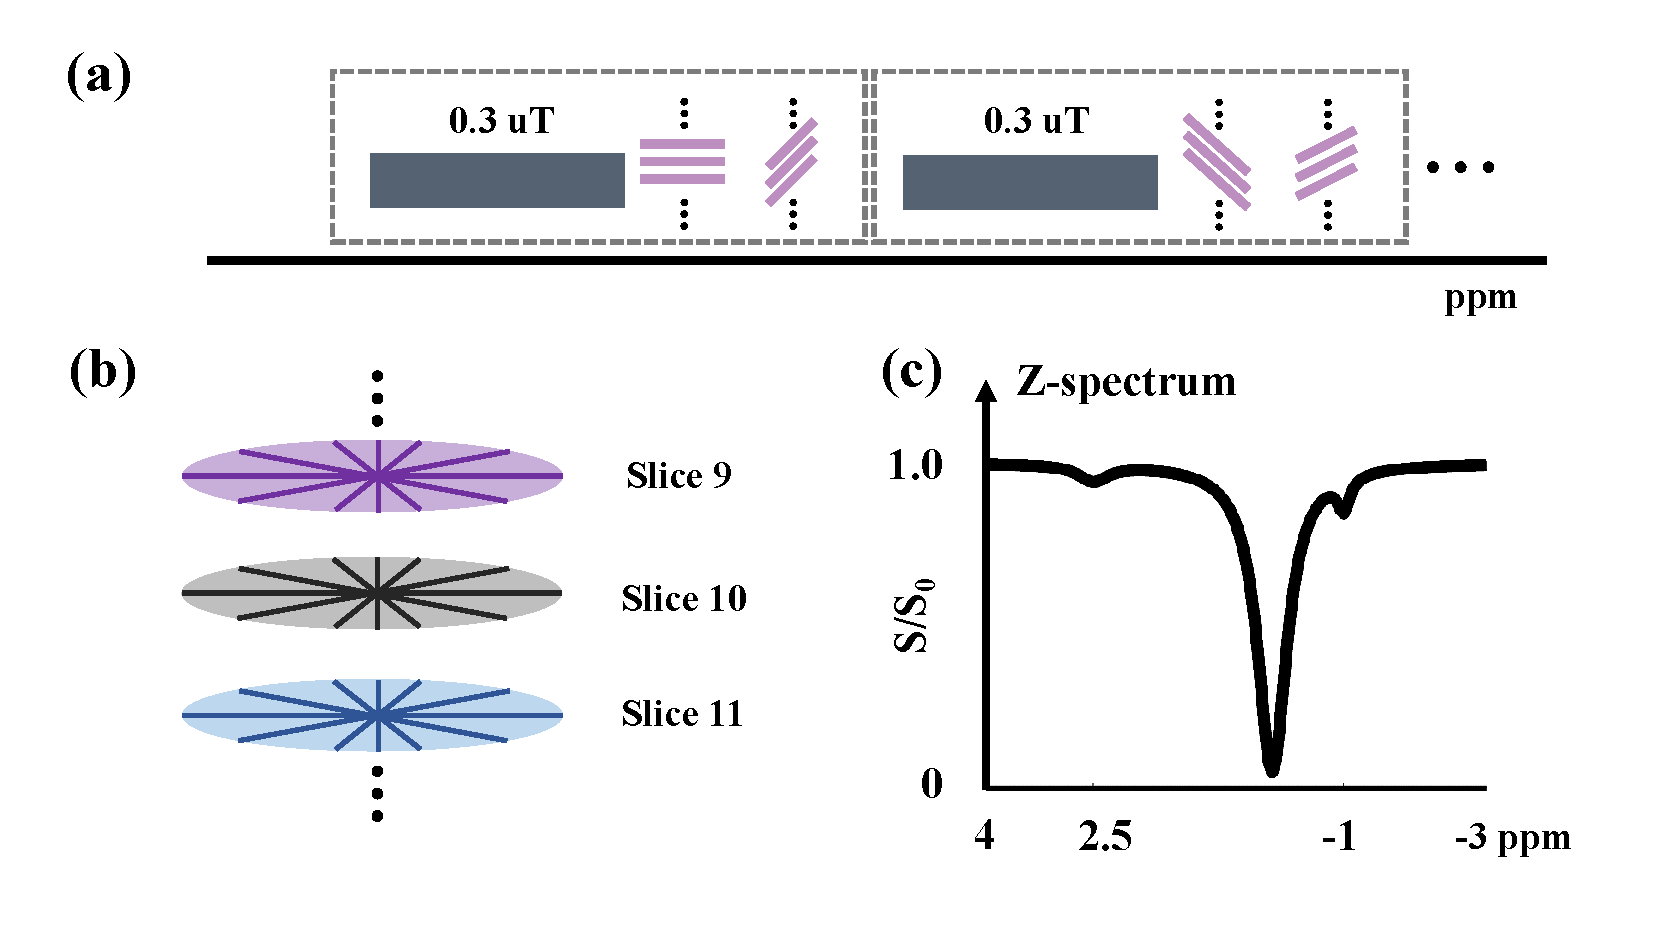
3D-CEST Sequence: Figure 1 shows the 3D-CEST sequence, involving a continuous wave (CW) preparation module followed by two stack-of-star readouts. The angles between different stacks are all golden angles. The parameters are: TR/TE = 3.8/1.79 ms, flip angle = 7°, FOV = 160×160×200 mm3, matrix size = 96×96×20, CW duration = 750 ms, B1 amplitude = 0.3 µT, frequency offsets were from -3 to 4 ppm in 0.2 ppm steps, with one unsaturated image as a reference. 150 radial stacks were acquired for each frequency offset and reconstructed using NUFFT algorithm, which serves as the reference. Then the former 40 spokes were extracted as the under-sampled CEST data.
Image reconstruction: To reconstruct the under-sampled CEST data, patch-based low-rank tensor technique was adopted9. For each slice, 2D patches were extracted to get the three-order tensor. The image reconstruction problem was modeled as an optimization problem with higher-order low-rank tensor and TV regularization, solved by ADMM method10.
Data analysis: Z-spectra were analyzed voxel-wise. The B0 inhomogeneities were corrected using WASSR method11. A 2-step multi-pool Lorentzian fitting strategy was applied to extract signals12. Firstly, the direct water saturation (DS) background were estimated in the “coarse” step, by assuming a five-pool Lorentzian fitting model for down-field and up-field, respectively. The residual spectra were then obtained by subtracting the acquired Z-spectrum from the DS. Secondly, the residual spectra of both sides were fitted in the “fine” step, with four-pool Lorentzian fitting model, respectively. PCr (+2.5 ppm), and glycoNOE (-1 ppm) peaks were obtained by subtracting a "fine" multi-pool Lorentzian line shape, excluding the pools of interest (2.5 ppm and -1 ppm), from the residual spectrum. Signals were quantified as the integral of extracted peaks from 2 to 3 ppm and -0.6 to 1.6 ppm, respectively.
Results
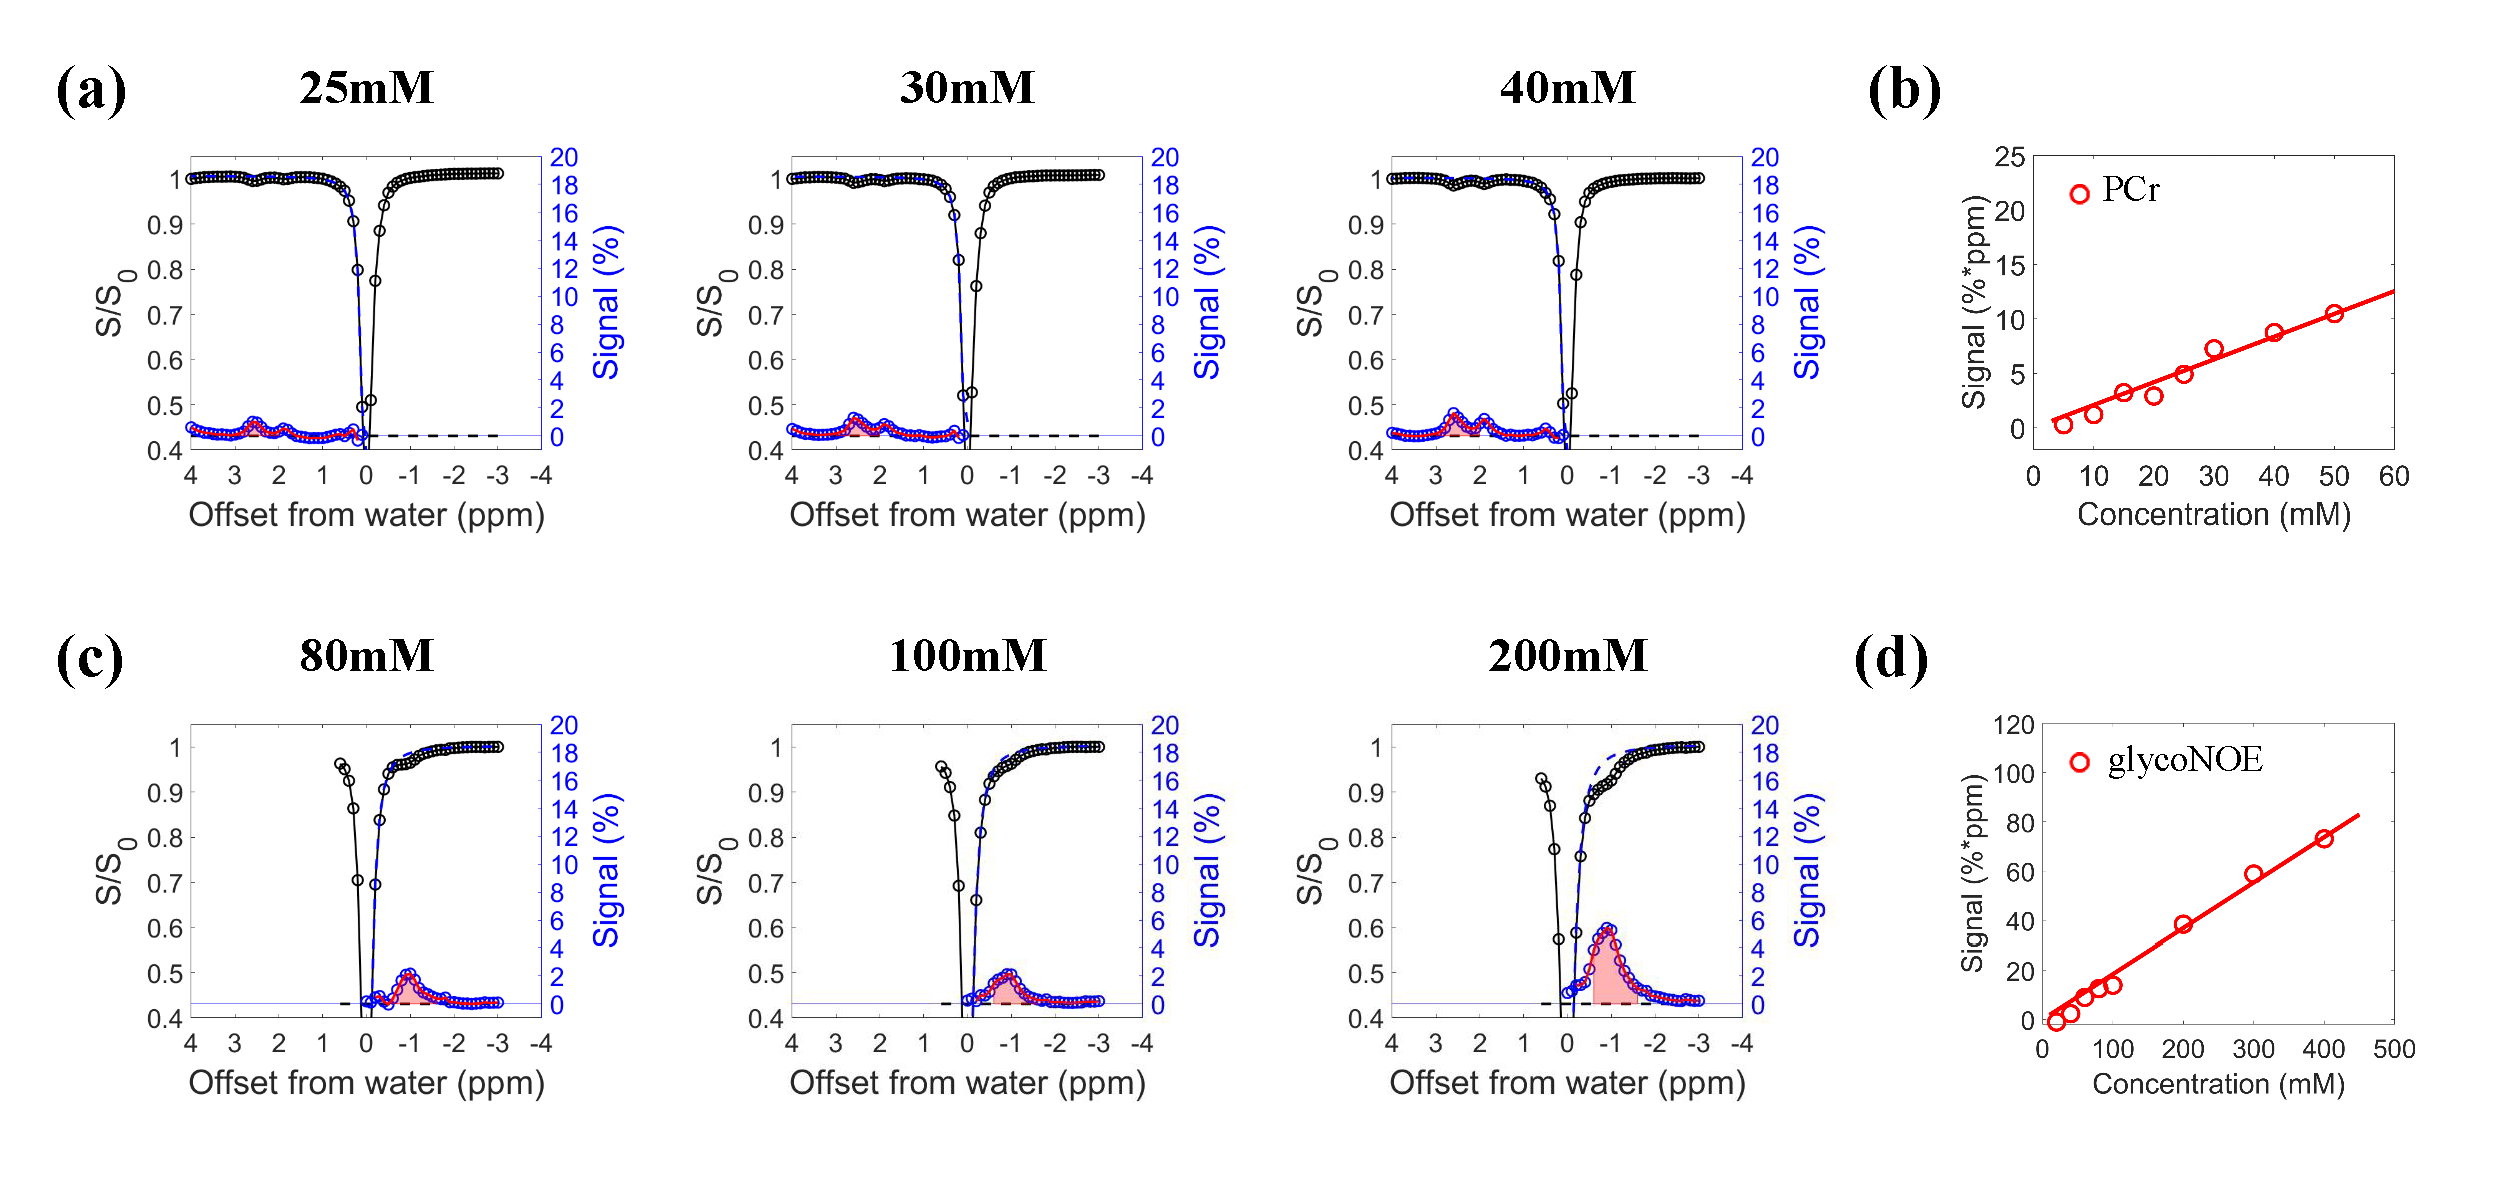
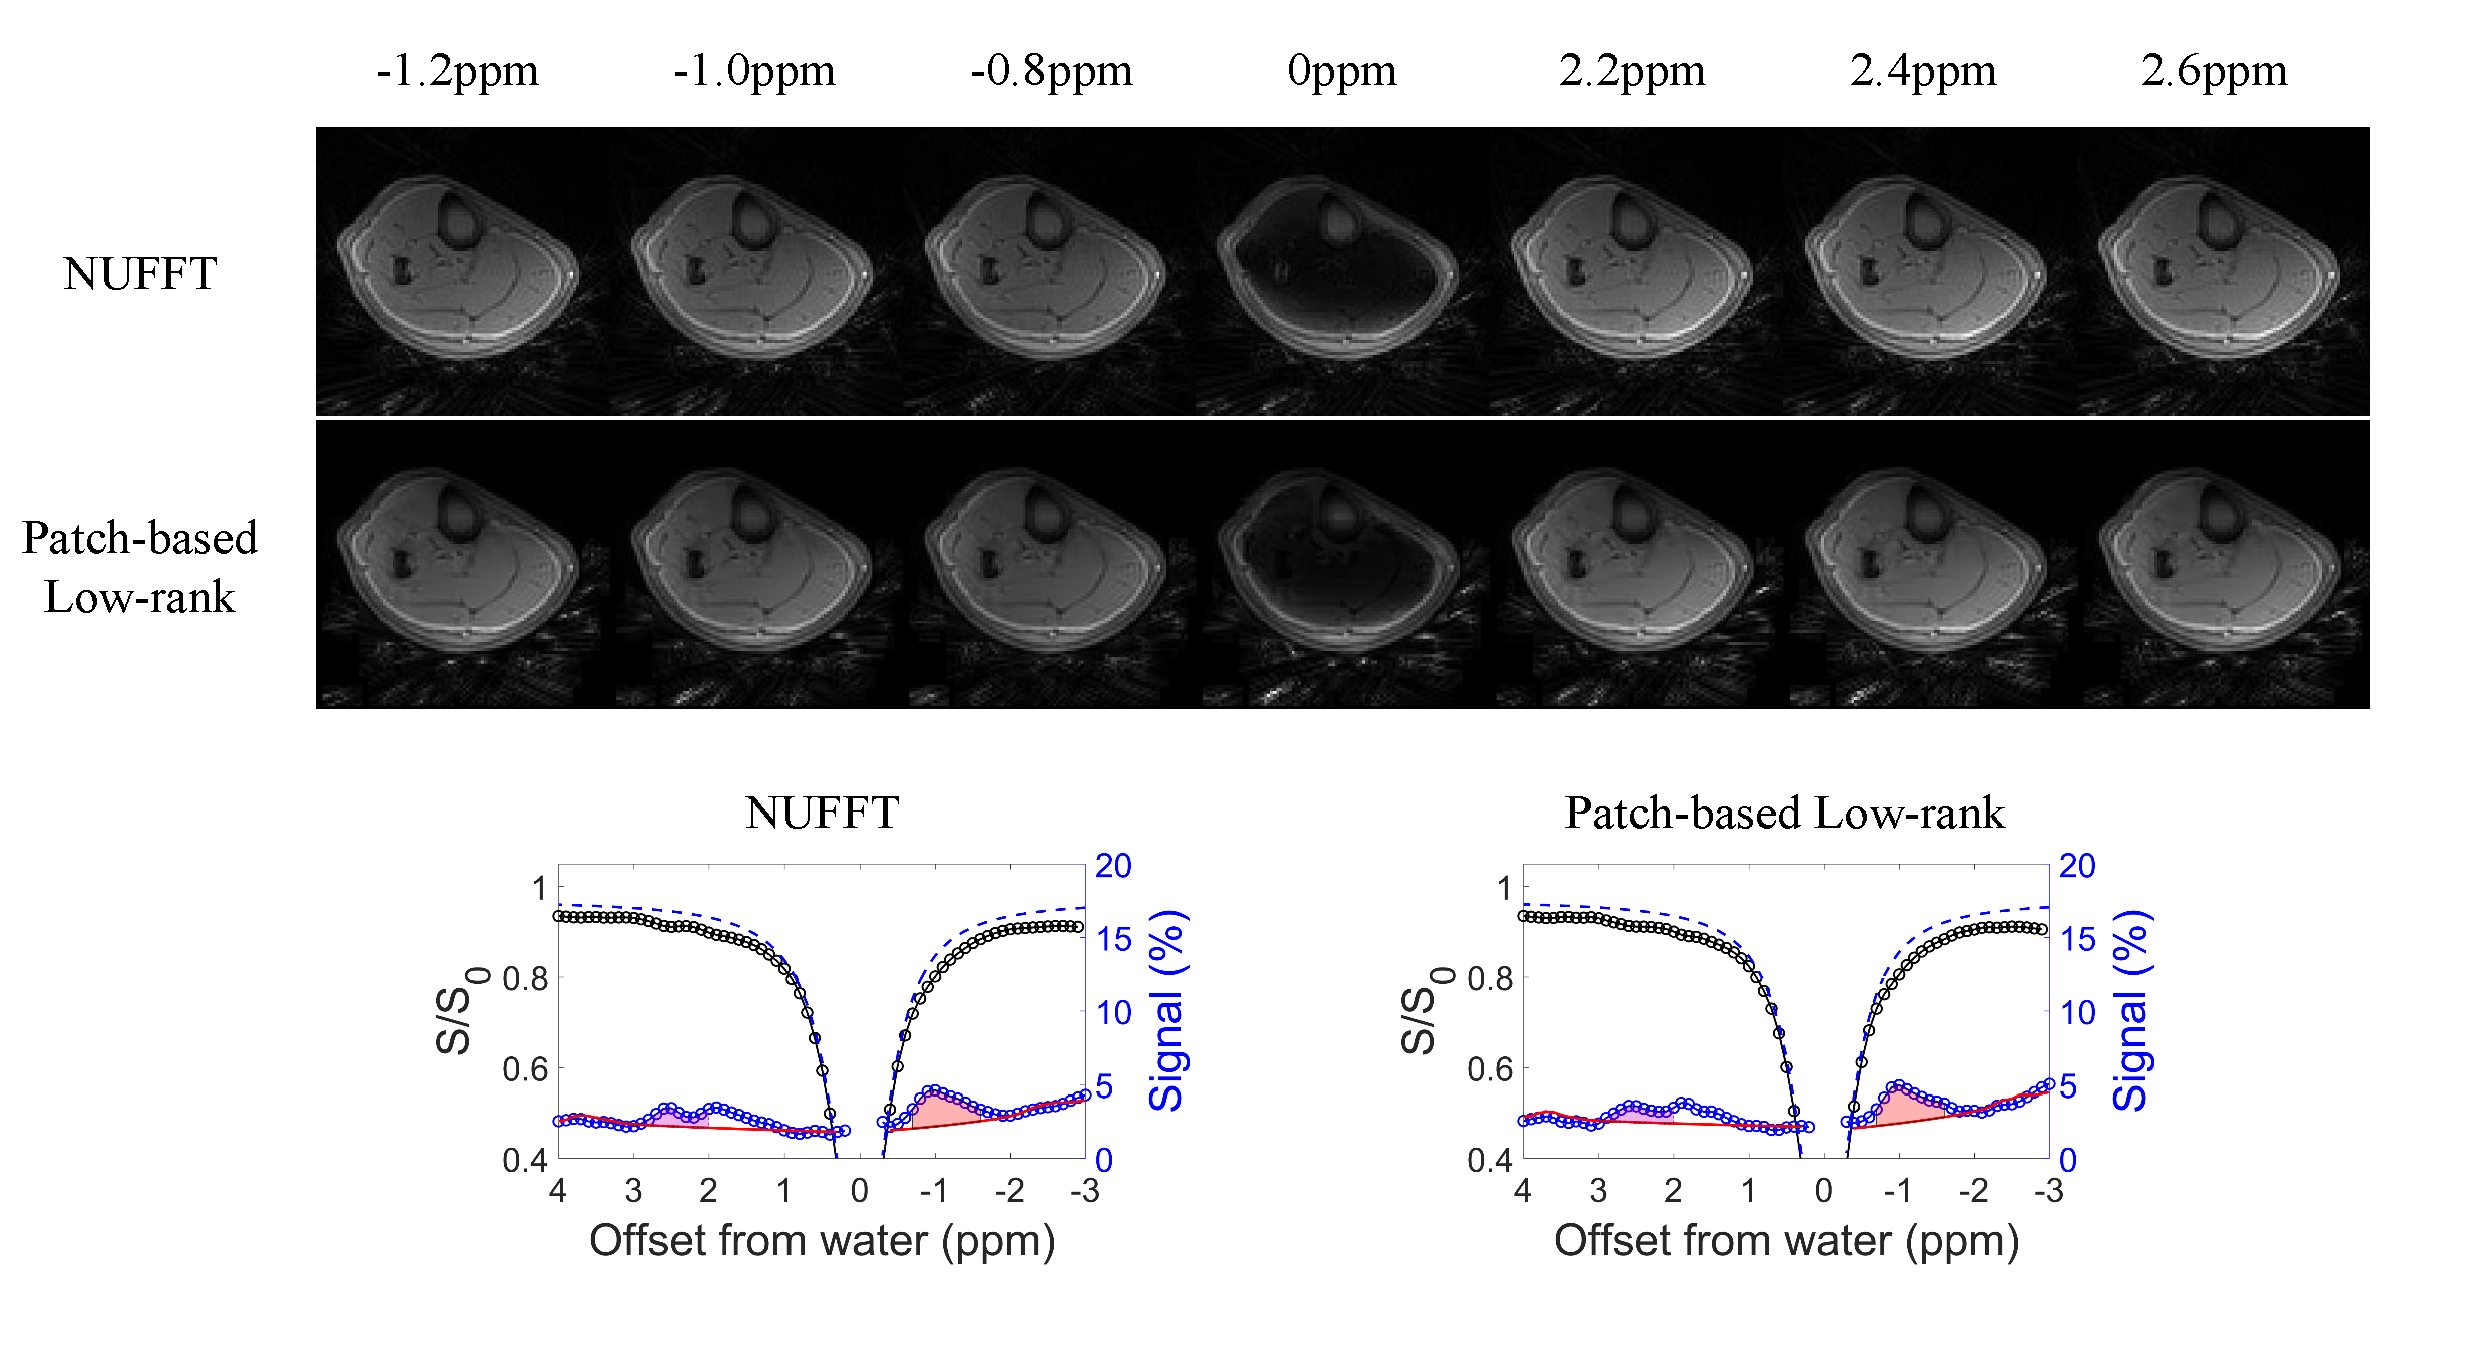
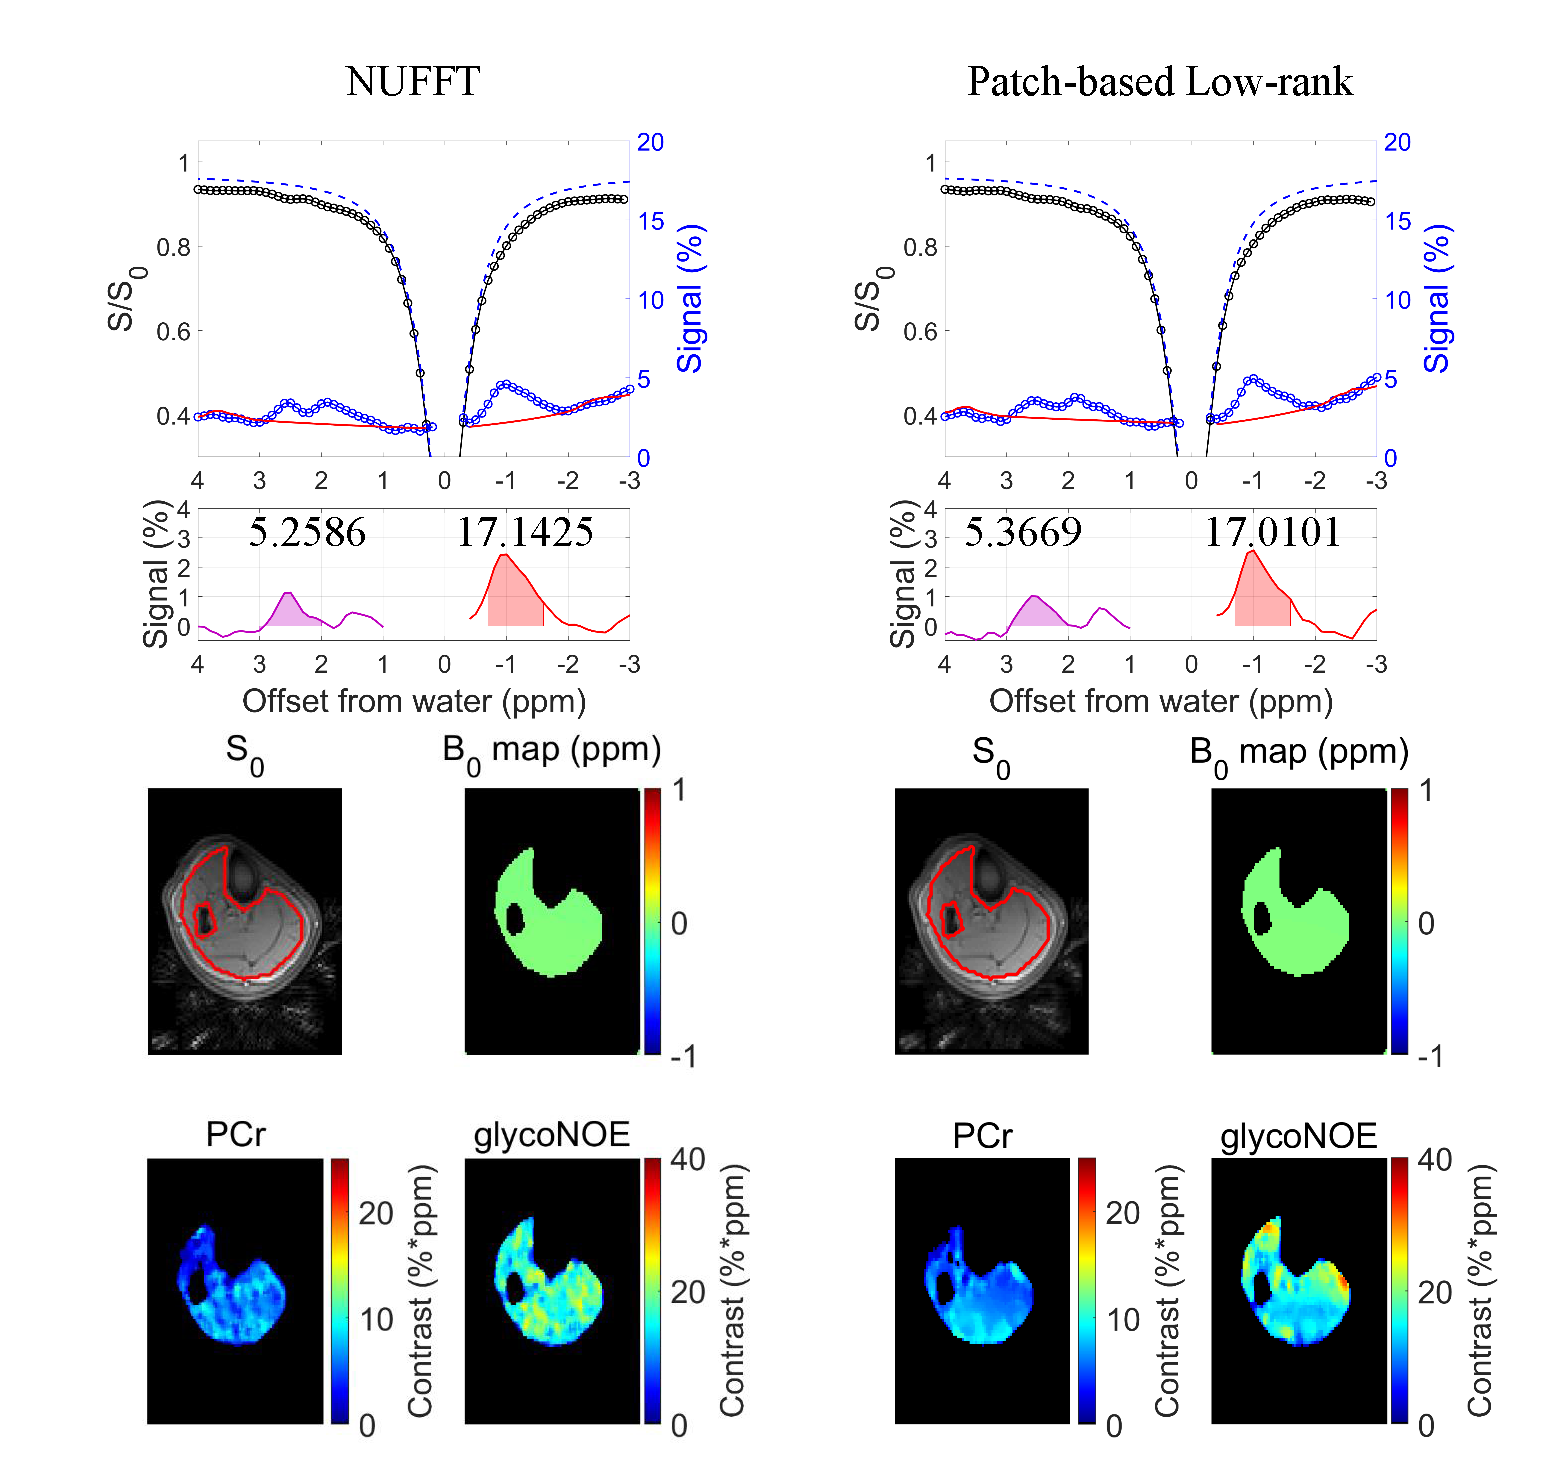
The z-spectra of PCr exhibits two distinct CEST peaks at 1.95 ppm and 2.5 ppm (Fig. 2a). The CEST peak at 2.5 ppm is primarily associated with PCr, while the peak at 1.95 ppm is influenced by creatine in in-vivo imaging4. The integral of the PCr signal at 2.5 ppm and glycoNOE signal were linearly correlated with the concentration (0.209 and 0.184, respectively). This linear relationship was utilized for quantifying in vivo concentrations (Fig. 2b, d). In vivo experiments show that images reconstructed using the patch-based low-rank algorithm with 40 spokes retain the contrast and the peaks of the z-spectrum (Fig. 3). The integral of signals and maps in ROI indicate that this method gives quantitative results similar to those of NUFFT (Fig. 4). Thus, our method reduces the acquisition time from 41.8 mins to 11.2 mins. Among 3 subjects, PCr and glycoNOE signals were 7.7± 3.0 %*ppm and 14.8 ± 2.3 %*ppm, respectively. According to the in vitro calibration, this corresponds to 36.8 ± 14.4 mM PCr and 80.4 ± 12.5 mM glycogen, respectively.Discussion
We employ a 3D-CEST sequence to enhance slice coverage to 140 mm. A CW saturation is used for efficient saturation, with two stacks acquired following saturation to reduce acquisition time. Regarding reconstruction methods, the regular low-rank approach might smooth the z-spectra. While the patch-based low-rank strategy explores the global low-rankness and nonlocal self-similarity, which retains contrast variation and preserves the shape of the z-spectra. However, this study was limited by a small cohort, and the feasibility of prospective under-sampling would be explored to reduce the scanning time in future research.Acknowledgements
This work is supported by National Natural Science Foundation of China under grant: No. 62322119, 12226008, 81971611, U21A6005, 82171904; Shenzhen Science and Technology Program: JCYJ20220818101213029.References
- Hargreaves, M., & Spriet, L.L. Skeletal muscle energy metabolism during exercise. Nature Metabolism. 2020;2:817-828.
- Kemp, G.J., Meyerspeer, M., & Moser, E. Absolute quantification of phosphorus metabolite concentrations in human muscle in vivo by 31P MRS: a quantitative review. NMR in Biomedicine. 2007;20:555-565.
- Price, T.B., Rothman, D.L., Avison, M.J., Buonamico, P., & Shulman, R.G. 13C-NMR measurements of muscle glycogen during low-intensity exercise. Journal of applied physiology. 1991;70:1836-1844.
- Chen, L., Schär, M., Chan, K.W., Huang, J., Wei, Z., Lu, H., Qin, Q., Weiss, R.G., van Zijl, P.C., & Xu, J. In vivo imaging of phosphocreatine with artificial neural networks. Nature Communications. 2020;11:1072.
- Chen, L., Barker, P.B., Weiss, R.G., van Zijl, P.C., & Xu, J. Creatine and phosphocreatine mapping of mouse skeletal muscle by a polynomial and Lorentzian line‐shape fitting CEST method. Magnetic Resonance in Medicine. 2018;81:69-78.
- Chung, J.J., Jin, T., Lee, J.H., & Kim, S. Chemical exchange saturation transfer imaging of phosphocreatine in the muscle. Magnetic Resonance in Medicine. 2019;81:3476-3487.
- Zhou, Y., van Zijl, P.C., Xu, X., Xu, J., Li, Y., Chen, L., & Yadav, N.N. Magnetic resonance imaging of glycogen using its magnetic coupling with water. Proceedings of the National Academy of Sciences. 2020;117:3144-3149.
- Chrzanowski, S.M., Baligand, C., Willcocks, R.J., Deol, J., Schmalfuss, I.M., Lott, D.J., Daniels, M.J., Senesac, C.R., Walter, G.A., & Vandenborne, K. Multi-slice MRI reveals heterogeneity in disease distribution along the length of muscle in Duchenne muscular dystrophy. Acta myologica : myopathies and cardiomyopathies : official journal of the Mediterranean Society of Myology. 2017;36:151-162.
- Bustin, A., Lima da Cruz,
G.J., Jaubert, O., López, K., Botnar,
R.M., & Prieto, C. High‐dimensionality
undersampled patch‐based reconstruction
(HD‐PROST) for
accelerated multi‐contrast MRI.
Magnetic Resonance in Medicine. 2019;81:3705-3719.
- Boyd S, Parikh N, Chu E, Peleato B, Eckstein J. Distributed optimization and statistical learning via the alternating direction method of multipliers. Found Trends Mach Learn. 2011;3:1–122.
- Kim, M., Gillen, J., Landman, B. A., Zhou, J., & Van Zijl, P. C. Water saturation shift referencing (WASSR) for chemical exchange saturation transfer (CEST) experiments. Magnetic Resonance in Medicine: An Official Journal of the International Society for Magnetic Resonance in Medicine. 2009;61:1441-1450.
- Chongxue Bie, Chao Zhou,
Peter C. M. van Zijl, Nirbhay N. Yadav, Yin Wu, Hairong Zheng, & Yang Zhou.
Simultaneous mapping of glycogen and phosphocreatine in human skeletal muscle
by saturation transfer MRI. ISMRM 31th Annual Meeting & Exhibition,
Toronto, Canada, 2023, No.3161
Figures