0142
Dedifferentiation of functional hierarchical axis captures individual differences in cognition performance and disease progression1Biomedical Engineering, National University of Singapore, Singapore, Singapore, 2Department of Health Technology and Informatics, Hong Kong Polytechnic University, Hung hom, Hong Kong, 3Department of Biomedical Engineering, Johns Hopkins University, Baltimore, MD, United States
Synopsis
Keywords: Functional Connectivity, Aging
Motivation: The healthy aging brain exhibits functional dedifferentiation, yet a consensus on its characterization remains elusive, hindering individual-level assessment of unhealthy aging.
Goal(s): We aim to utilize the functional hierarchical axis to elucidate primary alterations in functional dedifferentiation during healthy aging.
Approach: We developed a measure to quantify the heterogeneity of network dedifferentiation along the functional hierarchical axis, and assessed its relevance to cognition and neurological diseases at an individual level.
Results: Functional dedifferentiation in attention and control networks captures substantial individual differences in aging, cognition, and diseases. The heterogeneity of functional dedifferentiation along the functional hierarchical axis predicts domain-specific disease risk.
Impact: Brain aging primarily entails association and control network integrity deterioration on the functional hierarchical axis. The individual differences of functional dedifferentiation on this axis provide risk assessments of unhealthy brain aging.
Introduction
The healthy aging brain experiences a progressive deterioration in brain structure and function, contributing to alterations in cognition1. One notable change is the reduced functional connectivity within functional networks and increased connectivity between different networks, known as functional network dedifferentiation2. Nevertheless, a consensus on the precise characterization of functional dedifferentiation in healthy aging remains elusive. For instance, multiple studies have identified different aging-sensitive network dedifferentiation centers2-4. Recent studies have revealed a large-scale functional hierarchical axis, extending from transmodal association regions to unimodal sensorimotor regions, effectively captures different aspects of cortical macrostructure, microstructure, and function across lifespan5-9. Therefore, an exploration of functional dedifferentiation along this specific axis may elucidate the primary alterations in functional network integrity during aging. We hypothesized that the heterogeneity in functional network dedifferentiation would follow this axis and capture individual differences in cognition and diseases.Methods
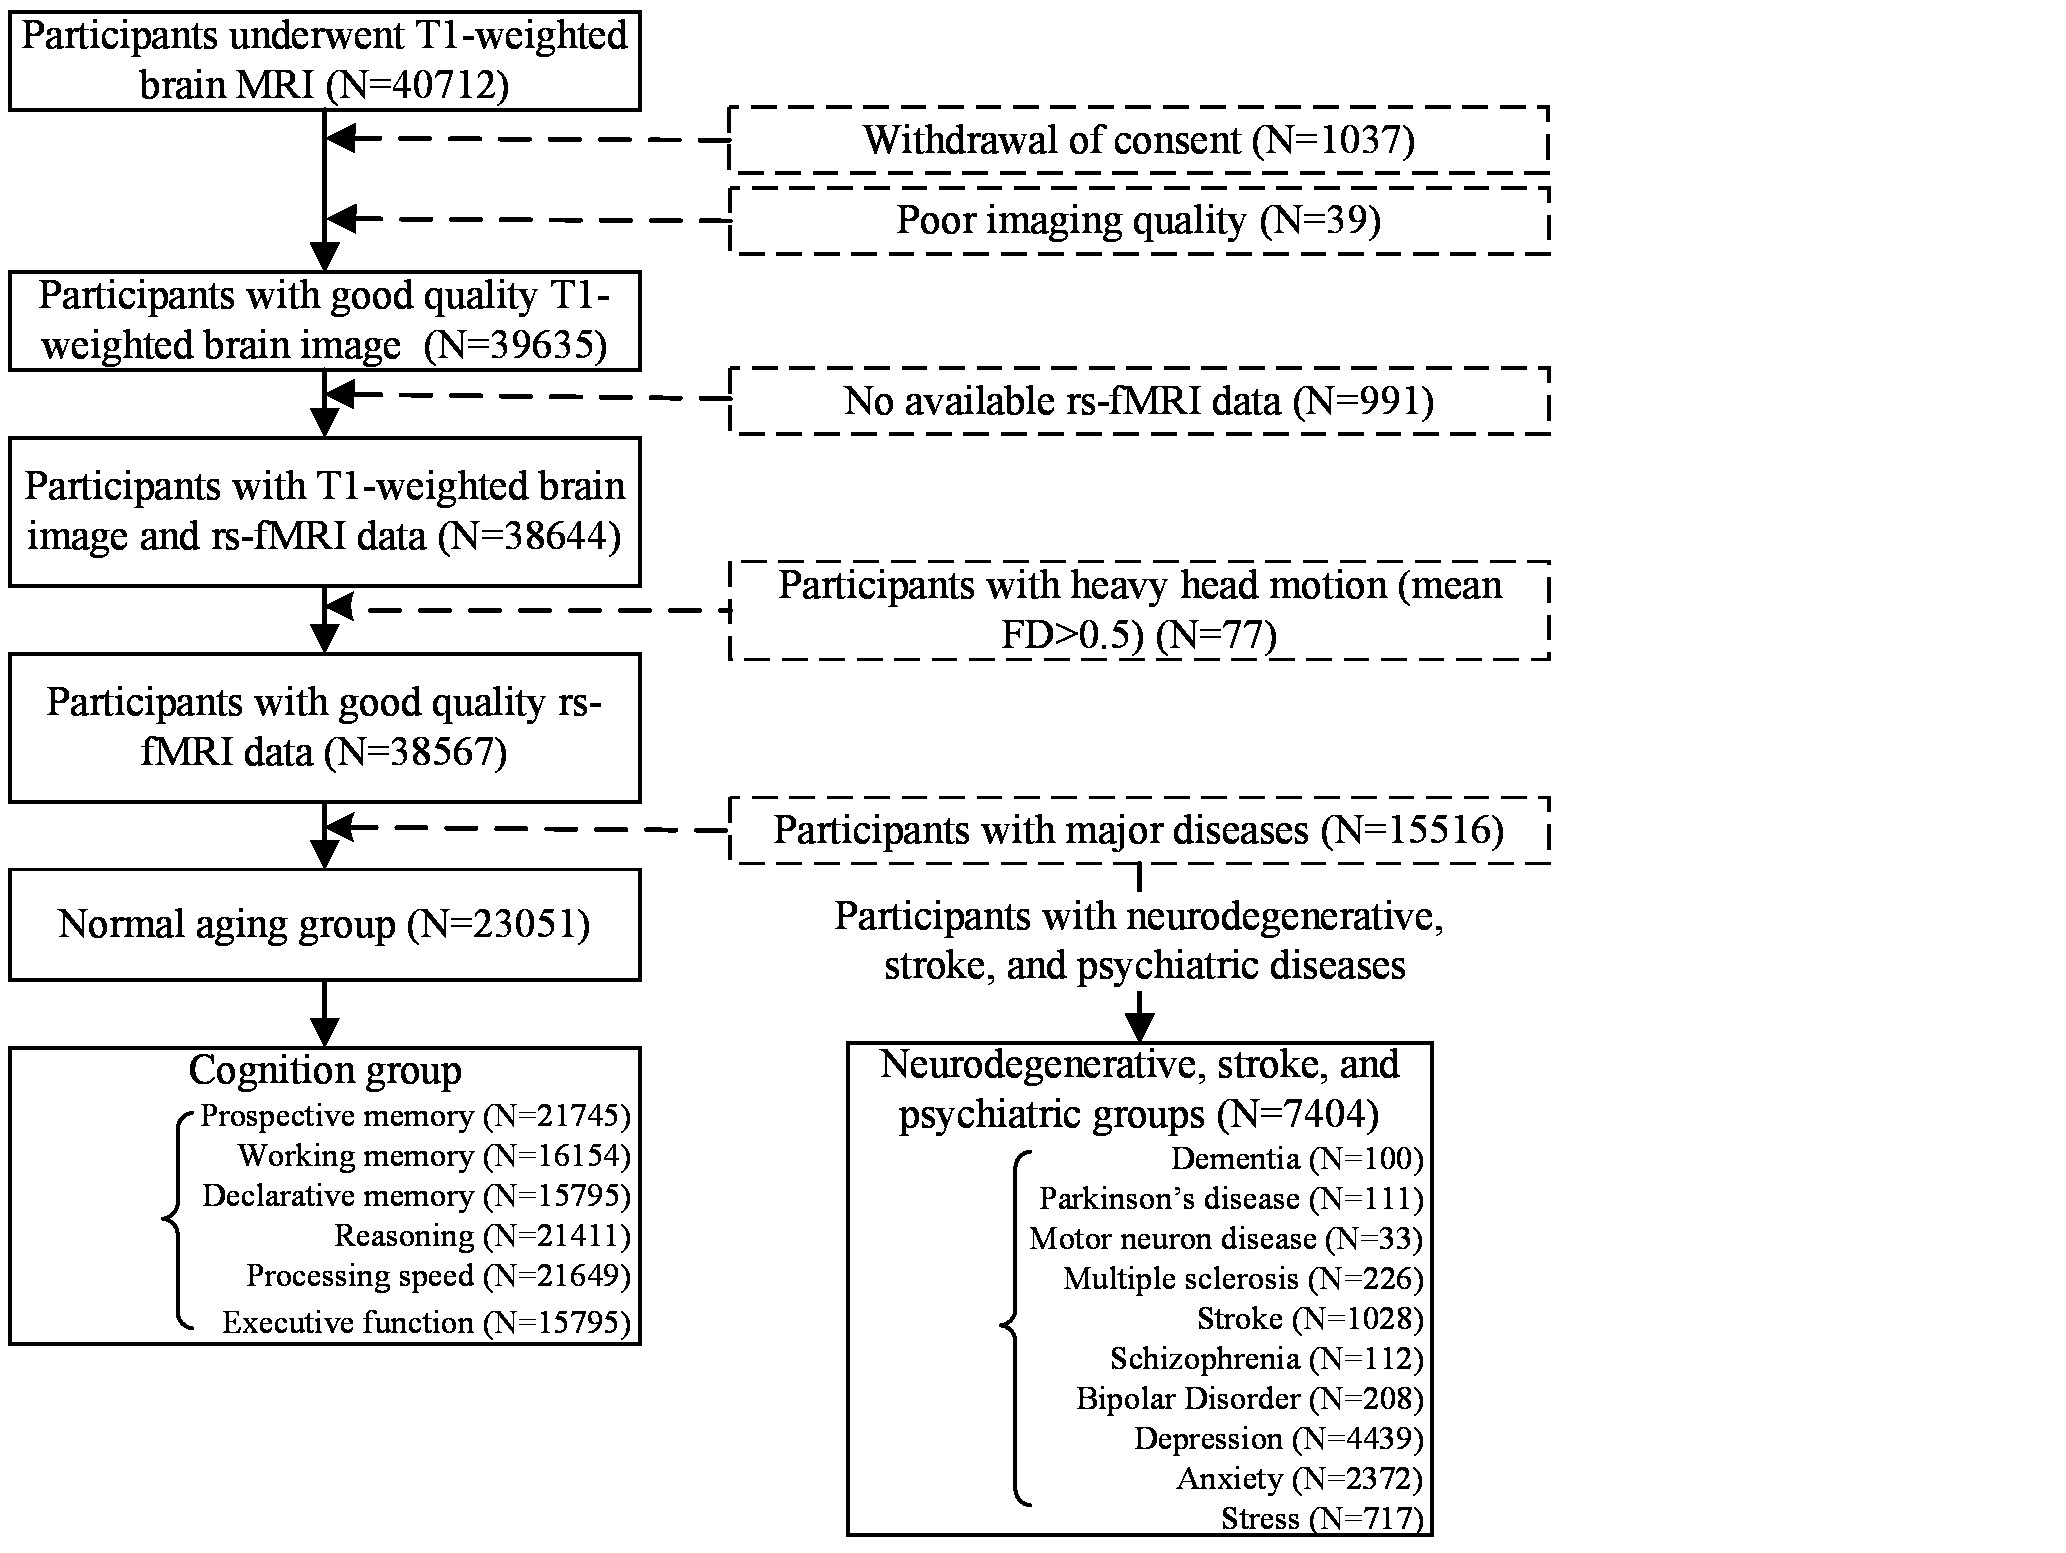
This study leveraged demographic, cognitive function tests, disease diagnosis, and brain imaging data (T1 and rs-fMRI) from the UK Biobank. Figure 1 outlines the participant selection process. T1 images underwent FreeSurfer preprocessing, and the rs-fMRI was pre-processed in FSL with slice timing, zero padding, motion correction, intensity normalization, and nuisance regression. We identify the functional hierarchical axis for each individual by Fisher-z transforming and thresholding the cortical voxel-level functional connectivity matrix at 90% sparsity. We measured the similarity between all pairs of voxels using cosine distance and employed diffusion map embedding to identify low-dimensional gradient components. Procrustes analysis aligned individual gradients with group-averaged gradients, with the most variance-explaining gradient designated as the hierarchical axis 5. We assessed the similarity of the group-averaged functional hierarchical axis at each 1-year age range in the normal aging population (N=23,051, age=46~80 years) using symmetric KL-divergence. KL-divergence quantifies the dissimilarity between two probability distributions, capturing magnitude differences unaddressed by Pearson’s correlation. Then, a measure of network dedifferentiation in the principle functional gradient was designed to summarize within-network aggregation in relation to between-network integration at the voxel level, as noted in Equation (1):$$Network Dedifferentiation_i=\frac{(\bar d_i^w-\bar d_i^b)}{max(\bar d_i^w,\bar d_i^b)} $$
where$$$d_i^w$$$ is the average Euclidean distance between voxel and all other voxels within the same functional network, and $$$d_i^b$$$ is the average Euclidean distance between voxel and all voxels from other networks. This measure ranges from -1 to +1, with higher values indicating greater voxel-wise integration across networks along the principle functional gradient, i.e. greater dedifferentiation. Yeo's 7-network parcellation was utilized in this study. We investigated age-related network dedifferentiation in healthy aging using linear regression, controlling for sex and head motion. We also assessed its cognitive relevance using linear regression and the ability to distinguish neurodegenerative and psychiatric diseases using logistic regression, covarying for age, sex, education, and head motion.
Results
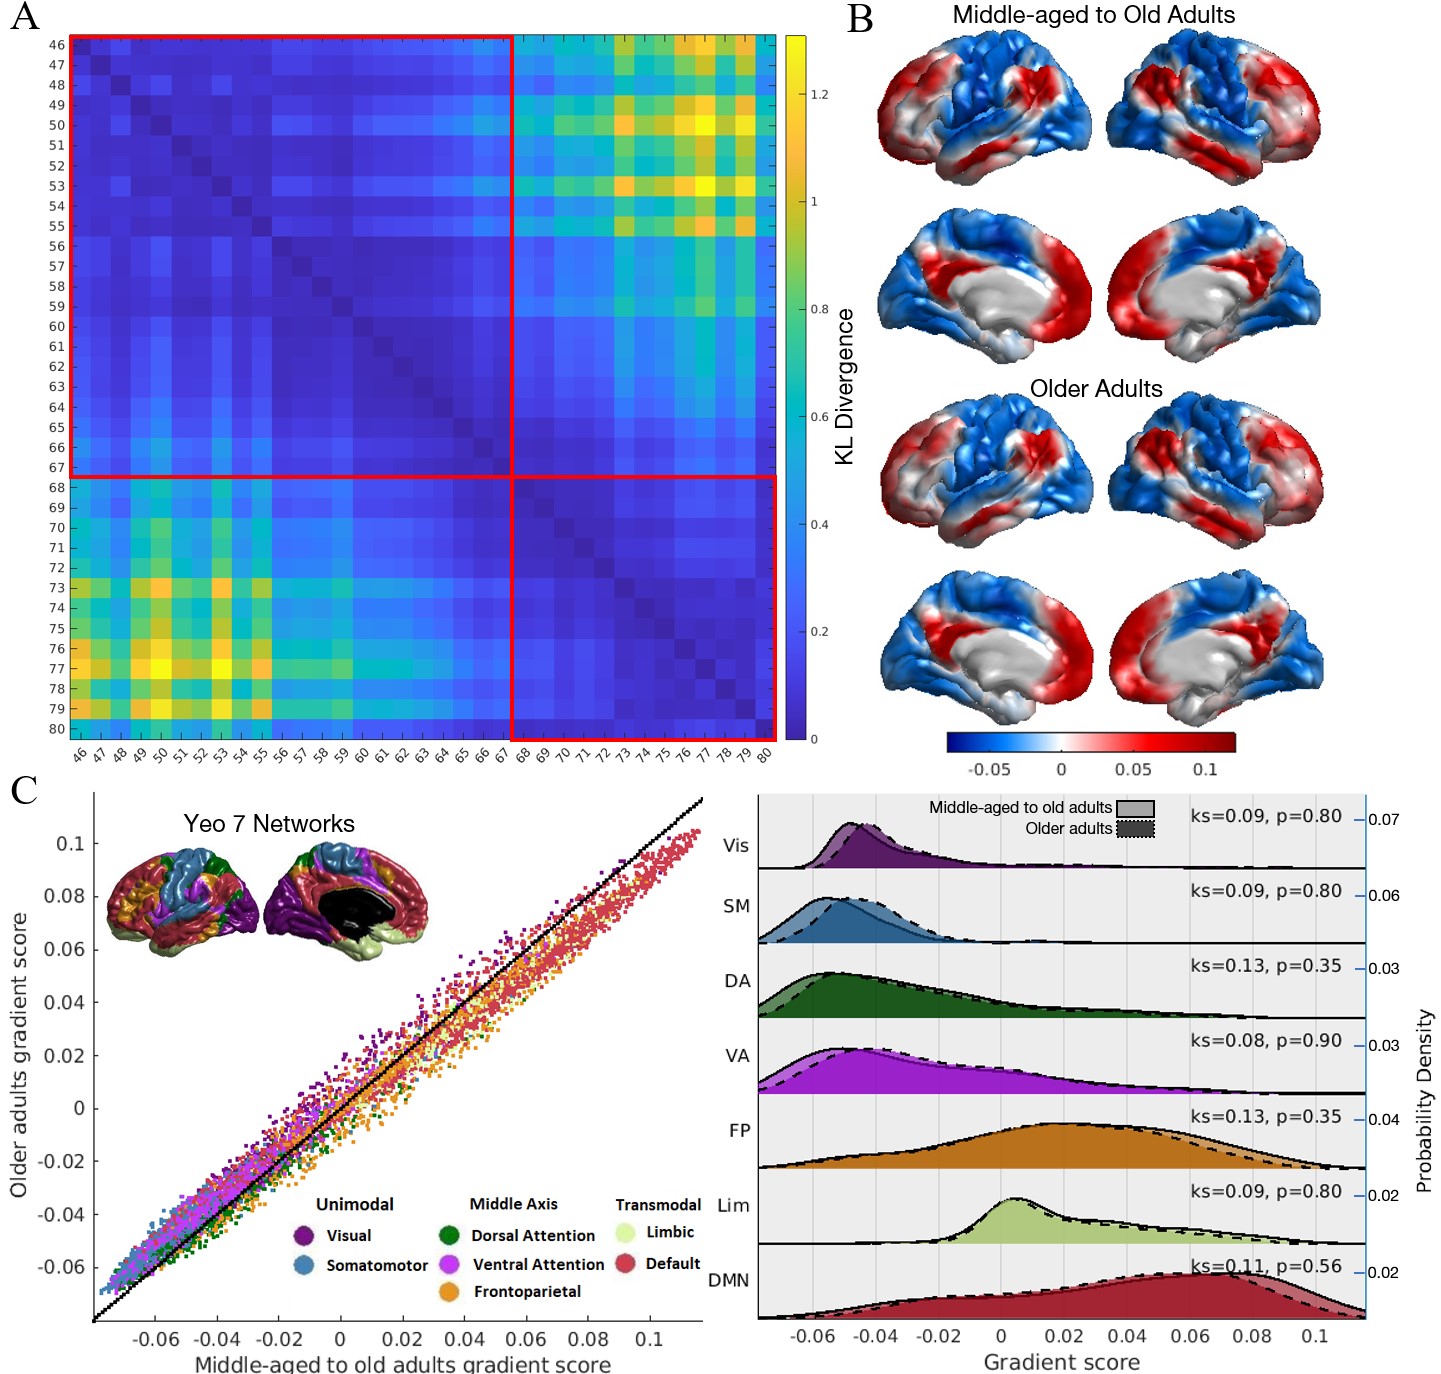
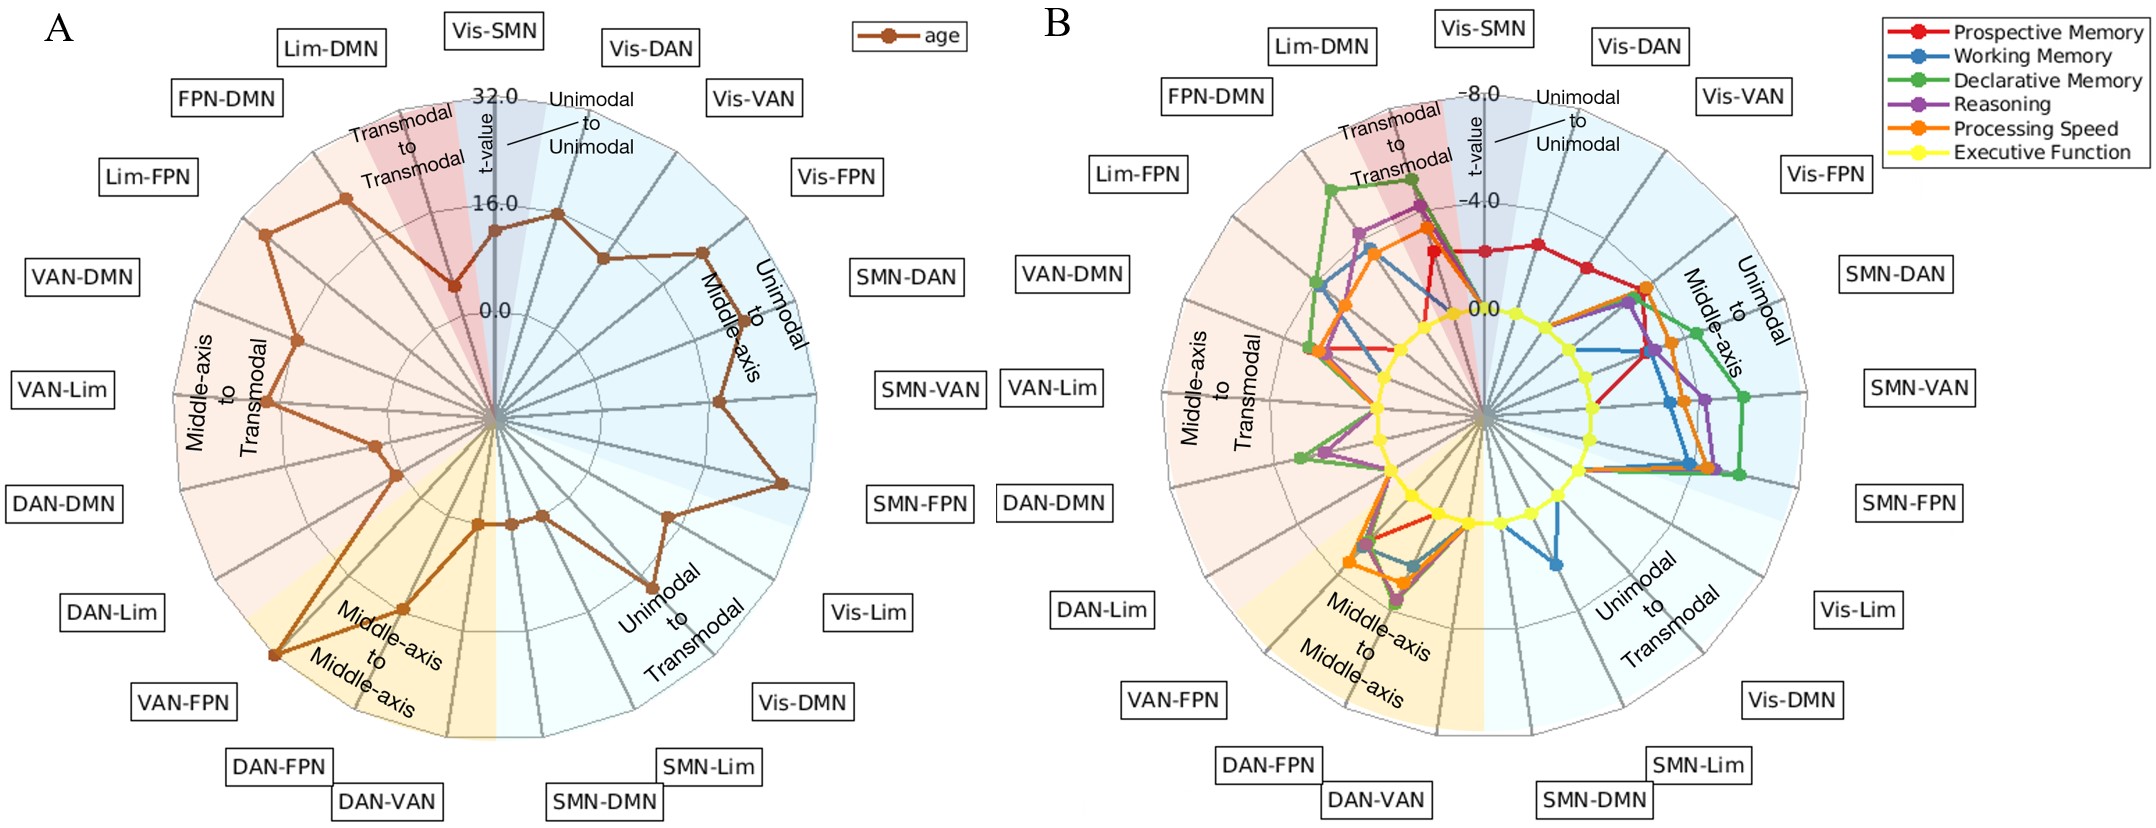
Figure 2a exhibits age-related changes in principle functional organization. K-means clustering and silhouette score revealed two distinct groups representing middle-aged to older adults and older adults (Fig. 2b). The group-level principle functional gradient was relatively stable across age, with limbic and default mode networks anchoring the transmodal pole, and visual and somatomotor networks anchoring the unimodal end. Middle-axis networks included dorsal attention, ventral attention, and frontoparietal control. Although not statistically significant (p>0.35), Fig.2c revealed a compressed organization in older adults, with the most pronounced changes in middle-axis systems followed by transmodal and unimodal networks.Figure 3 shows that both increasing age and poorer performance in most cognitive domains are associated with greater differentiation along the principle functional gradient, particularly between the middle-axis system network and other networks.
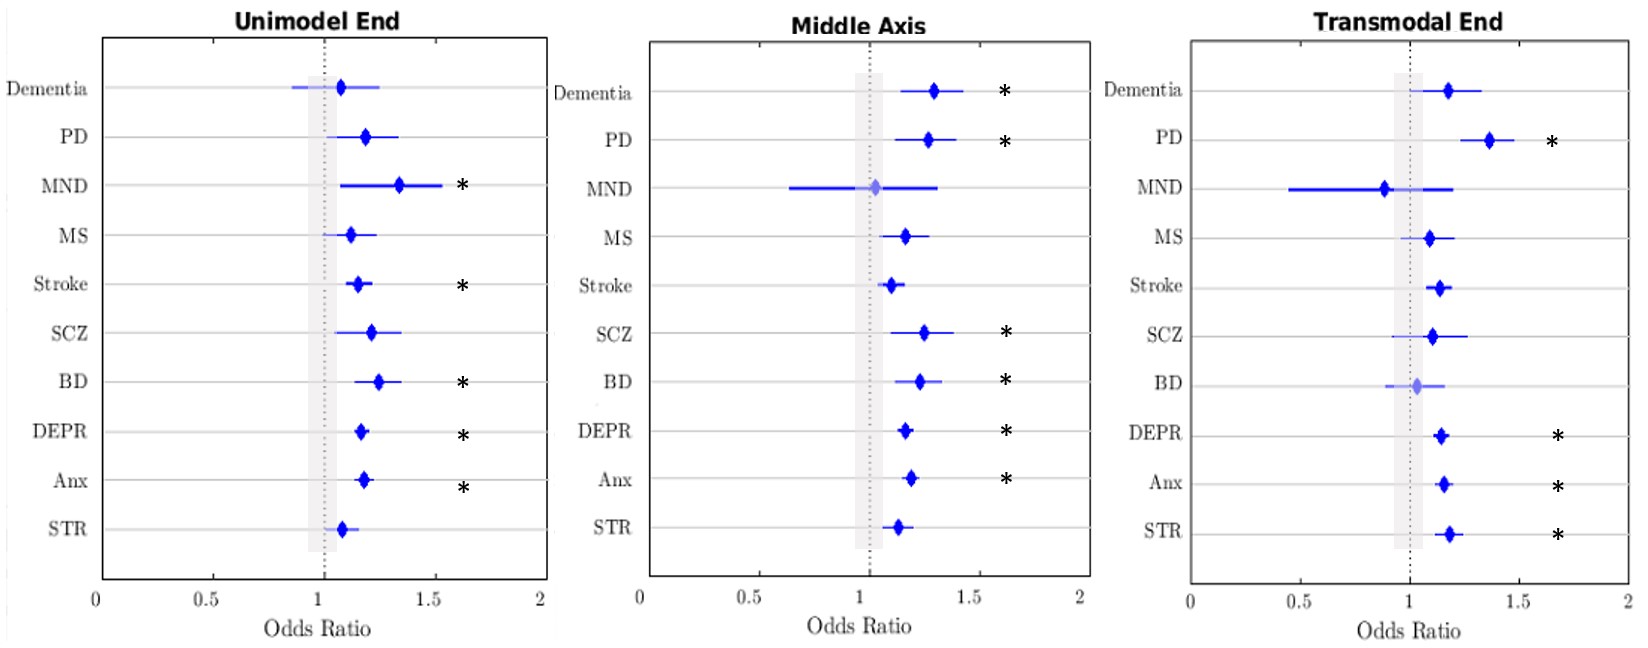
Figure 4 demonstrates that dedifferentiation between the middle-axis system and other networks exhibited the strongest predictive power for diverse neurodegenerative and psychiatric diseases. We also discovered some system-specific diseases relevance. Motor neuron disease and stroke, two diseases that severely impact motor function, were more related to unimodal end dedifferentiation with other networks.
Discussion
The dedifferentiation of the middle segment of the principal functional gradient network exhibits pronounced age, cognition, and disease-related changes in the aging process. Indeed, the attention and control network plays a crucial role in bridging perception and abstract cognitive functions, facilitating the flow of information along the hierarchical axis. Consequently, a disturbance in the middle-axis system may impede information processing within the brain, contributing to cognitive alterations and the onset of diseases. Furthermore, the heterogeneity in network dedifferentiation may serve as a predictive factor for domain-specific diseases.Conclusion
The heterogeneity in functional network dedifferentiation follows the principle functional hierarchy axis and captures individual differences in cognition and neurological disease risks. This work provides a valuable reference for future studies on identifying unsuccessful aging through individual differences in macroscale brain hierarchy.Acknowledgements
This research has been conducted using the UK Biobank Resource under Application Number 57831. This research/project is supported by the National Science Foundation (NSF:2010778), the National Research Foundation, Singapore, and the Agency for Science Technology and Research (A*STAR), Singapore, under its Prenatal/Early Childhood Grant (Grant No. H22P0M0007), and by the Singapore Ministry of Education (MOE2019-T2-2-094, T2EP20123-0007, FRC Tier 1). Additional support is provided by the A*STAR Computational Resource Centre through the use of its high-performance computing facilities, the Hong Kong global STEM scholar scheme, the internal fund of the Hong Kong Polytechnic University, and STI 2030—Major Projects (No.2022ZD0209000).References
1. Hedden T, Gabrieli JD. Insights into the ageing mind: a view from cognitive neuroscience. Nat Rev Neurosci 2004;5:87-96.
2. Chan MY, Park DC, Savalia NK, Petersen SE, Wig GS. Decreased segregation of brain systems across the healthy adult lifespan. Proc Natl Acad Sci U S A 2014;111:E4997-5006.
3. Geerligs L, Renken RJ, Saliasi E, Maurits NM, Lorist MM. A Brain-Wide Study of Age-Related Changes in Functional Connectivity. Cereb Cortex 2015;25:1987-1999.
4. Betzel RF, Byrge L, He Y, Goni J, Zuo XN, Sporns O. Changes in structural and functional connectivity among resting-state networks across the human lifespan. Neuroimage 2014;102 Pt 2:345-357.
5. Margulies DS, Ghosh SS, Goulas A, et al. Situating the default-mode network along a principal gradient of macroscale cortical organization. Proc Natl Acad Sci U S A 2016;113:12574-12579.
6. Zhu J, Margulies D, Qiu A. White matter functional gradients and their formation in adolescence. Cerebral Cortex 2023;33:10770-10783.
7. Dong HM, Margulies DS, Zuo XN, Holmes AJ. Shifting gradients of macroscale cortical organization mark the transition from childhood to adolescence. Proc Natl Acad Sci U S A 2021;118.
8. Bethlehem RAI, Paquola C, Seidlitz J, et al. Dispersion of functional gradients across the adult lifespan. Neuroimage 2020;222:117299.
9. Audrey L, Valerie JS, Adam P, et al. Functional Connectivity Development along the Sensorimotor-Association Axis Enhances the Cortical Hierarchy. bioRxiv 2023:2023.2007.2020.549090.
Figures