0140
Normative modeling of brain white matter microstructure using diffusion tensor metrics in 52,719 participants1USC Mark and Mary Stevens Neuroimaging and Informatics Institute, University of Southern California, Los Angeles, CA, United States
Synopsis
Keywords: White Matter, Diffusion Tensor Imaging
Motivation: It is currently difficult to compute normative models for diffusion MRI metrics of the brain’s white matter across the lifespan due to scanner/protocol effects that are hard to eliminate during harmonization.
Goal(s): We set out to build large-scale multi-site normative models for DTI metrics of the white matter of the human brain.
Approach: Hierarchical Bayesian Regression was run on ROI metrics derived using the ENIGMA-DTI protocol to determine the age trajectory and centile curves of DTI metrics.
Results: We built DTI reference models based on 52,719 subjects that allowed us to detect deviations from the norm for patients with brain diseases.
Impact: These reference models are valuable for detecting microstructural deviations from the normal range, while modeling scanner, protocol and cohort effects. They will be used in our ENIGMA consortium to map profiles of microstructural anomalies in >20 neurological and psychiatric conditions.
Introduction
Normative modeling is a recently developed statistical approach that estimates the centiles of variation of a brain measure as a function of specific explanatory covariates1. To build large-scale normative models (NM) of diffusion-MRI (dMRI) metrics across the lifespan, it is vital - and crucial - to use multi-site data as these can boost the statistical power to detect anomalies by increasing the size and diversity of the training sample, improving the rigor and generalizability of findings. To address the lack of a global and generalizable NM of human brain diffusion tensor imaging (DTI) metrics, we created a large-scale NM for DTI metrics based on 52,719 participants. A Hierarchical Bayesian Regression (HBR) approach was used to model and adjust for site-dependent effects caused by dMRI protocol and cohort differences.Methods
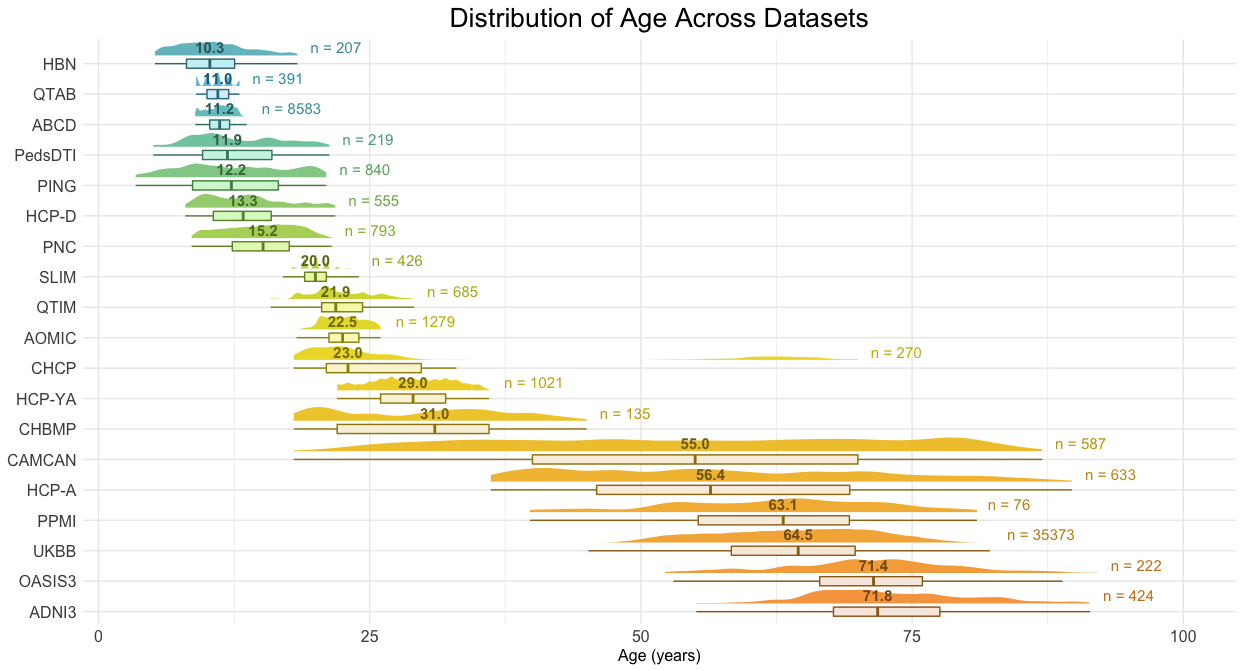
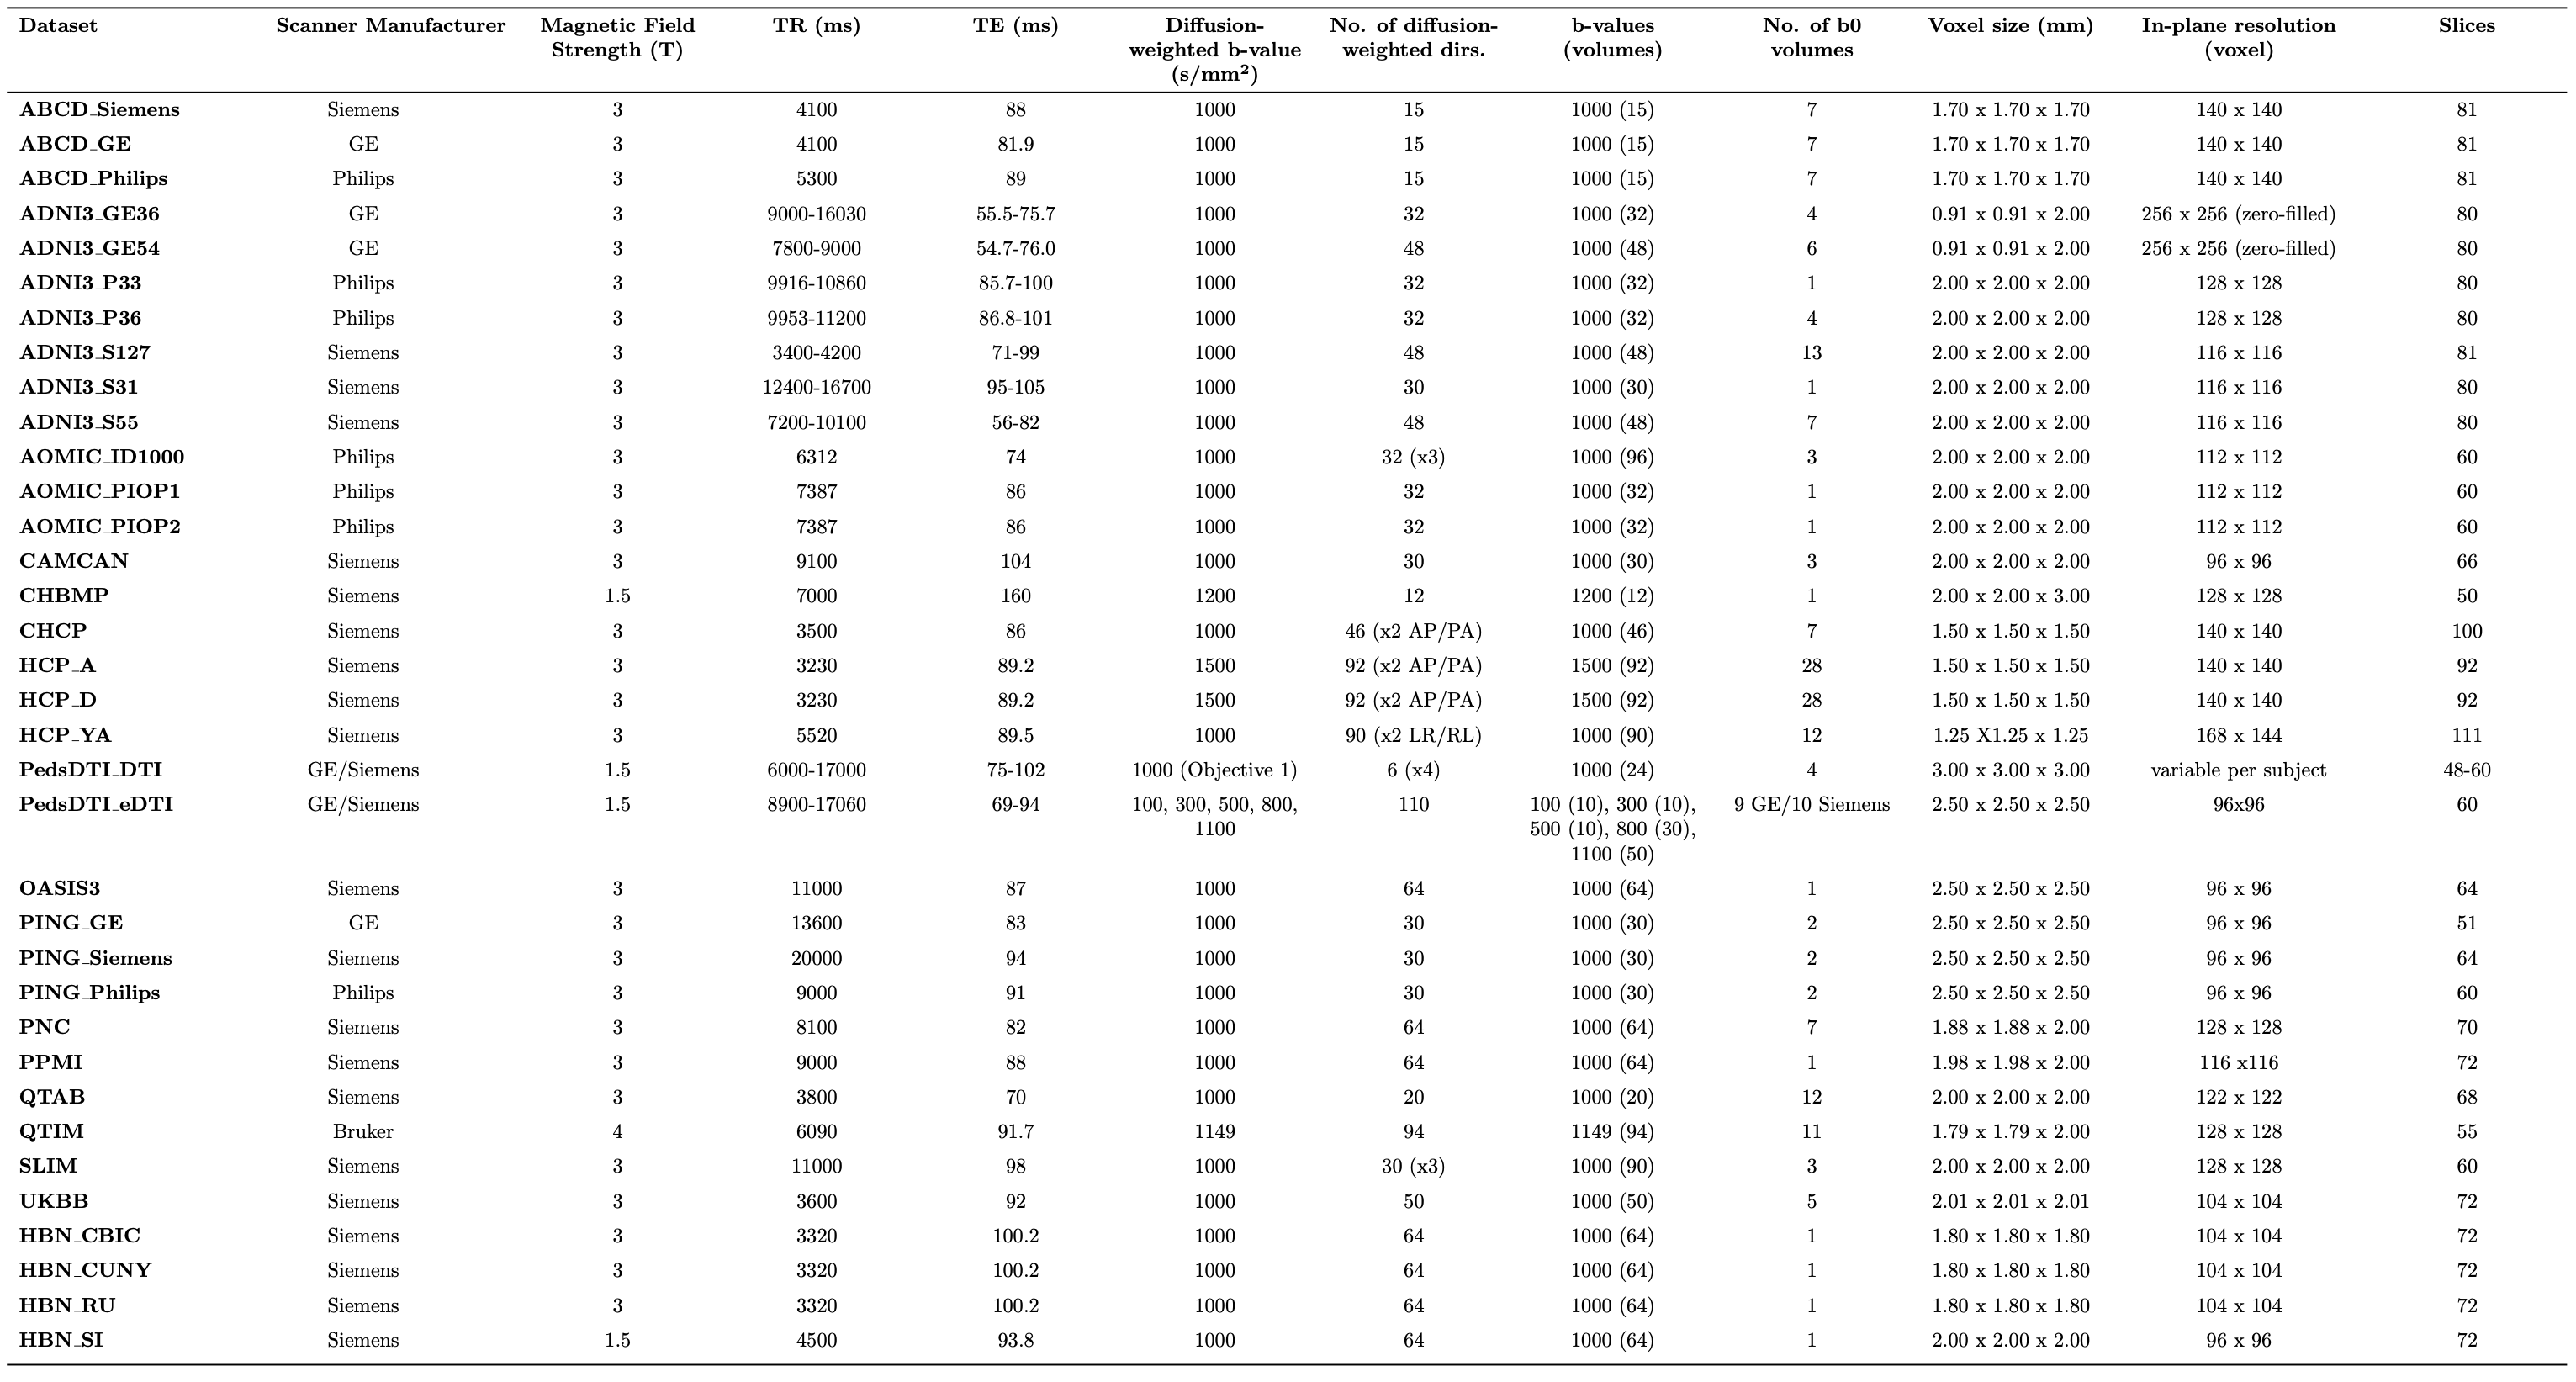
We analyzed data from these cohorts: ABCD2, AOMIC3, CAMCAN4, CHBMP5, CHCP6, HBN7, HCP-A, HCP-D8, HCP-YA9, PedsDTI10, PING11, PNC12, QTAB13, QTIM14, SLIM15, UKBB16, ADNI317, OASIS318 and PPMI19. Because dMRI protocol parameters (e.g., b-values, number of gradient directions, spatial resolution) strongly affect DTI metrics20-25, and due to the correlation between the site and age typically found in neuroimaging cohorts, classic harmonization methods may fail to remove unwanted site-effects and may even remove biological variance that is confounded with site. One alternative to data harmonization in the NM setting is HBR26, which overcomes some of these weaknesses. Our goal was to: 1) establish normative values across the lifespan (3-92 years), for fractional anisotropy (FA), mean diffusivity (MD), radial diffusivity (RD) and axial diffusivity (AD); 2) illustrate the method by characterizing the main effect and age-dependent effects of Alzheimer's disease (AlzD), Mild Cognitive Impairment (MCI) and Parkinson's disease (PD) on DTI. We included 81 patients with AlzD (age: 77.1y±8.4), 225 participants with MCI (age: 75.1y±8.1), and 157 individuals with PD (age: 60.9y±9.5). The datasets used for training are shown in Figure_1. After preprocessing27 and tensor fitting we applied the ENIGMA-DTI protocol28 (based on TBSS29) to all cohorts. Mean FA, MD, RD and AD were extracted for 21 bilateral ROIs from the JHU white matter (WM) atlas and for the whole skeleton (Average_WM). For the HBR, we used age and sex as covariates, with each DTI metric per ROI as the dependent variable and the dMRI protocol as the site effect (Table_1). Age was modeled with a cubic b-spline basis. Training and testing data sets were created with a stratified 80% to 20% sample split. Z-scores were calculated for the test control subjects and for the AlzD, MCI, PD participants as well. ROI-wise areas under the ROC curves (AUCs) were calculated to determine the classification accuracy of these Z-scores, for AlzD, MCI, and PD. Probabilities of abnormality (p-values) were derived from all Z-scores and we controlled the false discovery rate (FDR) on each DTI metric separately across ROIs to identify those that showed significant deviations. For the significant ROIs, we calculated the average of extreme deviations (Z>|2|) for each disease. To achieve stability, we repeated the same procedure 10 times and report the deviations for the ROIs that passed the FDR correction in 9 out of 10 runs.Results
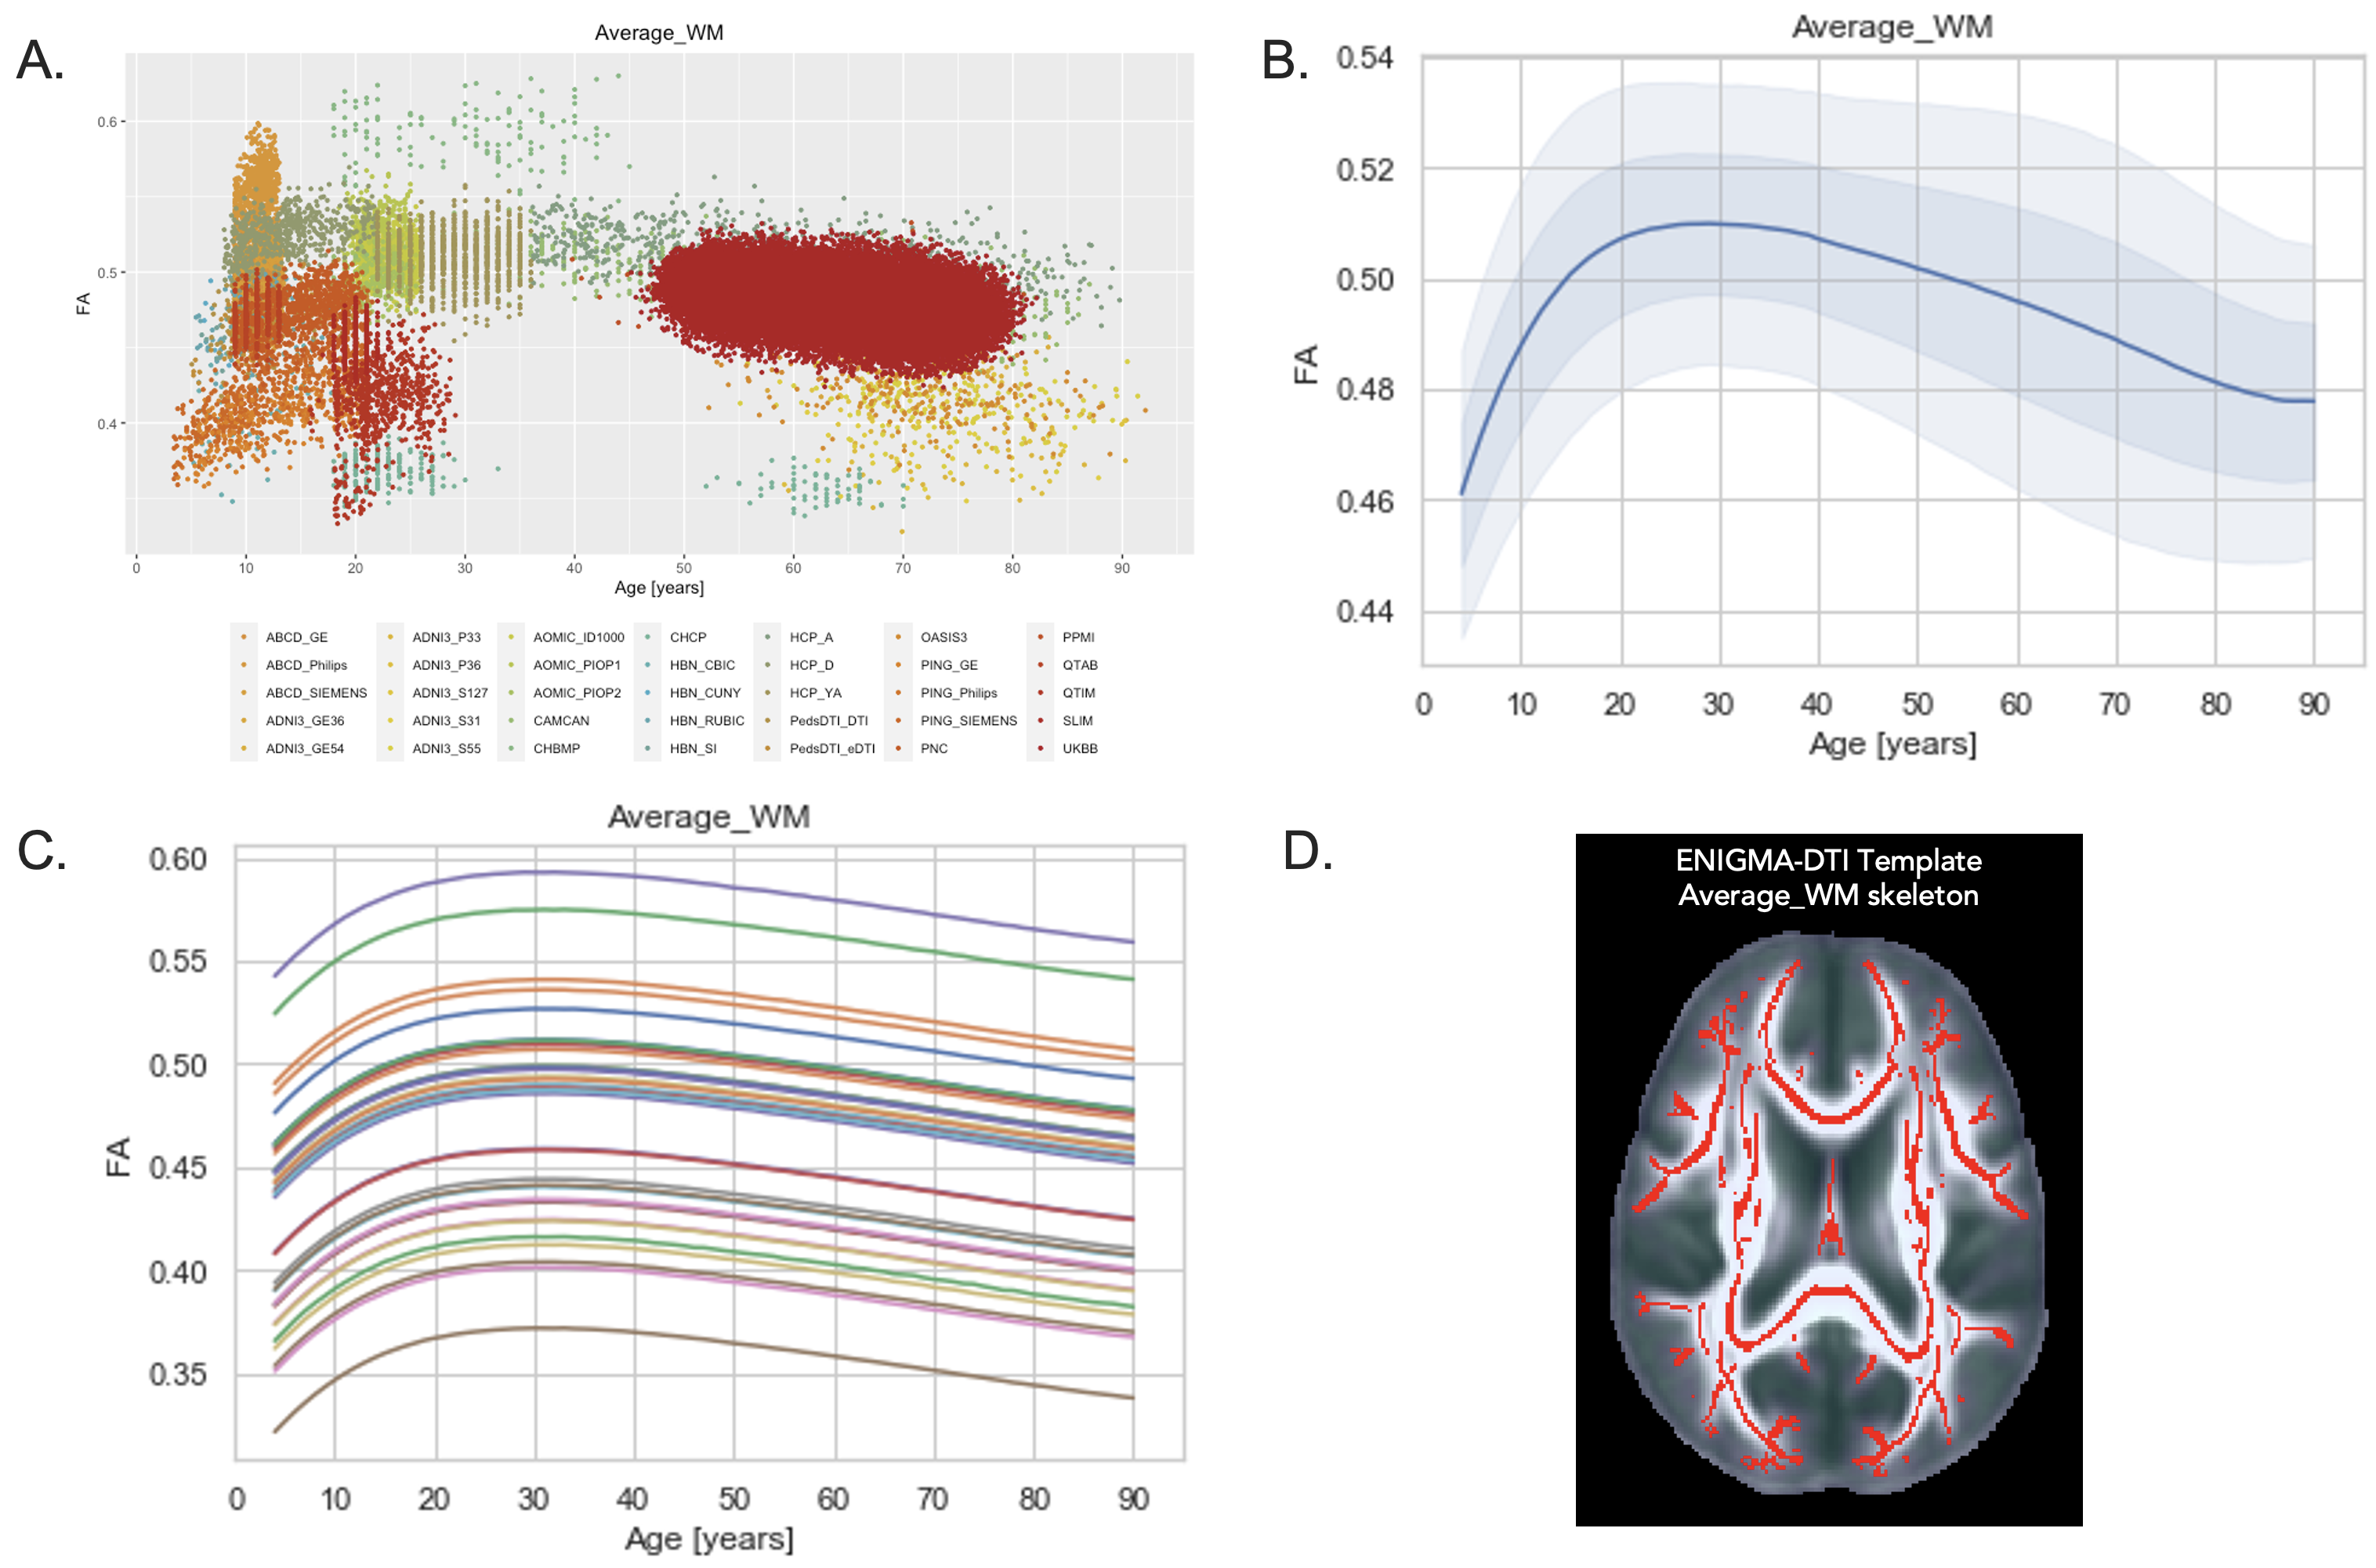
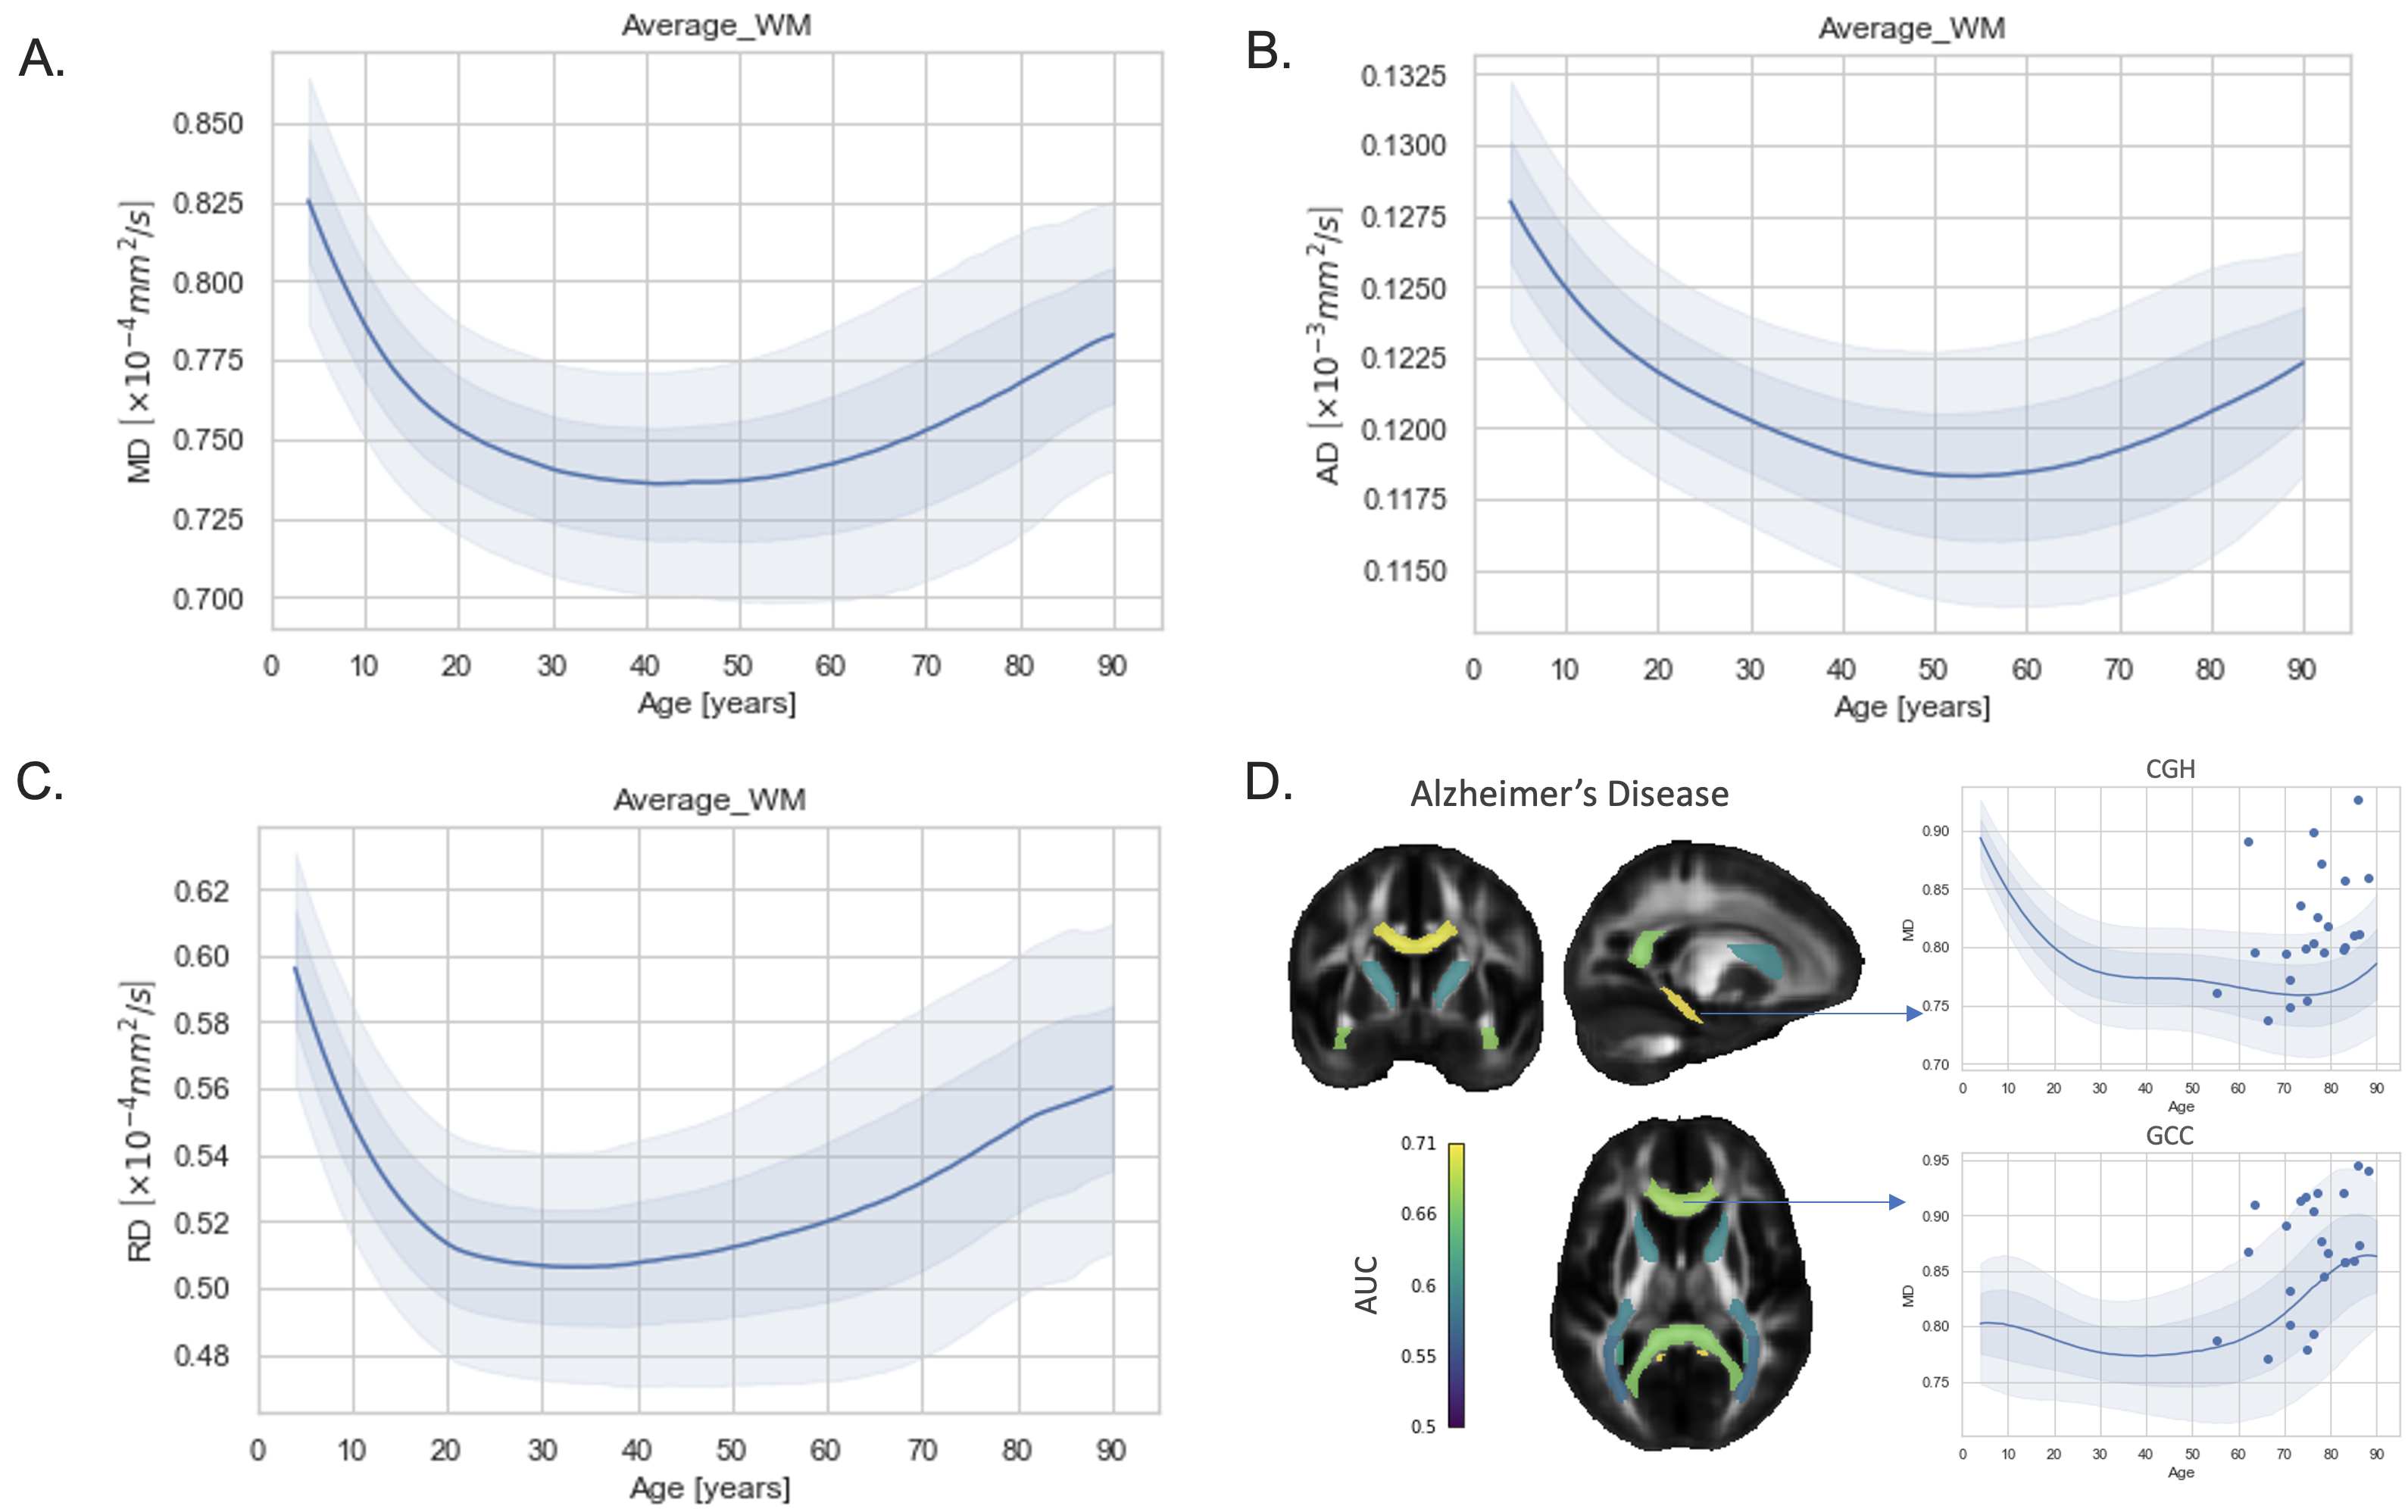
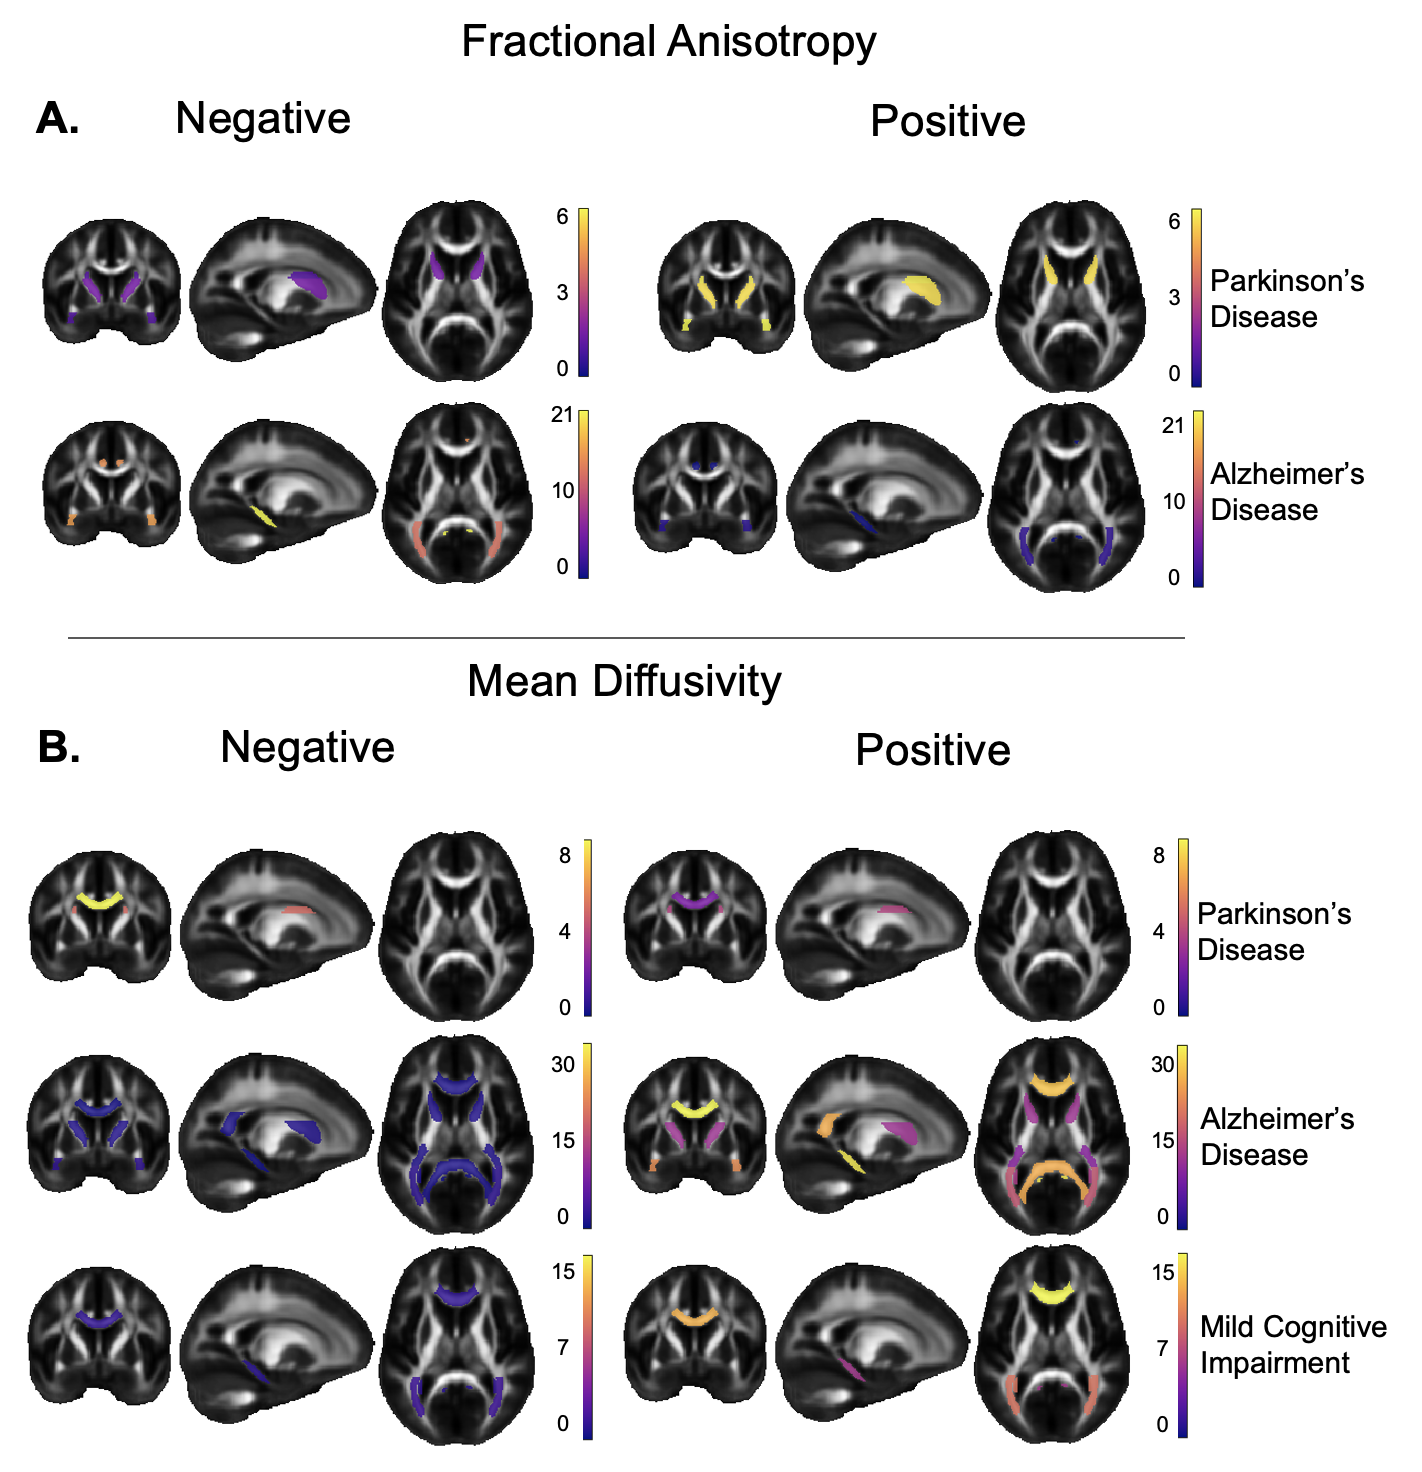
NM with HBR (NM-HBR) was able to delineate lifespan trajectories for the DTI metrics by integrating large-scale multi-site dMRI data. The average FA across the overall WM region shows a peak achieved at around 29 years (Figure_2). Figure_3 shows the lifespan trajectories for average MD, RD and AD in the WM with minima reached at 42, 33 and 54 years, respectively. NM-HBR was able to define site-specific reference models, as the intercept and overall distribution of DTI metrics may vary from protocol to protocol (Figure_2C). NM-HBR was able to identify and quantify extreme deviations in the WM for brain disease. In AlzD, the cingulum/hippocampus region (CGH) gave a classification AUC=0.68 for FA and AUC=0.71 for MD, relative to controls (Figure_3D). In MCI, the best performance was observed in the BCC for MD (AUC=0.58). In PD, the best performance was found in the ALIC for FA (AUC=0.59) and in the SFO for MD (AUC=0.59). Figure_4 shows the overall percentages of significant extreme deviations in both directions (Z>|2|) across all JHU-WM ROIs for AlzD, MCI and PD.Conclusion
We present the largest and first comprehensive international NM of the widely used DTI metrics in the WM. These NM will serve as a reference for future international studies of neurological, psychiatric, and developmental conditions. The current model will help to delineate the profile and trajectory of brain disease and its modulators, as well as enabling individual-level tracking of anomalies, in line with personalized medicine objectives.Acknowledgements
Funded by NIH grants:
RF1AG057892 - FiberNet
R01 MH129858 - Understanding Rare Genetic Variation and Disease Risk: A Global Neurogenetics Initiative
R01AG058854 - ENIGMA World Aging Center
References
1. Rutherford S, Kia SM, Wolfers T, et al.: The normative modeling framework for computational psychiatry. bioRxiv 2021.
2. Casey BJ, Cannonier T, Conley MI, et al.: The Adolescent Brain Cognitive Development (ABCD) study: Imaging acquisition across 21 sites. Dev Cogn Neurosci 2018; 32:43–54.
3. Snoek L, van der Miesen MM, Beemsterboer T, van der Leij A, Eigenhuis A, Steven Scholte H: The Amsterdam Open MRI Collection, a set of multimodal MRI datasets for individual difference analyses. Sci Data 2021; 8:85.
4. Taylor JR, Williams N, Cusack R, et al.: The Cambridge Centre for Ageing and Neuroscience (Cam-CAN) data repository: Structural and functional MRI, MEG, and cognitive data from a cross-sectional adult lifespan sample. Neuroimage 2017; 144(Pt B):262–269.
5. Valdes-Sosa PA, Galan-Garcia L, Bosch-Bayard J, et al.: The Cuban Human Brain Mapping Project, a young and middle age population-based EEG, MRI, and cognition dataset. Sci Data 2021; 8:45.
6. Ge J, Yang G, Han M, et al.: Increasing diversity in connectomics with the Chinese Human Connectome Project. Nat Neurosci 2023; 26:163–172.
7. Alexander LM, Escalera J, Ai L, et al.: An open resource for transdiagnostic research in pediatric mental health and learning disorders. Sci Data 2017; 4:170181.
8. Harms MP, Somerville LH, Ances BM, et al.: Extending the Human Connectome Project across ages: Imaging protocols for the Lifespan Development and Aging projects. Neuroimage 2018; 183:972–984.
9. Van Essen DC, Ugurbil K, Auerbach E, et al.: The Human Connectome Project: a data acquisition perspective. Neuroimage 2012; 62:2222–2231.
10. Walker L, Chang L-C, Nayak A, et al.: The diffusion tensor imaging (DTI) component of the NIH MRI study of normal brain development (PedsDTI). Neuroimage 2016; 124(Pt B):1125–1130.
11. Jernigan TL, Brown TT, Hagler DJ Jr, et al.: The Pediatric Imaging, Neurocognition, and Genetics (PING) Data Repository. Neuroimage 2016; 124(Pt B):1149–1154.
12. Satterthwaite TD, Connolly JJ, Ruparel K, et al.: The Philadelphia Neurodevelopmental Cohort: A publicly available resource for the study of normal and abnormal brain development in youth. Neuroimage 2016; 124(Pt B):1115–1119.
13. Strike LT, Hansell NK, Chuang K-H, et al.: The Queensland Twin Adolescent Brain Project, a longitudinal study of adolescent brain development. Sci Data 2023; 10:195.
14. de Zubicaray GI, Chiang M-C, McMahon KL, et al.: Meeting the Challenges of Neuroimaging Genetics. Brain Imaging Behav 2008; 2:258–263.
15. Liu W, Wei D, Chen Q, et al.: Longitudinal test-retest neuroimaging data from healthy young adults in southwest China. Sci Data 2017; 4:170017.
16. Miller KL, Alfaro-Almagro F, Bangerter NK, et al.: Multimodal population brain imaging in the UK Biobank prospective epidemiological study. Nat Neurosci 2016; 19:1523–1536.
17. Zavaliangos-Petropulu A, Nir TM, Thomopoulos SI, et al.: Diffusion MRI Indices and Their Relation to Cognitive Impairment in Brain Aging: The Updated Multi-protocol Approach in ADNI3. Front Neuroinform 2019; 13:2.
18. LaMontagne PJ, Benzinger TLS, Morris JC, et al.: OASIS-3: Longitudinal neuroimaging, clinical, and cognitive dataset for normal aging and Alzheimer disease. bioRxiv 2019.
19. Parkinson Progression Marker Initiative: The Parkinson Progression Marker Initiative (PPMI). Prog Neurobiol 2011; 95:629–635.
20. Landman BA, Farrell JAD, Jones CK, Smith SA, Prince JL, Mori S: Effects of diffusion weighting schemes on the reproducibility of DTI-derived fractional anisotropy, mean diffusivity, and principal eigenvector measurements at 1.5T. Neuroimage 2007; 36:1123–1138.
21. Alexander AL, Lee JE, Wu Y-C, Field AS: Comparison of diffusion tensor imaging measurements at 3.0 T versus 1.5 T with and without parallel imaging. Neuroimaging Clin N Am 2006; 16:299–309, xi.
22. Santarelli X, Garbin G, Ukmar M, Longo R: Dependence of the fractional anisotropy in cervical spine from the number of diffusion gradients, repeated acquisition and voxel size. Magn Reson Imaging 2010; 28:70–76.
23. Zhan L, Leow AD, Jahanshad N, et al.: How does angular resolution affect diffusion imaging measures? Neuroimage 2010; 49:1357–1371.
24. Zhan L, Jahanshad N, Ennis DB, et al.: Angular versus spatial resolution trade-offs for diffusion imaging under time constraints. Hum Brain Mapp 2013; 34:2688–2706.
25. Zhan L, Mueller BA, Jahanshad N, et al.: Magnetic resonance field strength effects on diffusion measures and brain connectivity networks. Brain Connect 2013; 3:72–86.
26. Kia SM, Huijsdens H, Rutherford S, et al.: Closing the life-cycle of normative modeling using federated hierarchical Bayesian regression. PLoS One 2022; 17:e0278776.
27. Villalón-Reina JE, Moreau CA, Nir TM, et al.: Multi-site normative modeling of diffusion tensor imaging metrics using hierarchical Bayesian regression. In Lecture Notes in Computer Science. Cham: Springer Nature Switzerland; 2022:207–217. [Lecture Notes in Computer Science]
28. Jahanshad N, Kochunov PV, Sprooten E, et al.: Multi-site genetic analysis of diffusion images and voxelwise heritability analysis: a pilot project of the ENIGMA-DTI working group. Neuroimage 2013; 81:455–469.
29. Smith SM, Jenkinson M, Johansen-Berg H, et al.: Tract-based spatial statistics: voxelwise analysis of multi-subject diffusion data. Neuroimage 2006; 31:1487–1505.
Figures