0138
Age-related differences in macromolecular resonances observed in ultra-short-TE STEAM MR spectra at 7 T1Center for Magnetic Resonance Research, Department of Radiology, University of Minnesota, Minneapolis, MN, United States, 2Department of Neurology, Charles University, First Faculty of Medicine and General University Hospital, Prague, Czech Republic, 3Geriatric Research, Education and Clinical Center, Veterans Affairs Health Care System, Minneapolis, MN, United States, 4Department of Neurology, University of Minnesota, Minneapolis, MN, United States, 5Department of Psychiatry, University of Minnesota, Minneapolis, MN, United States
Synopsis
Keywords: Spectroscopy, Data Analysis, Macromolecules, LCModel, ultra-high field
Motivation: Macromolecular signals mainly originate from amino-acids within flexible cytosolic proteins, contributing to 1H-MR spectra. Previous studies have yielded inconsistent results regarding age-related differences in macromolecular resonances.
Goal(s): To investigate the macromolecular content across a wide age range in a large cohort of healthy participants.
Approach: Spectroscopy data were acquired at 7 T. The macromolecular content was investigated in 134 datasets from a cohort ranging in age from 19 to 89 years.
Results: Age-related effects were observed for macromolecular peaks. Some macromolecular resonances had significantly higher content at 30-40 years of age while others at 60-70 years of age.
Impact: Our findings strengthen the necessity of using age-matched measured macromolecules during quantification of metabolite concentrations. The ability to detect differences in macromolecular content may be helpful for understanding the neurodegenerative processes associated with aging.
Introduction
Macromolecular signals contribute to short/medium TE 1H-MR spectra acquired at ultra-high field strength1. These signals mainly originate from amino-acids within flexible cytosolic proteins2,3.It is crucial to properly account for macromolecular signals in order to achieve an accurate quantification of metabolite concentrations, and using experimentally measured macromolecular spectra is recommended4. However, acquiring both standard and macromolecular spectra in the same session is time consuming, leading to the use of macromolecular data from representative subjects. Additionally, age-matched measured macromolecules should improve the accuracy of metabolite quantification because age-related differences in macromolecular content have been reported5. But recent studies have questioned these previous findings6,7.In this work, we aimed to comprehensively assess the macromolecular content across a wide age range in the ultra-short TE 7-T spectra from a large cohort of healthy participants.Methods
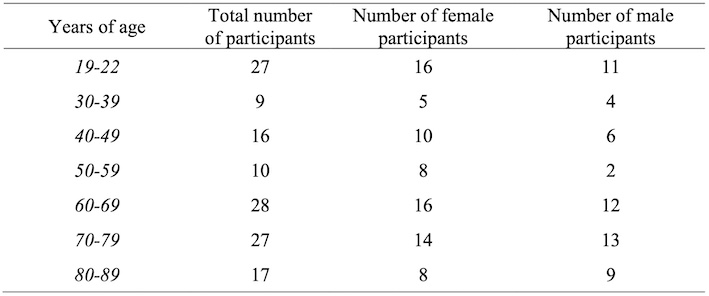
Dataset: 134 spectra were acquired from the posterior cingulate cortex of healthy participants aged 19 to 89 years. In Table 1 age stratification of the cohort is reported.MR protocol: data were acquired on a 7 T system (magnet: Magnex Scientific, Oxford, UK; console: Siemens, Erlangen, Germany) using a 16-channel Tx/Rx coil8. B1+ shimming9 of the phase was employed for each coil channel to maximize the transmit B1 in the VOI (2x2x2 cm3). B0 shimming of first- and second-order terms was performed in the VOI using FAST(EST)MAP10. B1 field for the 90° pulse was calibrated for each subject. Spectra were acquired with ultra-short TE STEAM sequence (TR/TE/TM = 5/8/32 ms)11 and individually saved (128 averages; 2048 complex points; spectral width = 6 kHz). A water spectrum was acquired with the same parameters in the VOI.
Spectral processing was performed for correcting eddy current effects, and phase and frequency drifts.
Quantification of macromolecular resonances at ~0.9 (MM09), ~1.2 (MM12), ~1.4 (MM14), ~1.7 (MM17), and ~2.0 ppm (MM20) was performed using LCModel12 with three different approaches: 1. a macromolecular resonances model developed for this study (parMM); 2. LCModel-simulated macromolecules (lcMM); 3. a combination of measured and LCModel-simulated macromolecules (Y-lcMM). Briefly, parMM consisted of twenty-eight independent Voigt peaks with previously published linewidths and resonances. Ratio concentration priors were imposed for the Voigt peaks. For all the approaches a simulated metabolite basis set was included. Macromolecular contents were corrected for gray matter (GM), white matter (WM), and cerebral spinal fluid (CSF) content.
Statistics: the effect of age on the macromolecular content was investigated by considering age both as a continuous variable (i.e., linear regressions) and as a categorical variable (i.e., multiple comparisons among the sub-groups reported in Table 1). Considering age as a categorical variable allowed us to provide insights into non-linear age-related effects.
Results and Discussion
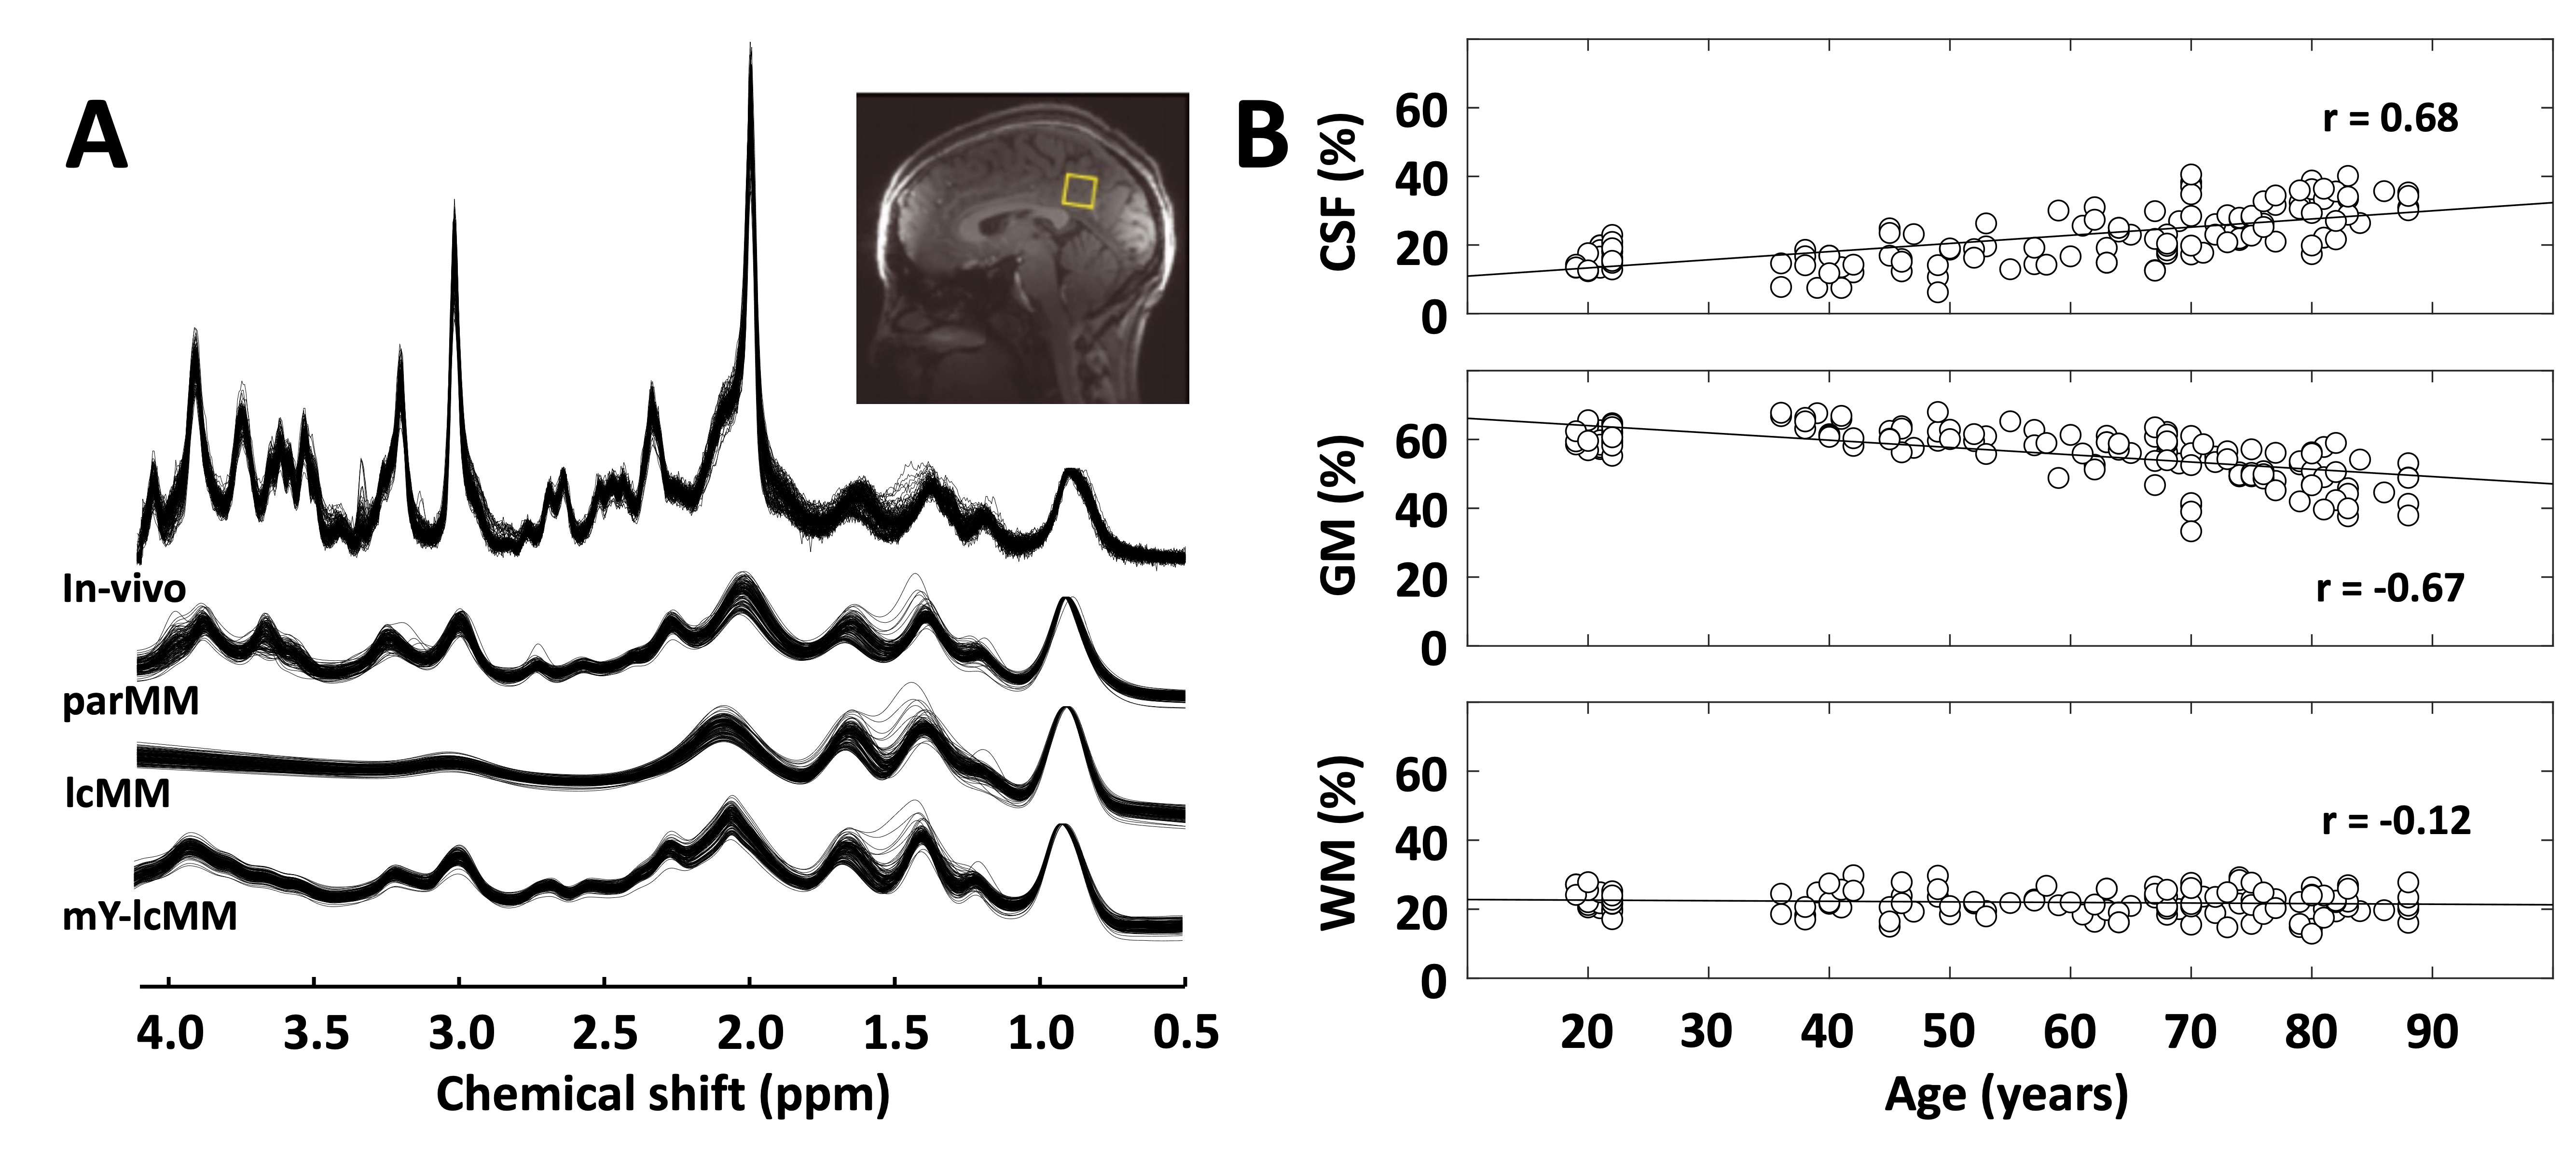
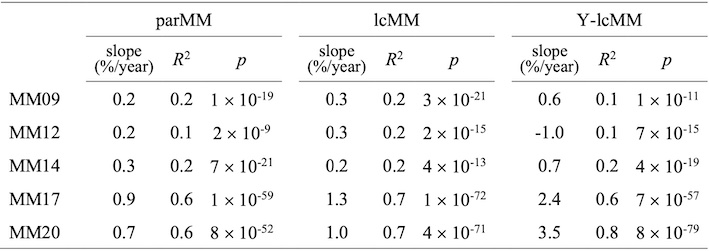
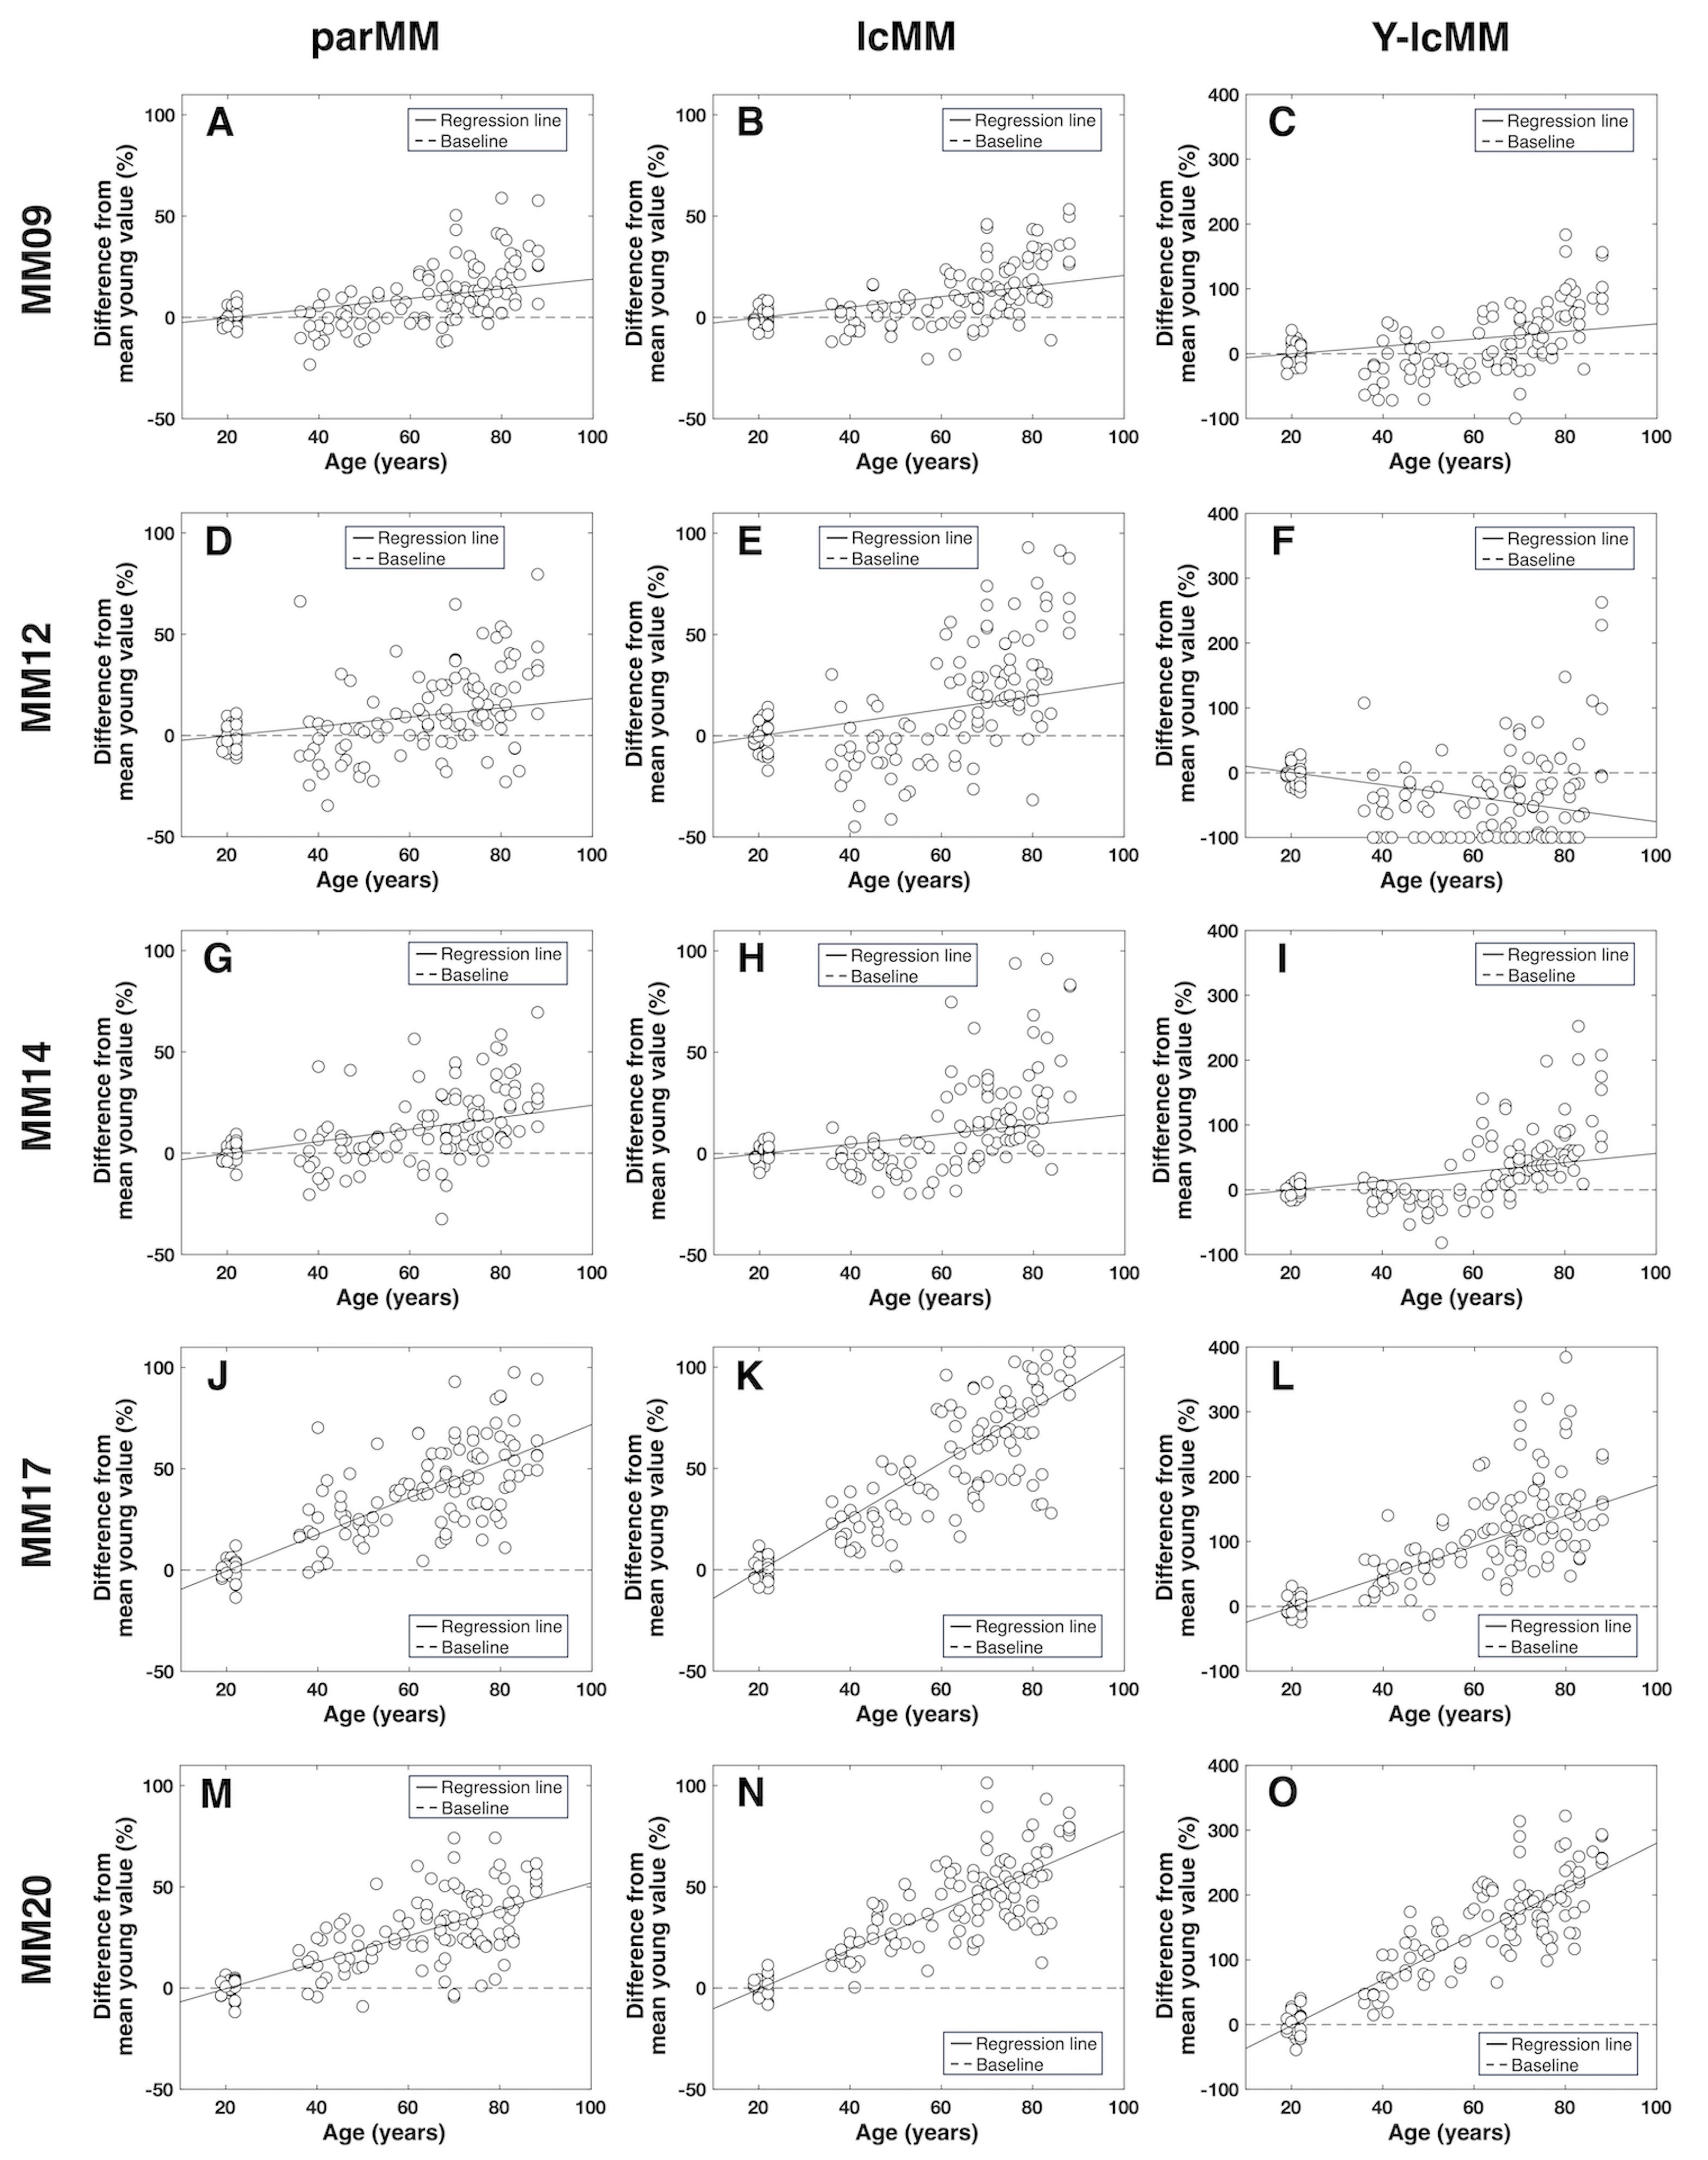
Spectra with very high signal-to-noise ratio (200 ± 42; based on the signal intensity at 2.01 ppm and the noise in the range between -1.00 and -2.00 ppm) and narrow linewidths (11.1 ± 1.3 Hz; based on the resonance peak at 3.03 ppm) were acquired (Figure 1A). Significant correlations (Figure 1B) were observed between CSF and age (r = 0.68, p = 2 ×10-19), and between GM and age (r = - 0.67, p = 2 ×10-19). For each macromolecular resonance the three approaches showed very similar behaviors (Table 2), except for MM12 with Y-lcMM, suggesting that our results are not biased by the choice of the fitting procedure. For MM17 and MM20 (Figure 2J-O), age had moderate to strong effect (0.6 ≤ R2 ≤ 0.8), with increases in signal intensity at younger ages starting from 30 or 40 years of age. These findings strengthen the necessity of using measured macromolecules that closely match the age of the study participants for accurately fitting metabolite spectra. Also, they may be indicative of neurodegenerative processes, including increased membrane turnover and active astrogliosis5,13. For MM09, MM12, and MM14 (Figure 2A-I), age had weak or no effect (R2 ≤ 0.2), with significant increases starting from 60 or 70 years of age. These age-related differences may arise from the tissue content differences in CSF and GM, which are known to be age-associated. However, these increases may also be linked to age-associated mechanisms starting at 70 years of age, such as cell death and inflammation14,15.Conclusions
Our findings provide insights into age-related differences in macromolecular contents and strengthen the necessity of using age-matched measured macromolecules during quantification. Targeting MM17 and MM20 may be helpful for understanding the neurodegenerative processes associated with aging.Acknowledgements
The authors would like to thank Michael Wolf, for study coordination, William Mantyh, MD, for screening some older adults, Jeromy Thotland, Ph.D., for acquiring some datasets, Edward J. Auerbach, Ph.D., for implementation of the STEAM and FAST(EST)MAP sequences on Siemens scanners, Dinesh K. Deelchand, PhD, for providing the basis set for LCModel, Andrea Grant, Ph.D., for development and implementation of the process for segmenting images and for calculation of the CSF content of the VOI of some datasets, Emily Kittelson for image segmentation of some datasets, and Michal Považan, Ph.D., for useful discussion about his macromolecular model.Funding: This work was supported by the National Institutes of Health [grant numbers R01AG05591, R01AG039396, P41 EB027061, P30 NS076408, U19AG073585].References
[1] M Marjańska et al., NMR Biomed. (2012).[2] Behar KL et al., Magn Reson Med. (1993).[3] Behar KL et al., Magn Reson Med. (1994).[4] C Cudalbu et al., NMR Biomed. (2021).[5] M Marjańska et al., NMR Biomed. (2018).[6] Hui SCN et al., Magn Reson Med. (2022).[7] Zöllner HJ et al., NMR Biomed. (2023).[8] Adriany G et al., Magn Reson Med. (2008).[9] Metzger GJ et al., Magn Reson Med. (2008).[10] Gruetter R et al., Magn Reson Med. (2000).[11] Tkáč I et al., Magn Reson Med. (2001).[12] Provencher SW et al., Magn Reson Med. (1993).[13] Marjańska M et al., Neuroscience (2017).[14] Saunders DE et al., J Magn Reson Imaging (1997).[15] Graham GD et al., Stroke (2001).Figures