0136
Structural connectome shapes the maturation of cortical morphology from childhood to adolescence1State Key Laboratory of Cognitive Neuroscience and Learning, Beijing Normal University, Beijing, China, 2School of Systems Science, Beijing Normal University, Beijing, China, 3Center for MRI Research, Academy for Advanced Interdisciplinary Studies, Peking University, Beijing, China, 4Beijing Huilongguan Hospital, Beijing, China
Synopsis
Keywords: Structural Connectivity, Brain Connectivity, Adolescents
Motivation: Cortical thinning is an important hallmark of the maturation of brain morphology during childhood and adolescence. However, the connectome-based wiring mechanism that underlies cortical maturation remains unclear.
Goal(s): We aim to model how the maturational pattern of cortical morphology is shaped by white matter connectome architecture.
Approach: We integrated neuroimaging, connectome, transcriptome analyses and computational modeling.
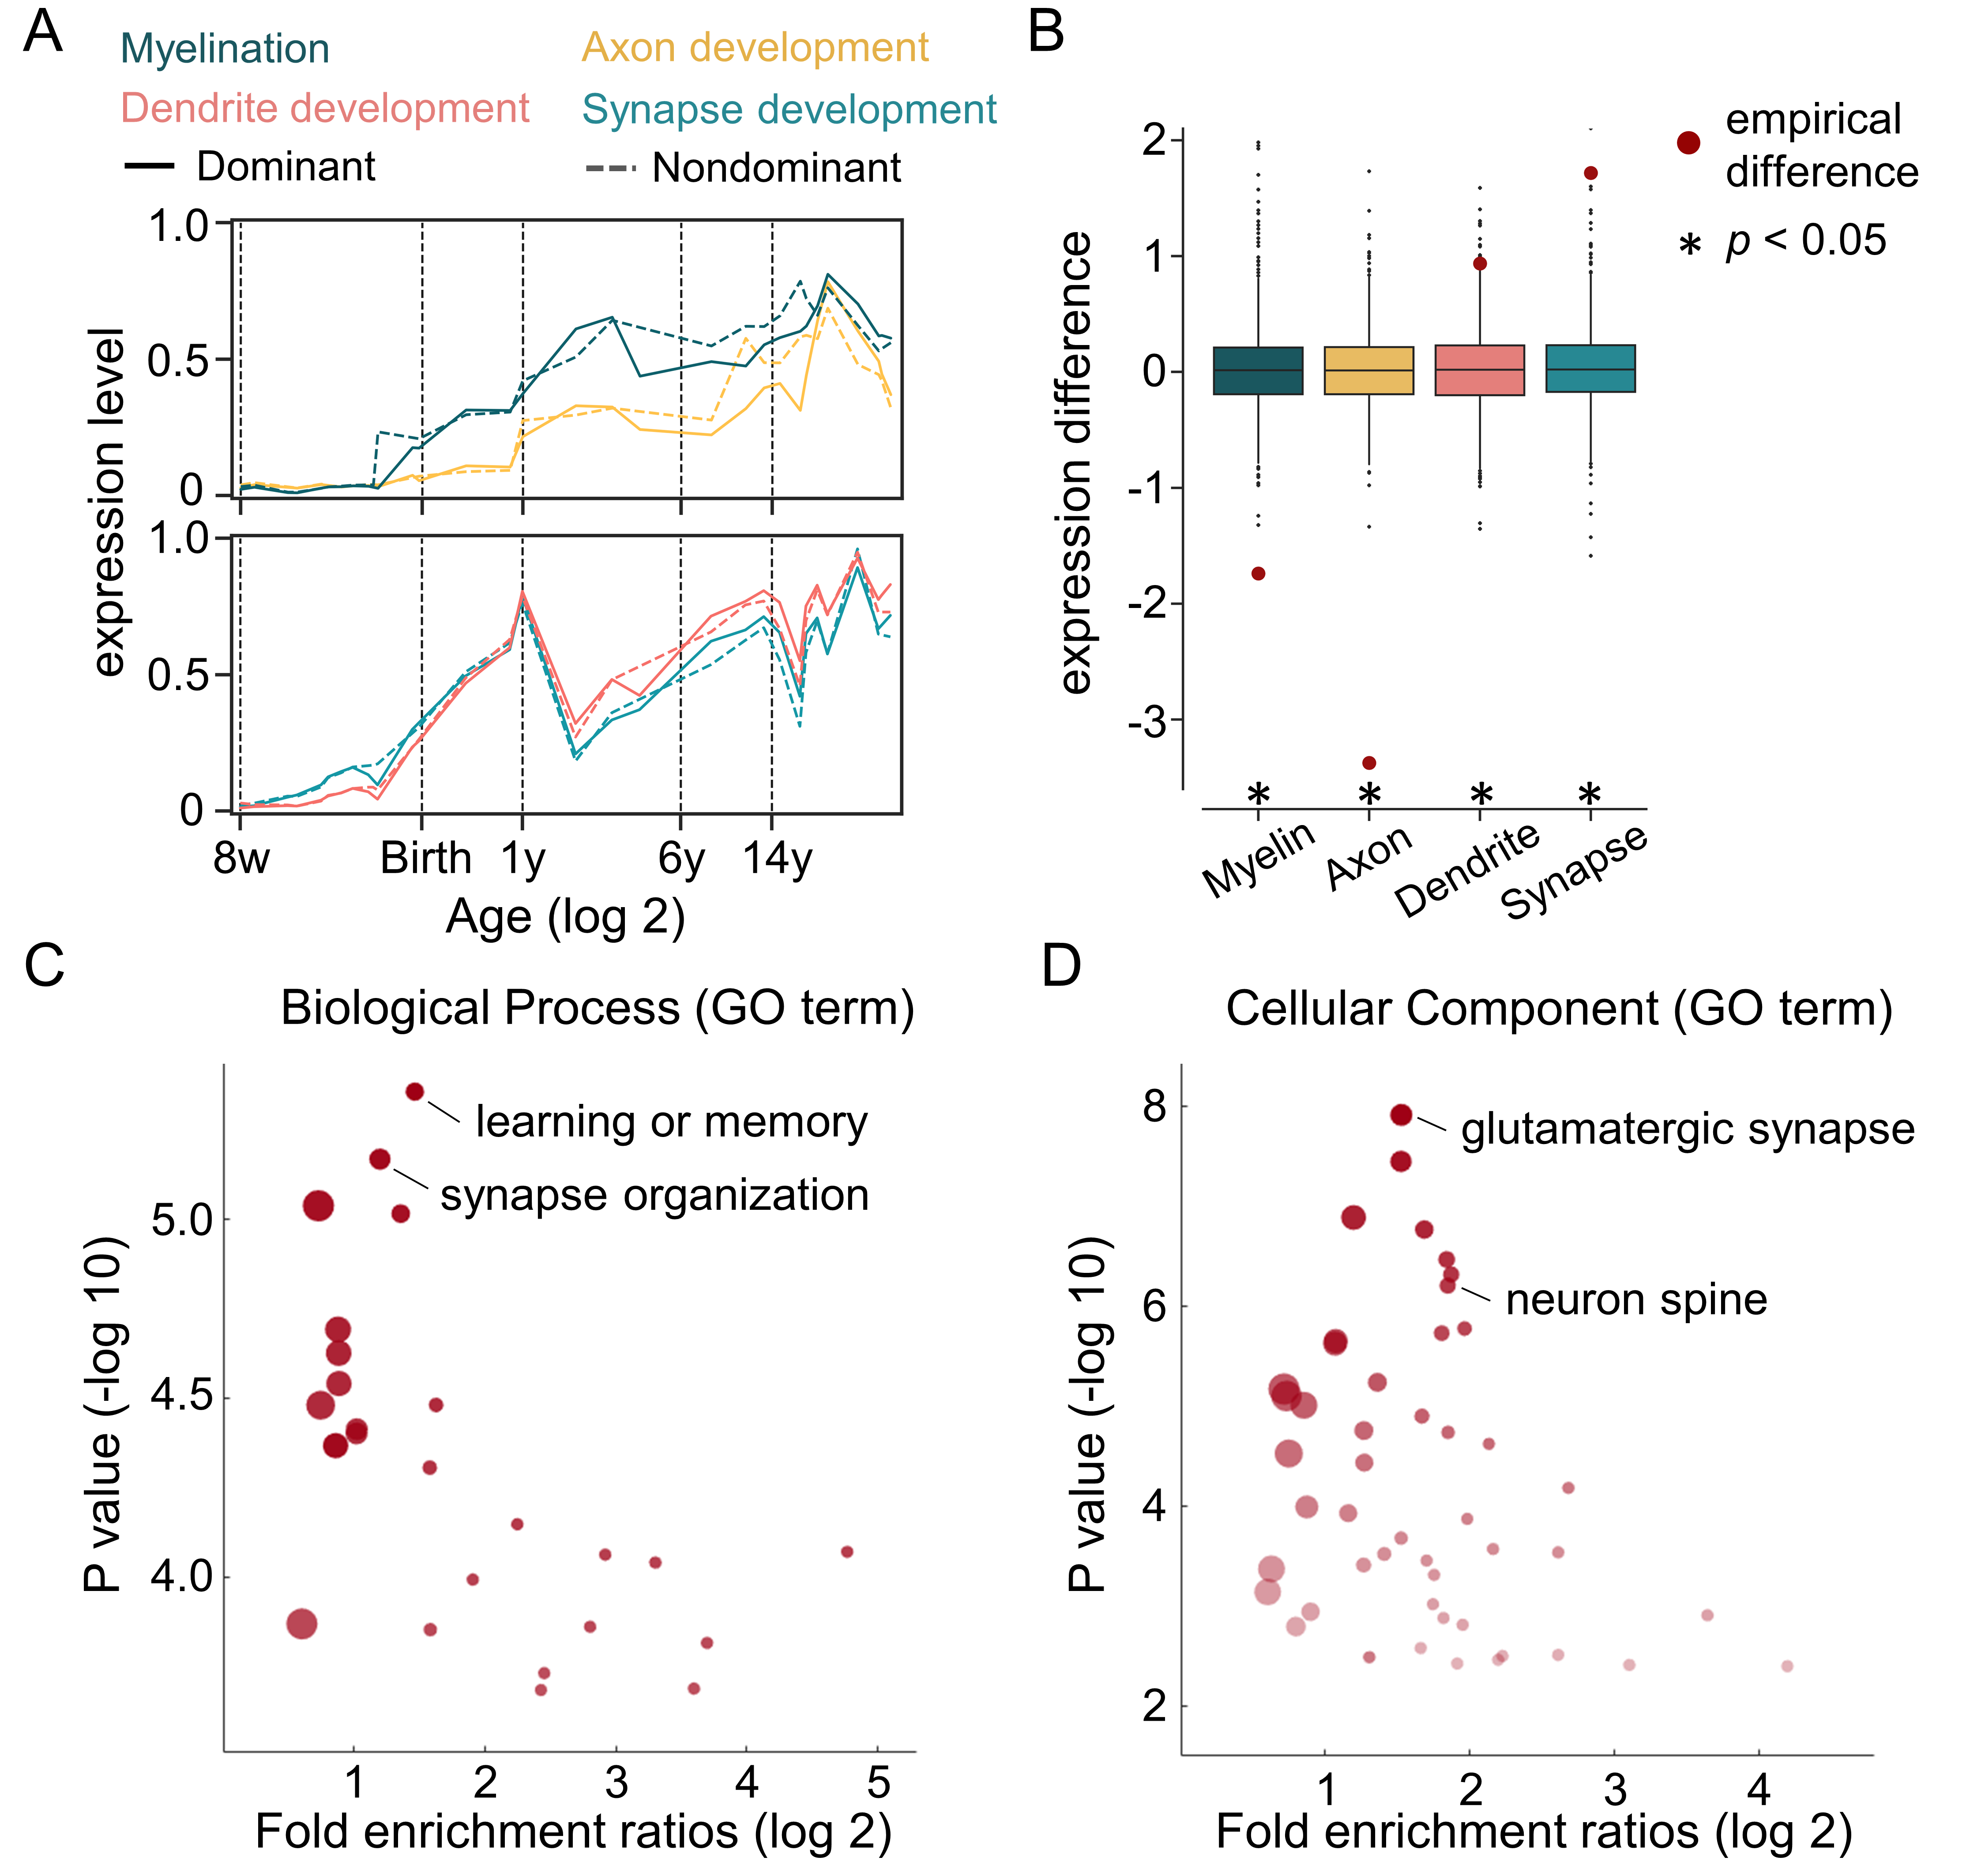
Results: We found that the maturational patterns of cortical morphology are constrained by the white matter connectome and are particularly represented using a network-based diffusion model. Such constraints are predominantly located in frontoparietal nodes and are linked with the expression of genes associated with microstructural developmental processes.
Impact: Our results highlight the importance of white matter network structure in shaping the coordinated maturation of regional cortical morphology, which demonstrates the feasibility of using a network model to reveal the maturational principle of cortical morphology from childhood to adolescence.
Background
The transition period from childhood to adolescence is characterized by prominent reorganization of cortical morphology1. However, whether and how the spatial maturation of cortical thickness (CT) is constrained by underlying white matter (WM) network structure remains largely unknown. Here, we address these issues by implementing connectome and computational modeling analyses on 521 longitudinal brain structural and diffusion magnetic resonance imaging (dMRI) scans from typically developing children and adolescents.Methods
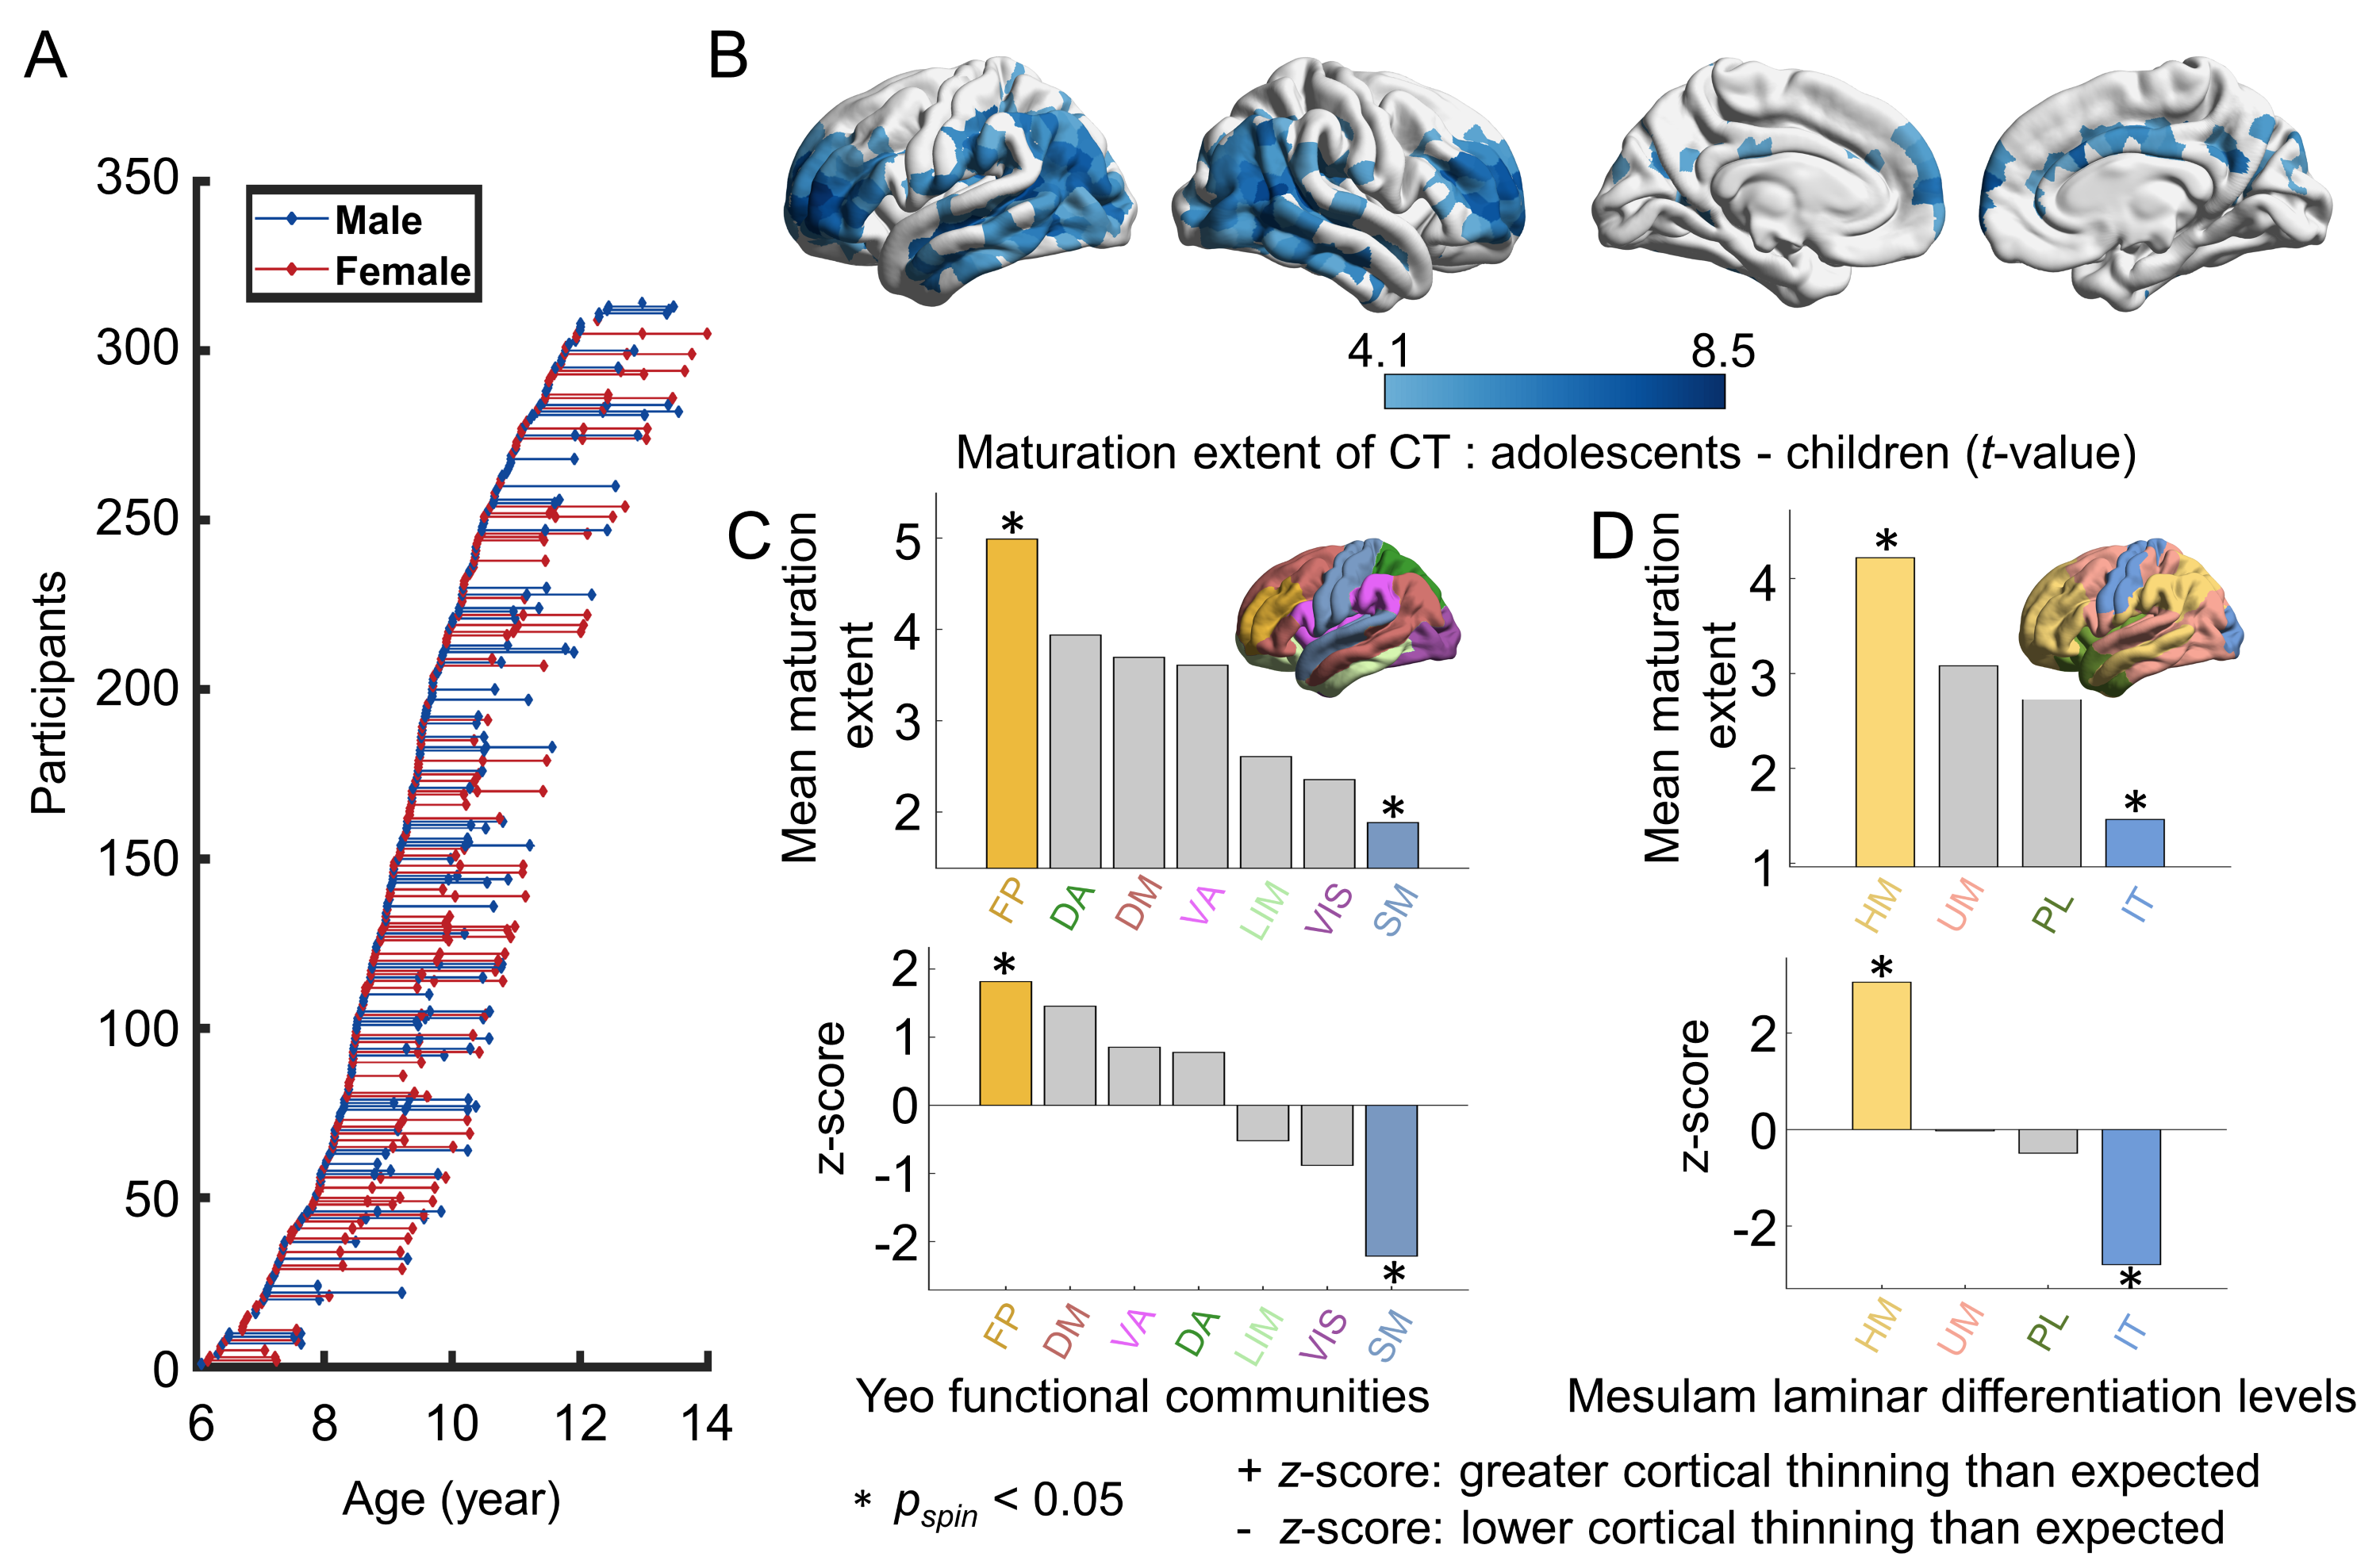
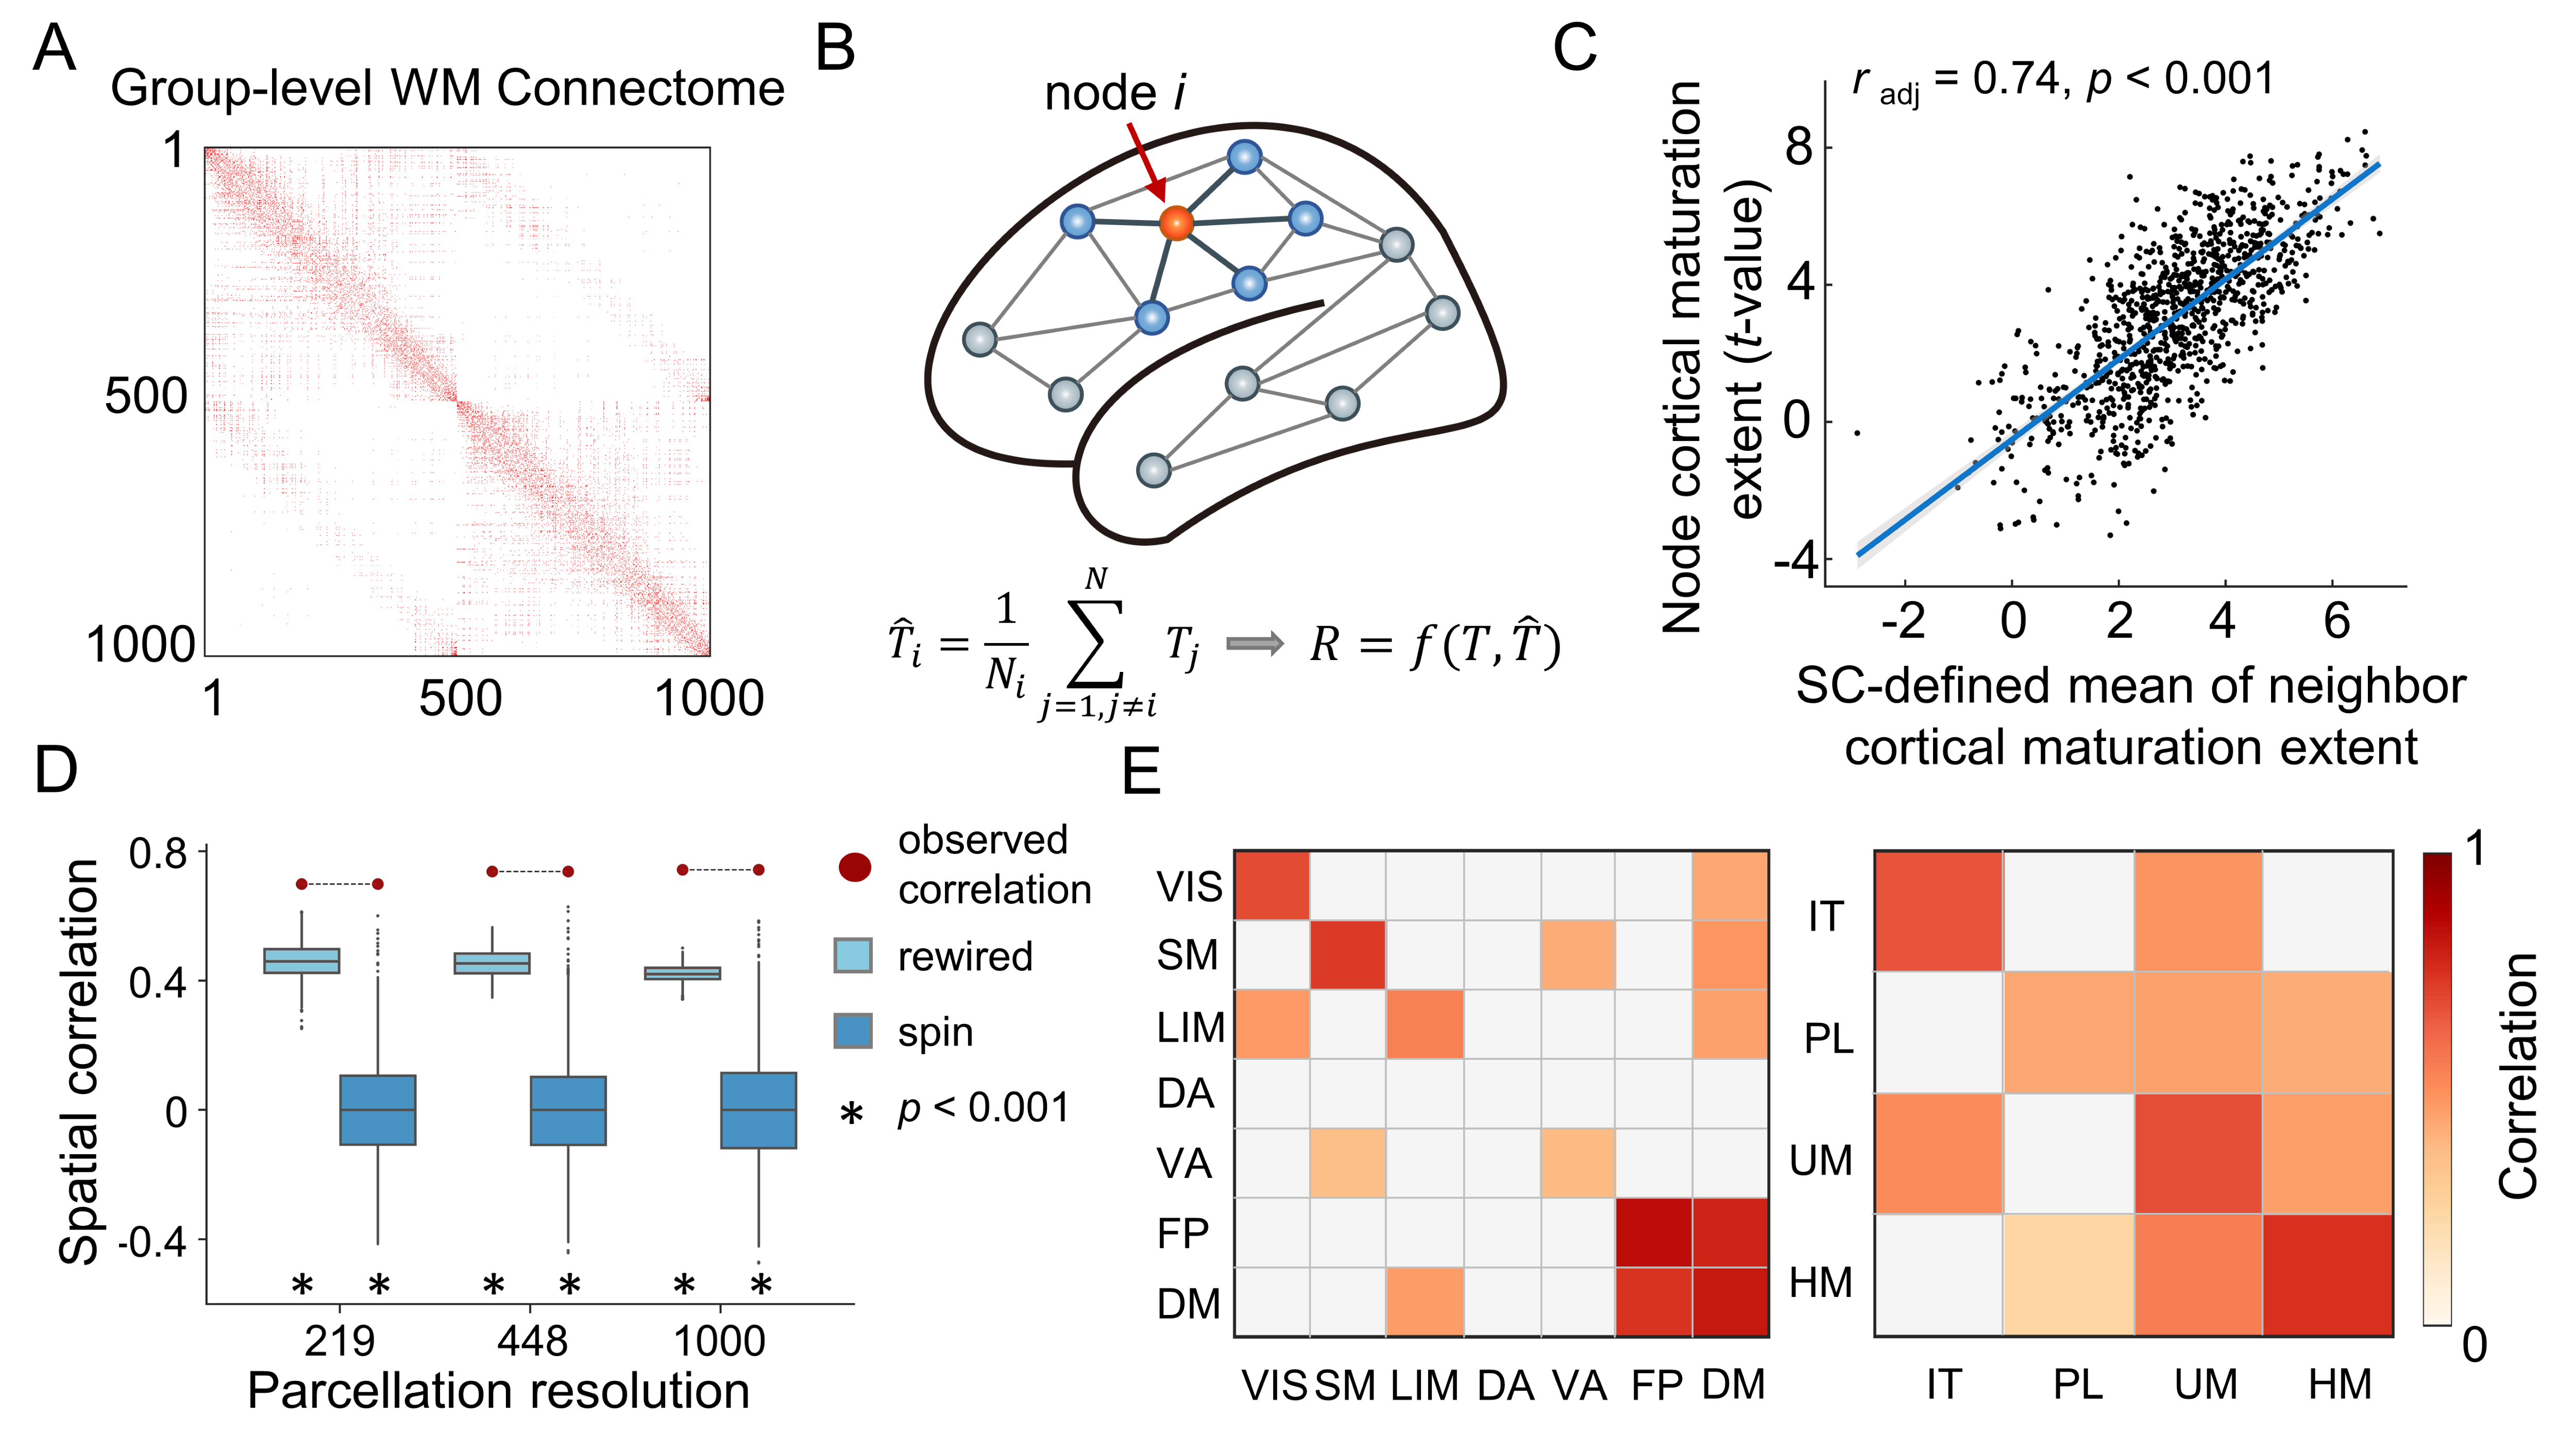
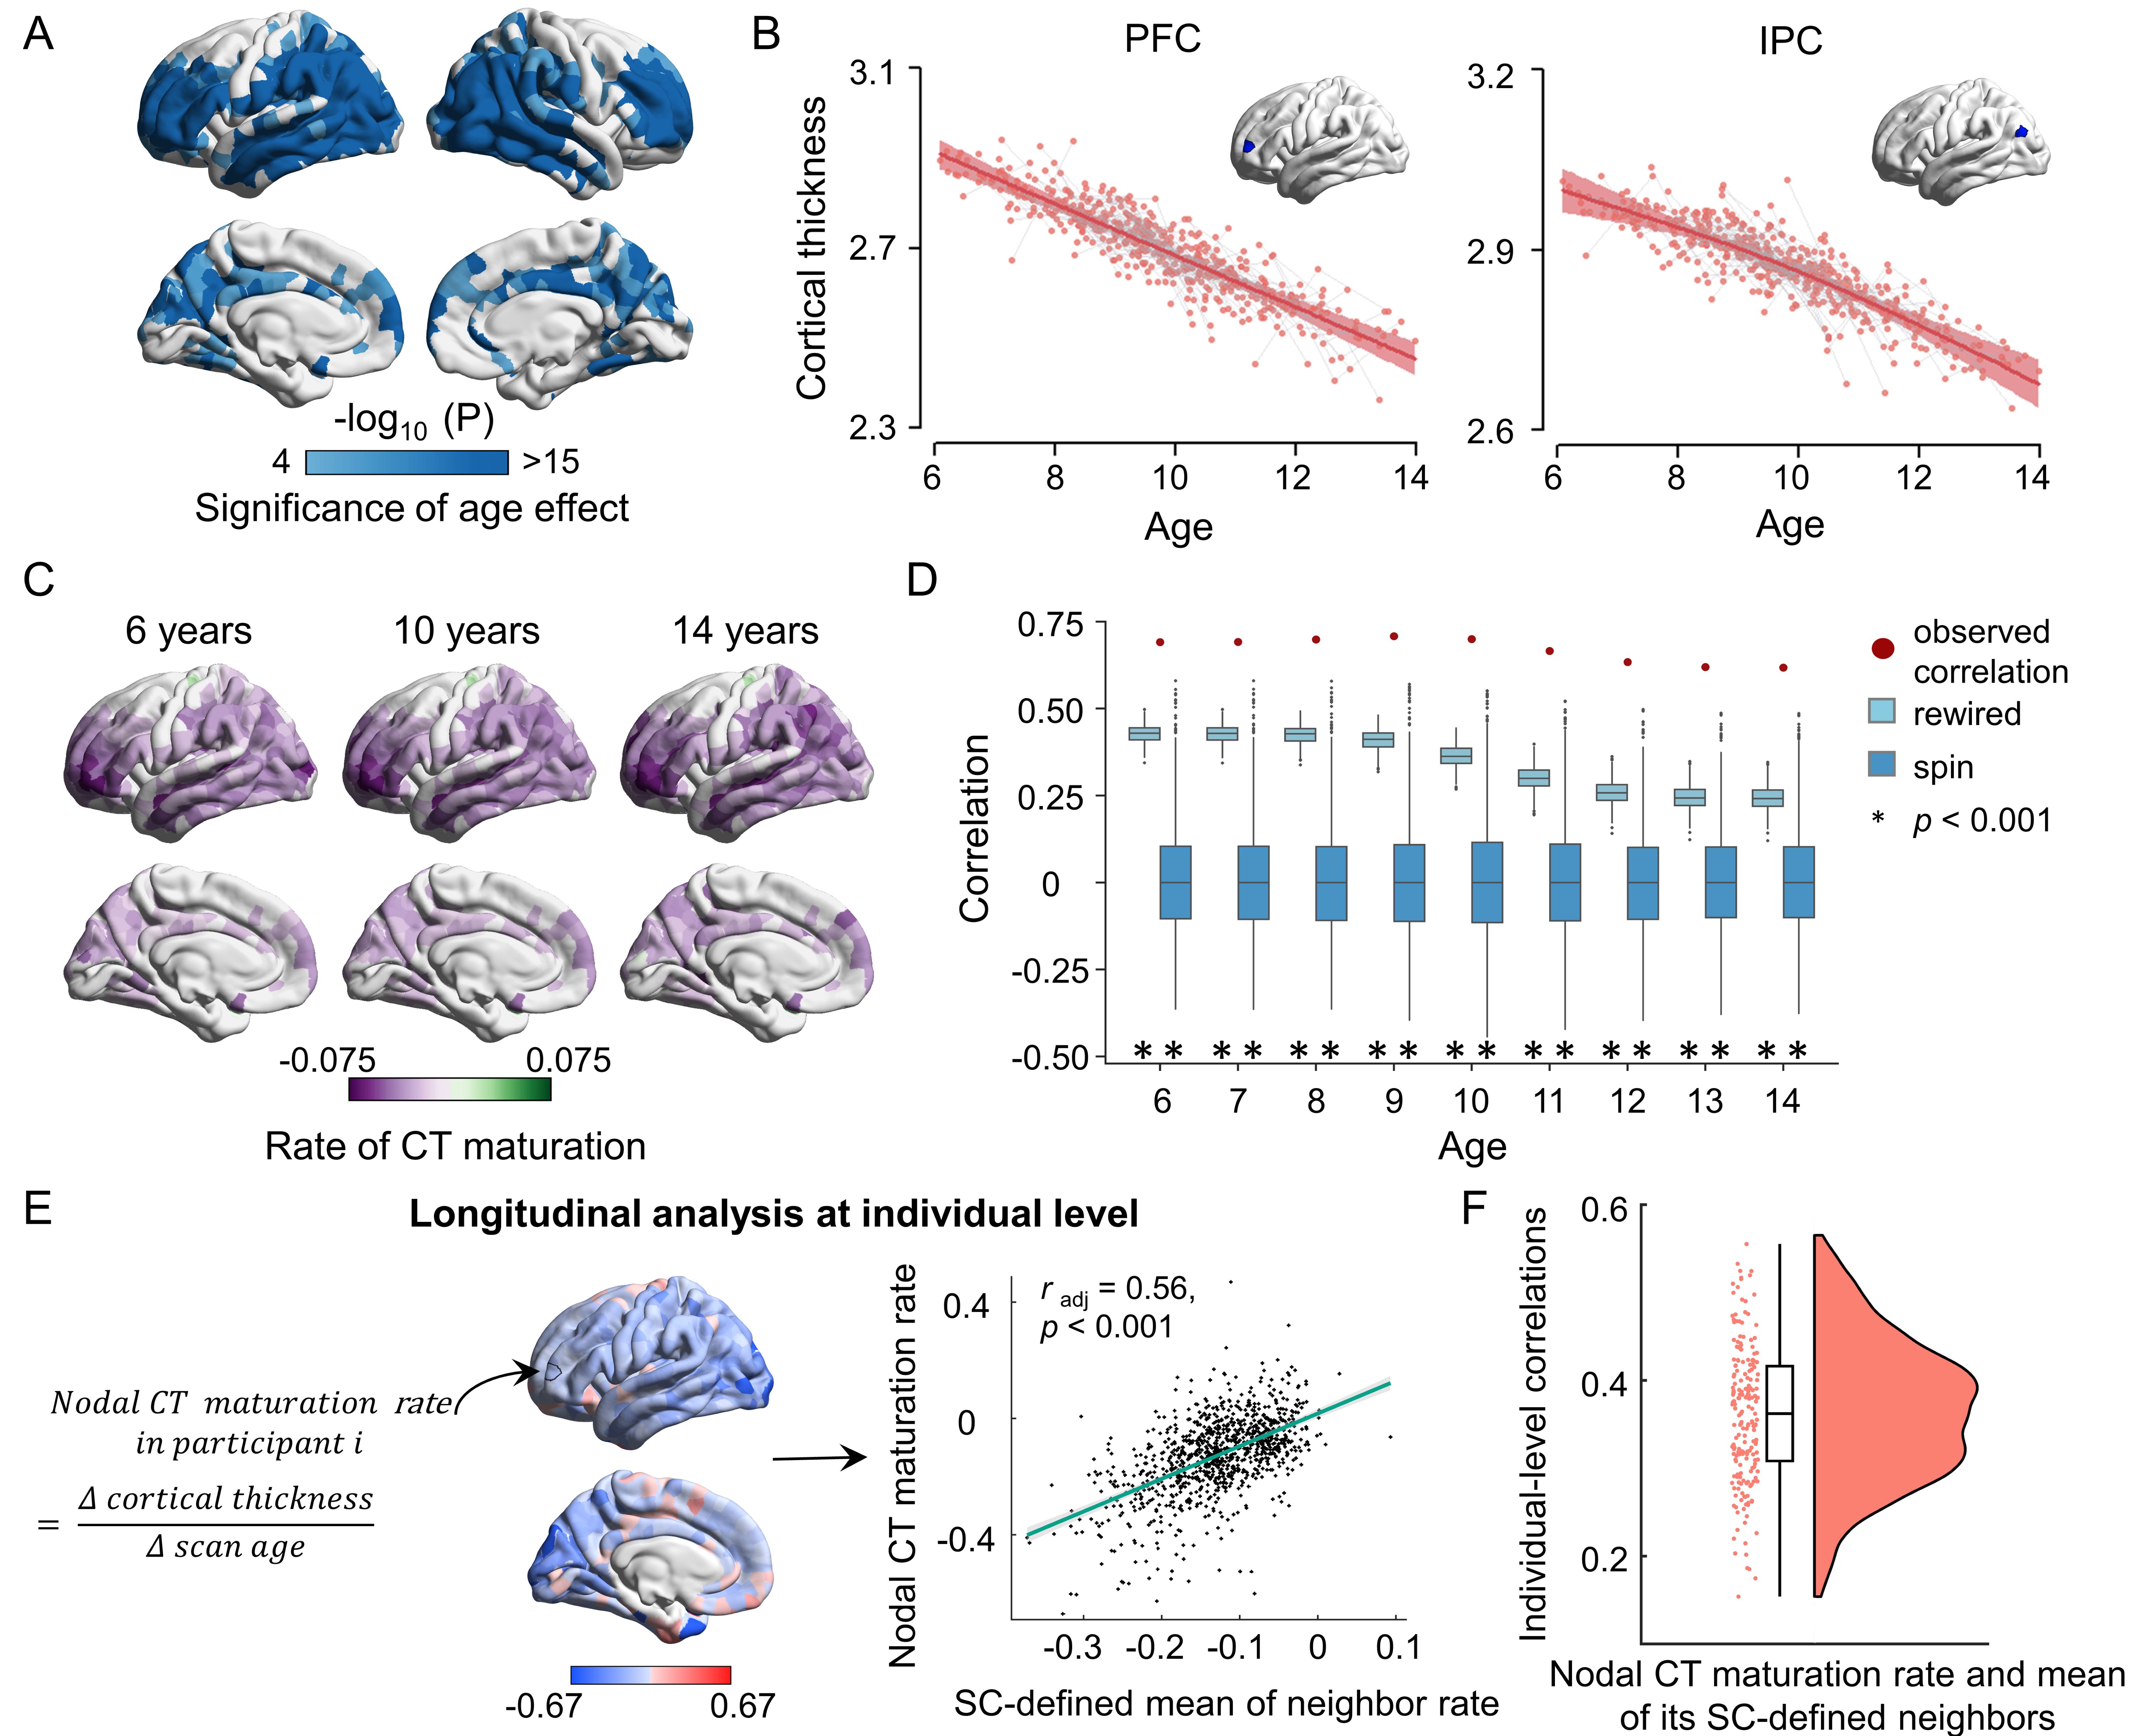
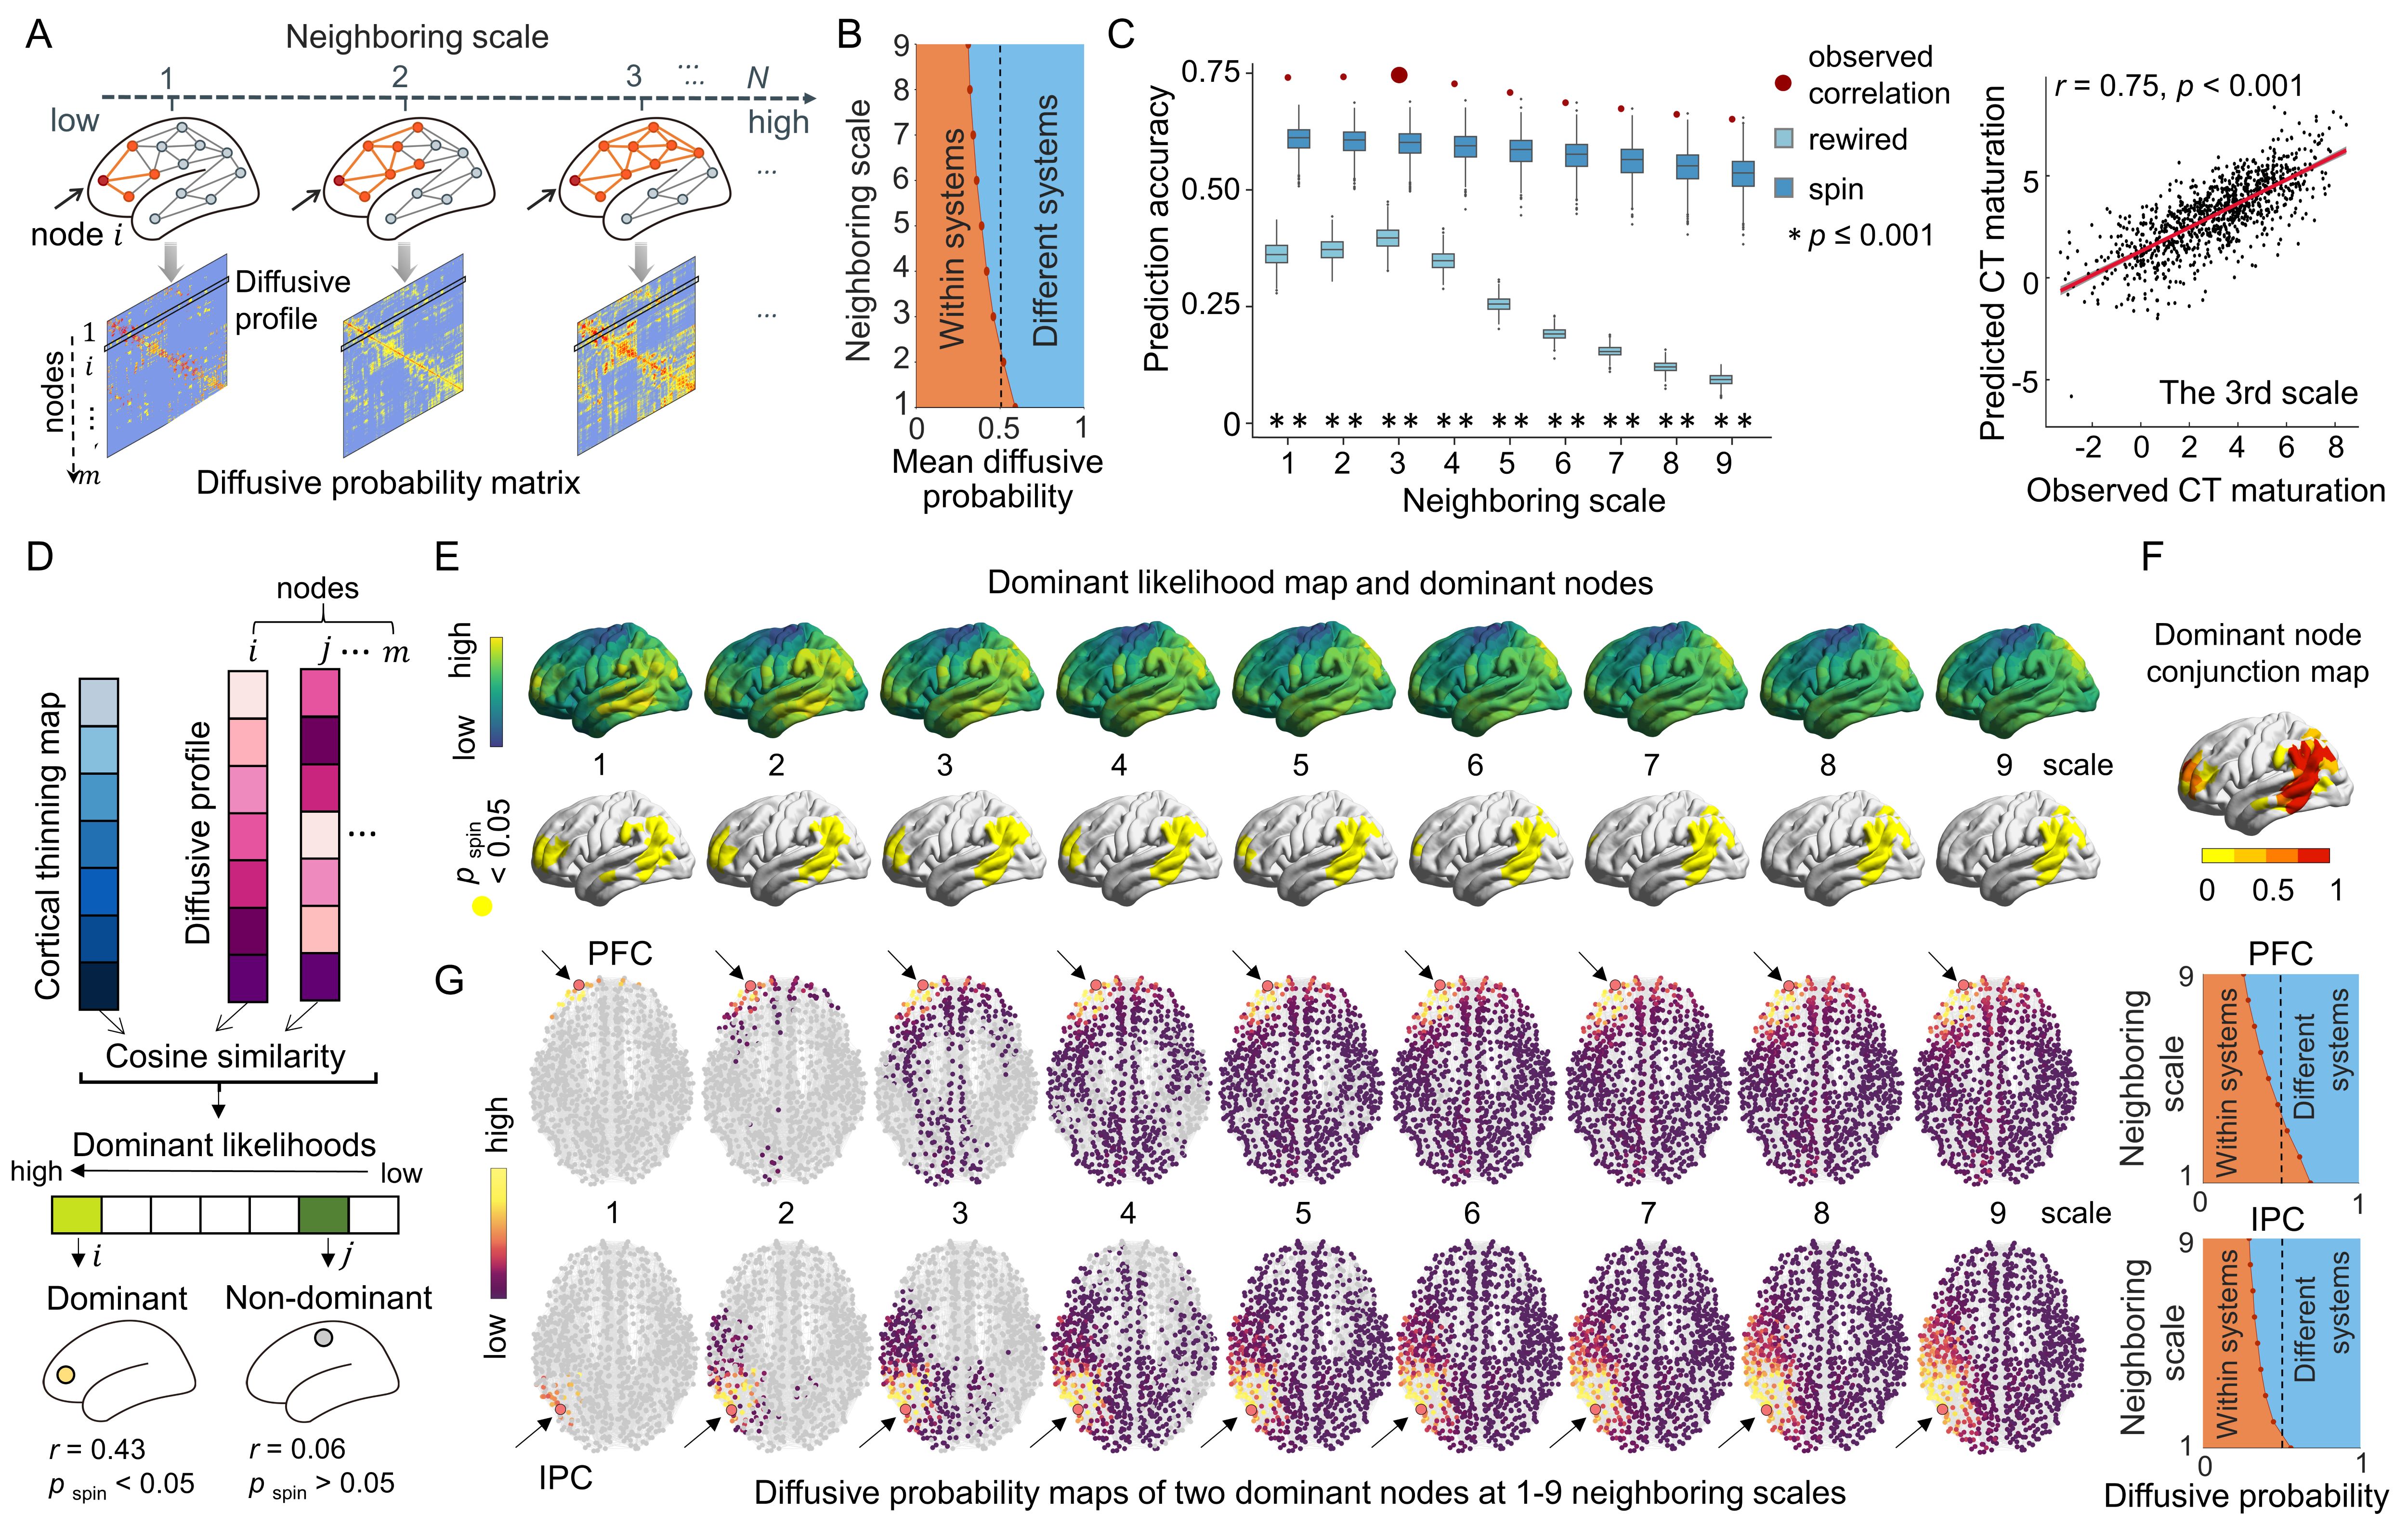
A longitudinal cohort of 314 participants (6-14 years) from the Beijing Cohort in Children Brain Development project was included (Fig. 1A). Individual cortex was parcellated into 1000 nodes (219 and 448 nodes as a validation) based on the modified Desikan-Kiliany atlas2, 3. We explored CT maturation using the three statistical models. (i) Participants were split into child and adolescent groups using age 10 years as a cutoff and the maturation extent of nodal CT was represented by estimating the T statistics of the group effect of CT in a mixed linear analysis with the sex term included as the covariate. (ii) We considered age as a continuous variable using generalized additive models and obtained maturation rates of nodal CT at each age by calculating the first derivative of the age smooth function. (iii) We estimated the individual-level CT maturation rates using the longitudinal data from each participant by calculating the nodal CT difference between two scans divided by the gap of scan ages (Fig. 3E). Then, we reconstructed each child’s WM network based on dMRI-based deterministic tractography4 and generate a binary group-level WM network that preserves length distributions5 (Fig. 2A). We first test whether the regional maturation of CT was related to its direct WM neighbors by assessing the correlation between the maturation extent/rate of nodal CT and the mean value of its directly WM-connected neighbors (Fig. 2B). Correlations were compared with a spatial permutation (“spin”)6 and a rewiring test7 (both 1000 times). Next, we proposed a graph-based diffusion model to estimate the probabilities of a node to other nodes at the nth neighboring scale during random walks (the maximum n: the network diameter). A support vector regression model was further trained with the nodal diffusive profiles at the nth scale as input features to separately predict the nodal CT maturation extent. To identify the dominant regions that lead cortical development, we calculated the cosine similarity between the CT maturation map and the nodal diffusion profiles. Finally, we used BrainSpan and Allen Human Brain Atlas datasets combined with Gene Ontology enrichment analysis to validate the relationship between spatial heterogeneity constraints and cortical gene expression levels.Results
Significant nodal cortical thinning is mainly located in the dorsolateral prefrontal, lateral temporal, and parietal regions (Fig. 1B-C, t > 4.10, Pbonf < 0.05). A significant correlation was found between the nodal CT maturation extent and the mean of its directly connected neighbors (Fig. 2C-D, radj = 0.74, P < 0.001, all prewired < 0.001, all pspin < 0.001) and these results were consistent across nodal resolutions. Similar estimations on subtypes of connections show that edges within and between frontoparietal and default mode networks, showed strong cortical constraints (Fig. 2E)8. A significant spatial correlation was found between the nodal CT maturation rate and the mean of its directly connected neighbors throughout 6 to 14 years old (r: 0.62-0.71, all pspin < 0.001, all prewired < 0.001, Fig. 3A-D). This correlation was also significant in almost all individuals (r: 0.15-0.56, pspin < 0.05 in all longitudinal samples and prewired < 0.05 in 98.6% (204/207) of longitudinal samples, Fig.3F). In diffusion model analyses, the nodal profiles at lower neighboring scales involved in more community segregation process (Fig.4A-B), and diffusive profiles of a node could significantly predict its CT maturation extent at multiple neighboring scales (r1-9 scale: 0.65-0.75, all pspin <= 0.001, prewired < 0.001, Fig.4C) with higher prediction accuracies at lower scales. Regional dominant likelihoods are spatially heterogeneous with the most consistent dominators (pspin < 0.05) distributing in bilateral lateral prefrontal parietal, and temporal regions (Fig.4D-F). By exhibiting the step-wise diffusive processes of the two most robust dominators in prefrontal and inferior parietal regions (Fig.4G), we found that dominator nodes mainly interacted with neighbors within nearby systems at low scales. These constraints were associated with the gene expression profiles of microstructural developmental processes (Fig.5A-D). Our results are highly consistent in a replication dataset which included 301 subjects (5-14 years) from the HCP-D project9, 10.Conclusions
These findings advance our understanding of network-level mechanisms and the associated genetic basis that underlies the maturational process of cortical morphology during childhood and adolescence.Acknowledgements
This work was supported by the National Key Research and Development Project (No. 2018YFA0701402), the National Natural Science Foundation of China (Nos. 82021004, 31830034, 31521063, 31221003, 32130045), Changjiang Scholar Professorship Award (No. T2015027), the Beijing Brain Initiative of Beijing Municipal Science & Technology Commission (No. Z181100001518003) and the China Postdoctoral Science Foundation (2020TQ0050 and 2022M710433). We thank Dr. Yongbin Wei for the discussion on gene expression data and Rui Chen and Haibo Zhang for their helps in data collection. We thank the National Center for Protein Sciences at Peking University in Beijing, China, for assistance with MRI data acquisition. We also thank the Allen Institute for Brain Science for providing the gene expression data. Research reported in this publication was supported by the National Institute of Mental Health of the National Institutes of Health under Award Number U01MH109589 and by funds provided by the McDonnell Center for Systems Neuroscience at Washington University in St. Louis. The content is solely the responsibility of the authors and does not necessarily represent the official views of the National Institutes of Health.References
1. Shaw, P., et al., Neurodevelopmental trajectories of the human cerebral cortex. Journal of neuroscience, 2008. 28(14): p. 3586-3594.
2. Desikan, R.S., et al., An automated labeling system for subdividing the human cerebral cortex on MRI scans into gyral based regions of interest. Neuroimage, 2006. 31(3): p. 968-980.
3. Cammoun, L., et al., Mapping the human connectome at multiple scales with diffusion spectrum MRI. Journal of neuroscience methods, 2012. 203(2): p. 386-397.
4. Yeh, F.-C., V.J. Wedeen, and W.-Y.I. Tseng, Generalized q-sampling imaging. IEEE transactions on medical imaging, 2010. 29(9): p. 1626-1635.
5. Betzel, R.F., et al., Distance-dependent consensus thresholds for generating group-representative structural brain networks. Network neuroscience, 2019. 3(2): p. 475-496.
6. Alexander-Bloch, A.F., et al., On testing for spatial correspondence between maps of human brain structure and function. Neuroimage, 2018. 178: p. 540-551.
7. Betzel, R.F. and D.S. Bassett, Specificity and robustness of long-distance connections in weighted, interareal connectomes. Proceedings of the National Academy of Sciences, 2018. 115(21): p. E4880-E4889.
8. Yeo, B.T., et al., The organization of the human cerebral cortex estimated by intrinsic functional connectivity. Journal of neurophysiology, 2011.
9. Somerville, L.H., et al., The Lifespan Human Connectome Project in Development: A large-scale study of brain connectivity development in 5-21 year olds. Neuroimage, 2018. 183: p. 456-468.
10. Liang, X., et al., Structural connectome architecture shapes the maturation of cortical morphology from childhood to adolescence. bioRxiv, 2022.
Figures