0133
Apparent Diffusion Coefficient and Blood Oxygenation Level Dependent imaging during Neural Activity in the Visual Cortex1CHUV, Lausanne, Switzerland, 2EPFL, Lausanne, Switzerland
Synopsis
Keywords: Task/Intervention Based fMRI, Modelling, Non-BOLD fMRI, Novel contrast mechanisms
Motivation: Diffusion fMRI explores brain dynamics via water ADC variations from cellular fluctuations, distinct from BOLD imaging as it bypasses neurovascular coupling. Despite its potential, dFMRI remains underexplored in fMRI research.
Goal(s): The goal of this work is to validate the utility of ADC in fMRI.
Approach: Two imaging techniques were utilized: DW-TRSE-EPI and SE-EPI, capturing ADC timecourses and T2-BOLD contrast. The study investigated correlations between a visual paradigm and voxel timecourses.
Results: Voxels exhibiting negative ADC and positive BOLD task responses align within the visual cortex. Likewise, voxels displaying positive ADC and negative BOLD responses predominantly align in the default mode network.
Impact: Diffusion fMRI could serve as a complementary method to BOLD imaging, both exploring neural activity through distinct approaches.
Introduction
Unlike blood-oxygenation-level-dependent (BOLD) functional MRI (fMRI), diffusion fMRI (dfMRI) investigates brain dynamics by tracking variations in the Apparent Diffusion Coefficient(ADC) of water that results from neuronal morphological fluctuations1. dfMRI therefore does not rely on neurovascular coupling and is more directly related to neuronal activity2. To validate the utility of ADC in fMRI, we compared the brain locations of voxels exhibiting task-correlated signals in both ADC and BOLD imaging. We also conducted a dfMRI functional connectivity(FC) analysis, focusing on subregions within the visual cortex and their interactions with the rest of the brain to uncover insights into the organizational patterns of the visual cortex.Methods
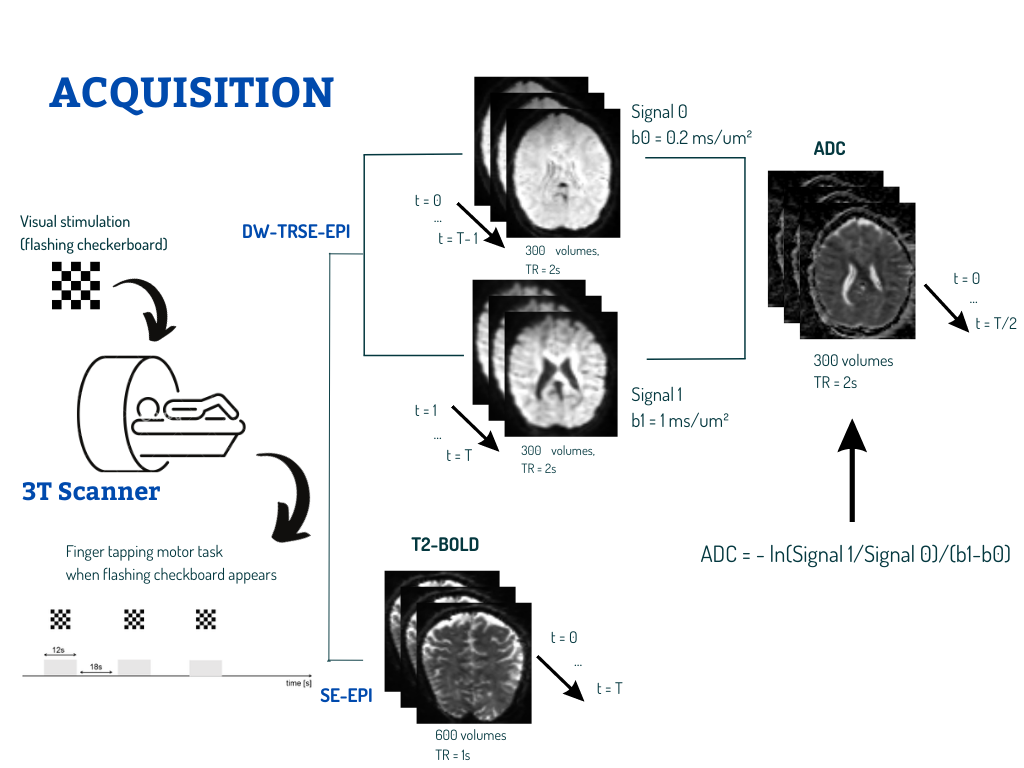
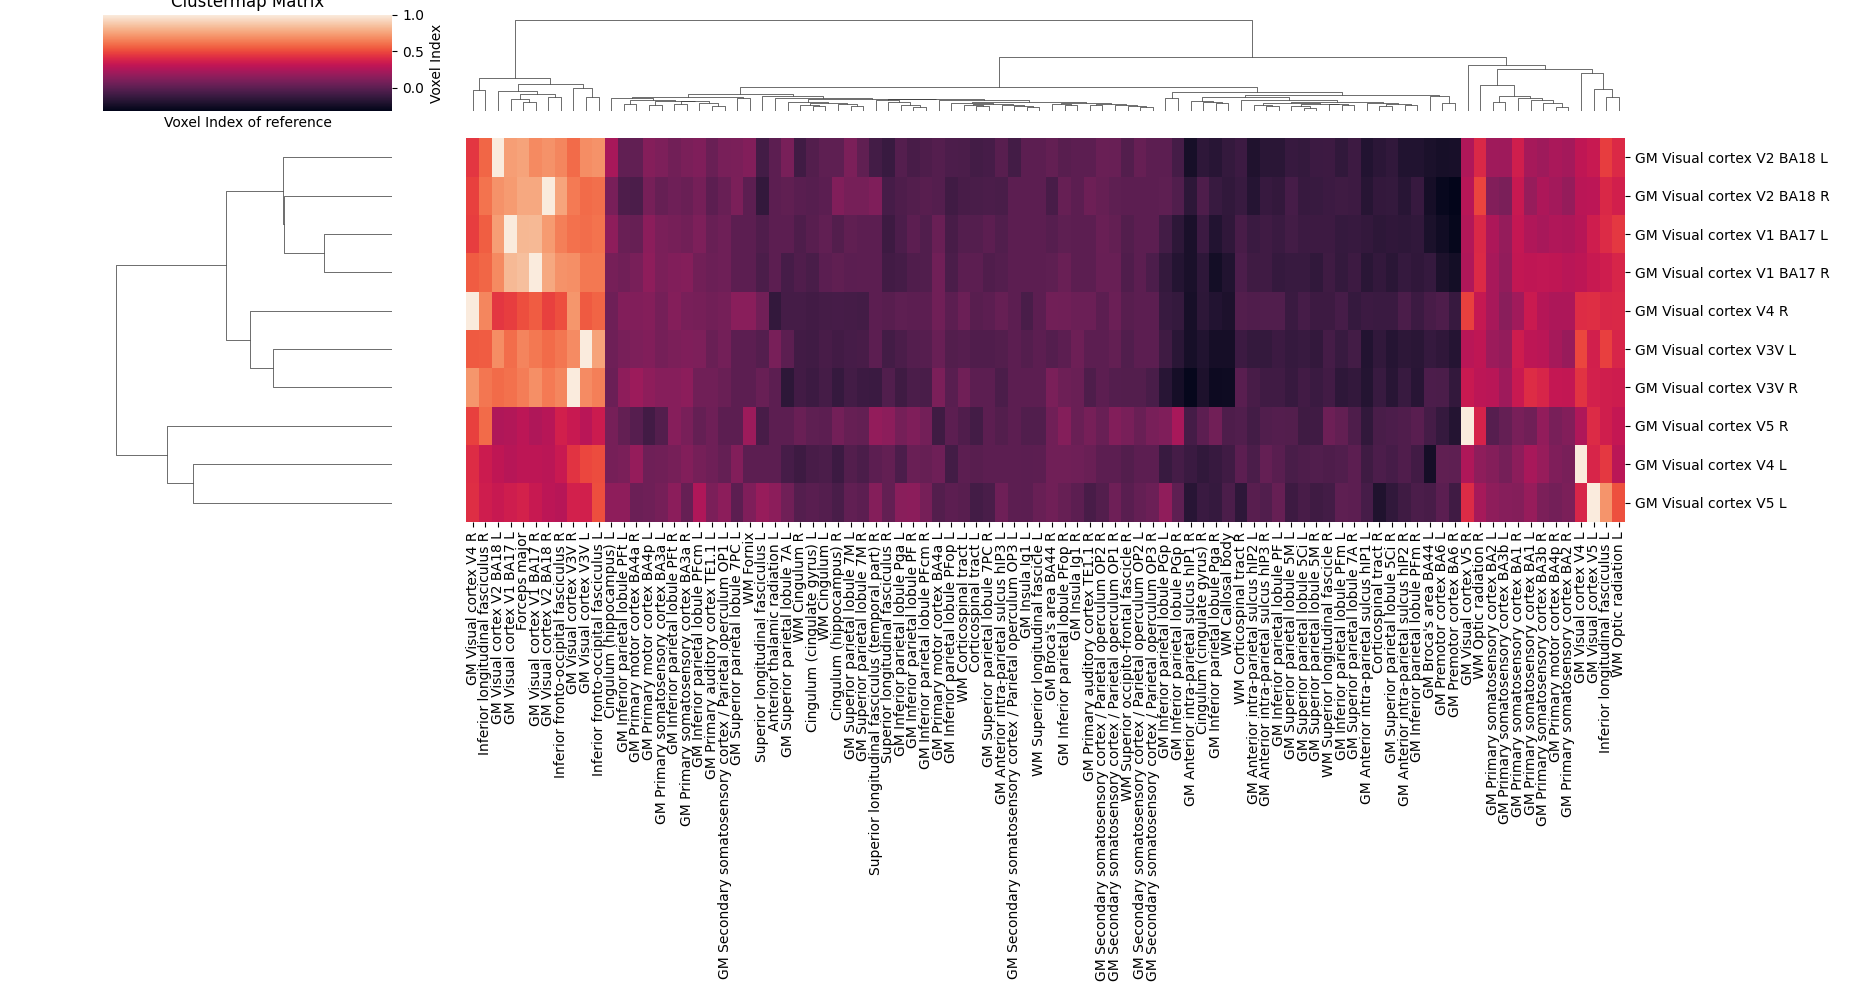
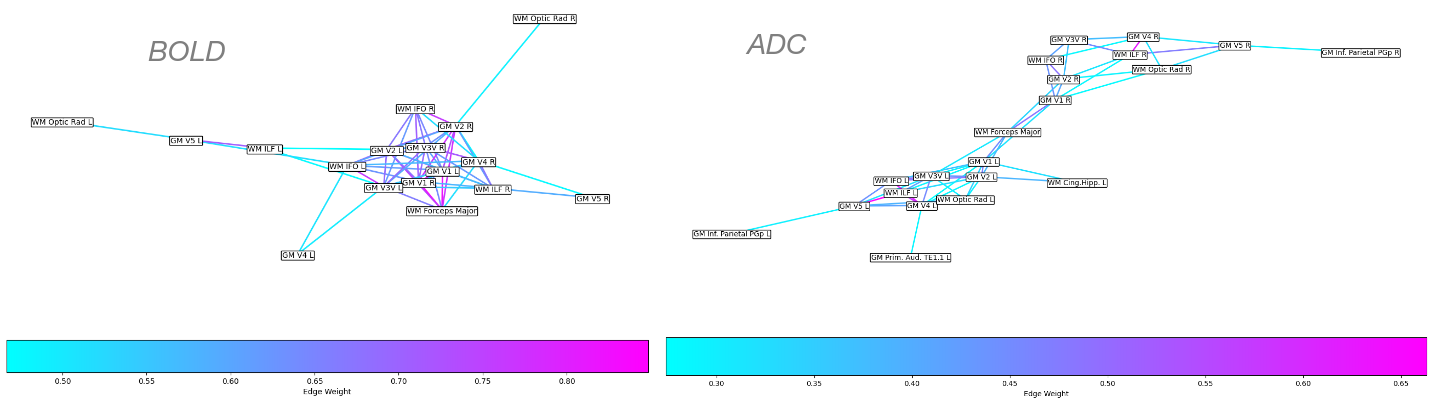
fMRI analysis : The data used in this study was obtained from a prior investigation3. Briefly, subjects were scanned on a 3T Prisma MRI scanner. Two imaging modalities were utilized for fMRI: (i) DW-TRSE-EPI with interleaved b-values of 200 and 1000s/mm2, leading to ADC timecourses with a temporal resolution of 2s (8 subjects) and optimized to reduce BOLD-like contributions resulting from blood susceptibility changes, and (ii) SE-EPI that yielded T2-BOLD contrast with a temporal resolution of 1s (4 subjects). The task consisted of visual stimulation with a flashing checkerboard (8Hz), in 20 repeated blocks (Fig. 1). Data processing was conducted according to the procedures described in3. The MRI data were captured within a slab covering the visual and motor cortex regions. To investigate which voxels significantly correlated with the task, a General Linear Model (GLM) was run in FSL with a Box function (Z > 2.3). Timecourses were averaged across cluster-corrected significant voxels, epochs and subjects.Functional connectivity: ADC and BOLD timecourses within specific brain regions were averaged and partial pearson correlations between them were calculated using the average brain timecourse as a covariate. Connectivity matrices were generated and organized into a tree structure within the visual cortex using the Nearest Point Algorithm. FC networks were then established using significant correlation values for weights (Z>2.5).
Results and Discussion
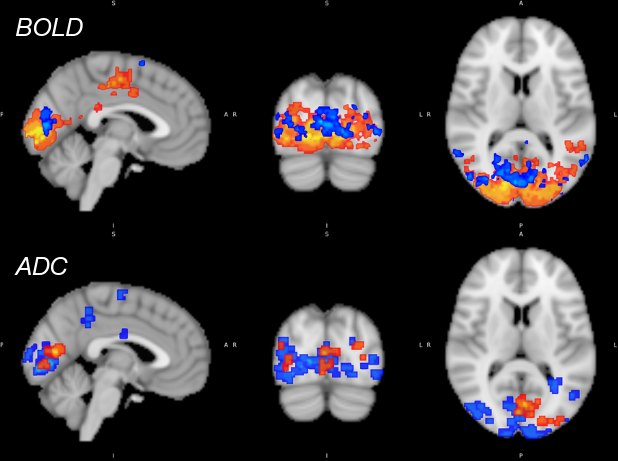
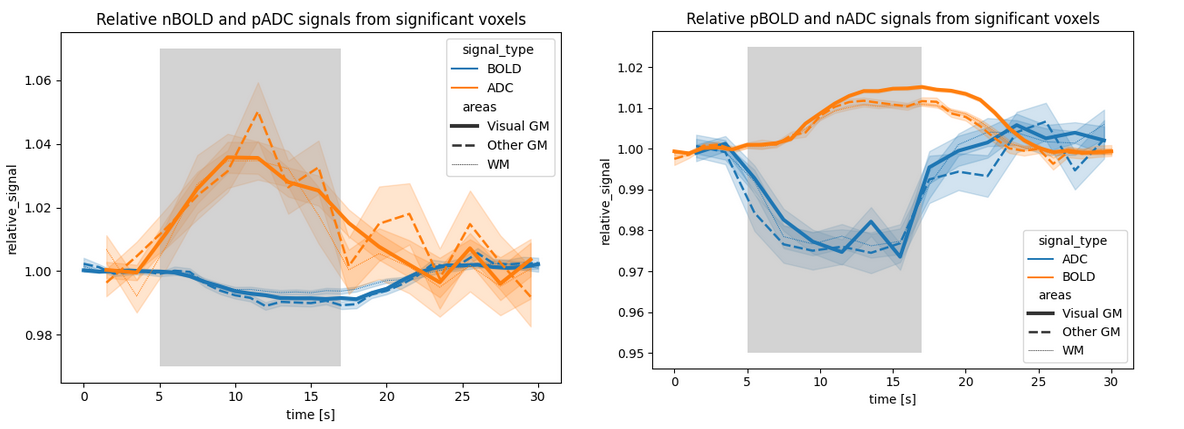
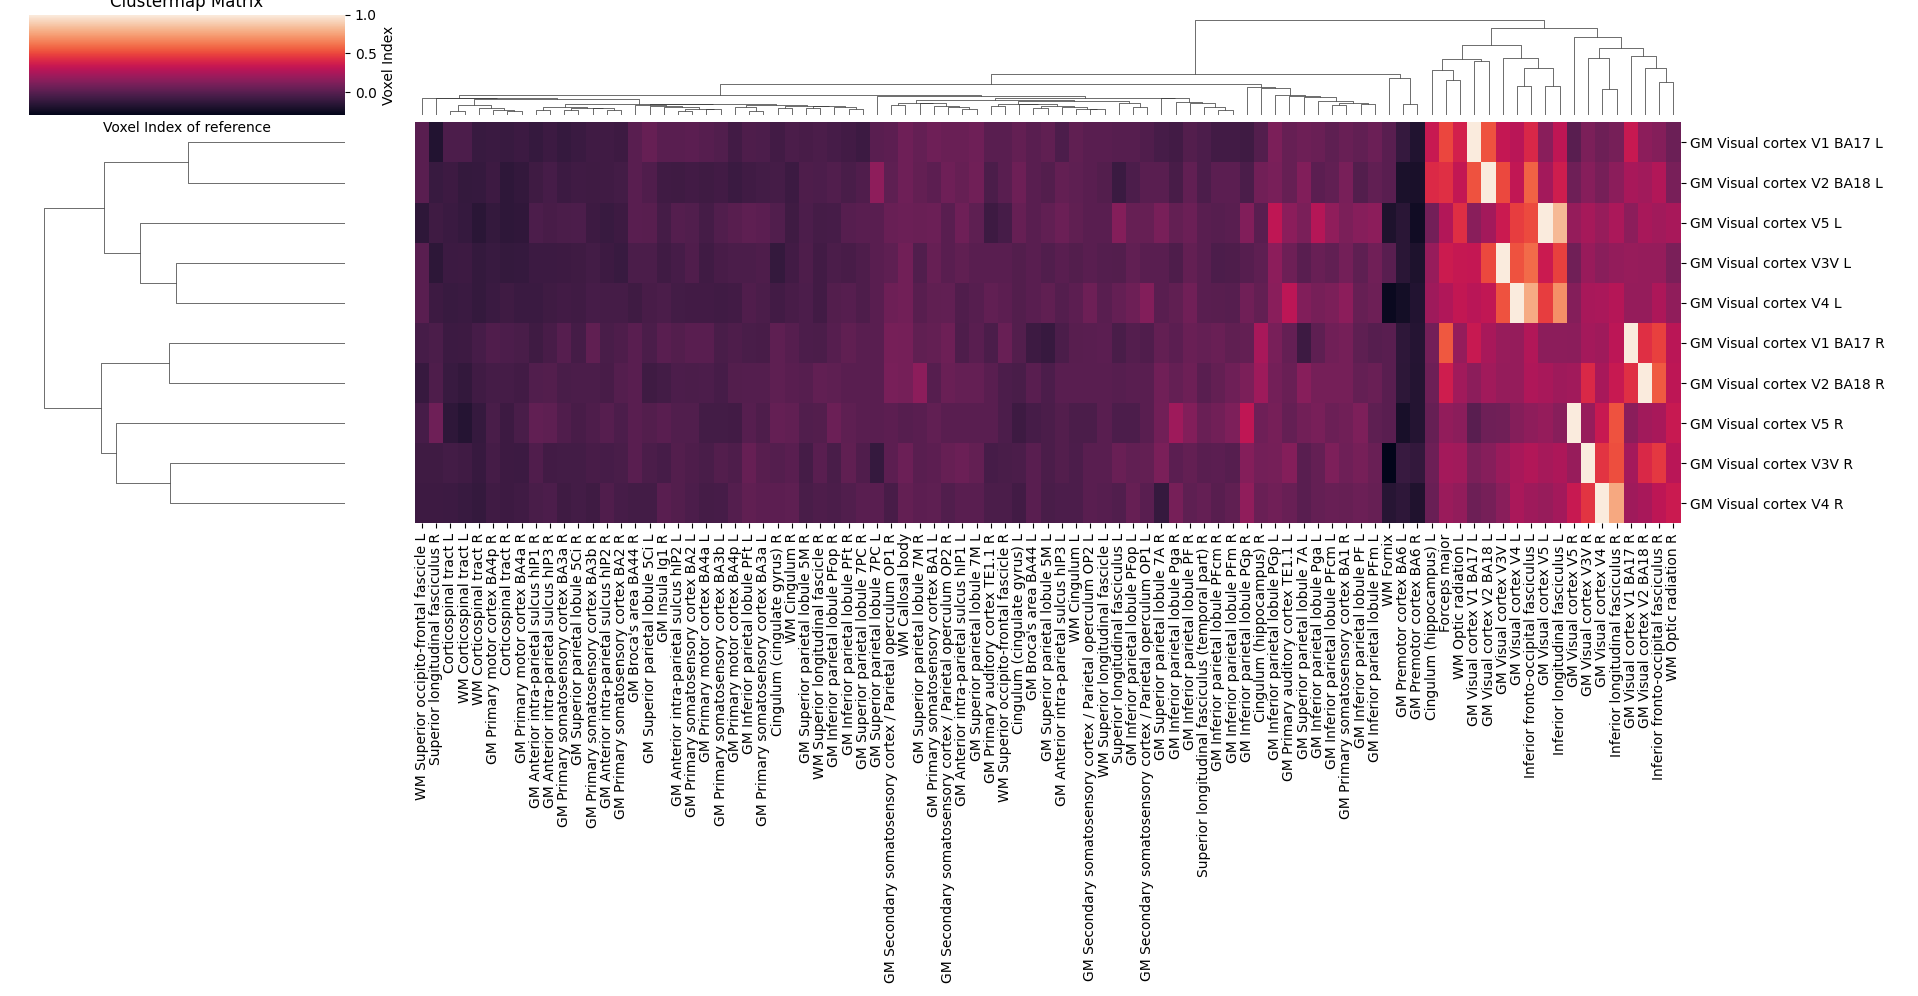
Activity clusters in the visual cortex overlap between negative ADC (nADC) and positive BOLD (pBOLD), concentrated in comparable regions (Fig.2). Similarly, regions highlighted by positive ADC (pADC) and negative BOLD(nBOLD) responses predominantly appear in the inferior parietal lobule. These results align with previous findings indicating bilateral pBOLD responses in the primary visual cortex and nBOLD responses in the default mode network (DMN), during visual stimulation4. Notably, the similarity in results between pADC and nADC suggests that nADC could effectively detect neural activity, whereas pADC might indicate neural inhibition. Figure 3 illustrates the average response profiles of significant voxels for each of the four signals. An evident delay is observed in the BOLD response, which contrasts with the absence of such delay in the ADC response. Remarkably, the response amplitudes are higher for ADC (4%) compared to the BOLD signal (1-2%). However, this disparity could be attributed to the low z-threshold and the use of a box response function for the GLM, rather than the canonical hemodynamic response function. Regarding FC, previous studies1,5 suggest that the central visual field of V1 responds first to the stimulus. The information then propagates to V2 and to other higher visual areas in two different visual pathways : the dorsal (through V5) and the ventral streams (through V3V and V4). The tree derived from ADC FC (Fig.4) aligns closely with these prior studies, grouping V1 and V2 in one branch, and V3V, V4 and V5 in another branch. This branch further distinguishes V5 from V4 and V3V, thus separating the ventral and dorsal streams. The tree constructed using BOLD FC (Fig.4) shows less coherence. The ADC FC network shows remarkably accurate patterns (Fig.5): The Forceps Major connects hemispheres as expected (linked with V1) and the optic radiation correlates across visual cortex areas. V5 connects with the inferior parietal lobule, indicating dorsal visual stream involvement. The left auditory cortex links to V4, suggesting ventral visual stream interaction in the temporal cortex. ILF and IFO tracts, part of the ventral stream5, correlate with visual areas as expected. Hippocampal cingulum links to V1 and V2, hinting at visual memory connections. In contrast, the BOLD-derived network, though less organized, displays higher correlations between ROIs than the ADC-derived network.Conclusions
Our study uncovers neural activity patterns and functional connectivity across ADC and BOLD signals during visual stimulation. Negative ADC responses overlap with positive BOLD and vice versa, while connectivity tree of the visual system using ADC reproduces expected hierarchical connections with higher fidelity than BOLD. Future research will explore the interplay between BOLD and ADC signals, revealing their complementary roles in FC analysis.Acknowledgements
This work was supported by SNSF Spark grant CRSK-2_190882 and ERC FIREPATH, SERI no.MB22.00032References
[1] Park, B. Y., Shim, W. M., James, O., & Park, H. (2019). Possible links between the lag structure in visual cortex and visual streams using fMRI. Scientific reports, 9(1), 4283. https://doi.org/10.1038/s41598-019-40728-x
[2] Denis Le Bihan, Shin ichi Urayama, Toshihiko Aso, Takashi Hanakawa, andHidenao Fukuyama. Direct and fast detection of neuronal activation in the human brain with diffusion mri. Proceedings of the National Academy ofSciences, 103(21):8263–8268, 2006.
[3] Wiktor Olszowy, Yujian Diao, and Ileana O. Jelescu. Beyond bold: Evidencefor diffusion fmri contrast in the human brain distinct from neurovascularresponse. bioRxiv, 2021
[4] Parker, D.B., Razlighi, Q.R. Task-evoked Negative BOLD Response and Functional Connectivity in the Default Mode Network are Representative of Two Overlapping but Separate Neurophysiological Processes. Sci Rep 9, 14473 (2019). https://doi.org/10.1038/s41598-019-50483-8
[5] Sang-Han Choi, Gangwon Jeong, Young-Bo Kim, Zang-Hee Cho,Proposal for human visual pathway in the extrastriate cortex by fiber tracking method using diffusion-weighted MRI, NeuroImage, Volume 220, 2020, 117145, ISSN 1053-8119
Figures